A bitcoin indicator that warned of seller exhaustion in early September has flipped bullish, bolstering the case for a move above $70,000.
The moving average convergence divergence (MACD) histogram, a technical analysis indicator used to gauge trend strength and changes, has flipped positive on the weekly chart for the first time since April, according to charting platform TradingView. It signifies a renewed upward shift in momentum, implying a bullish resolution to bitcoin's prolonged back and forth trading between $50,000 and $70,000.
The positive technical outlook is consistent with consensus that the Fed's renewed bias for rate cuts, growing probability of supposedly pro-crypto Republican candidate Donald Trump winning the Nov. 5 U.S. election, weakness in the anti-risk Japanese yen will likely power bitcoin to at least $100,000 by the end of December.
The MACD is calculated by subtracting bitcoin's average price level during the past 26 periods (weeks in this case) from the average over the past 12 weeks. The signal line is then calculated as a nine-week average of the MACD and the difference between the MACD and signal lines is plotted as a histogram.
It's one of the widely tracked indicators out there, and how it moved relative to the cryptocurrency's price in the first half of September signaled downtrend exhaustion.
Bitcoin has risen nearly 30% since hitting lows under $53,000 in early September. The leading cryptocurrency by market value rose to $69,500 during Monday's Asian trading hours.
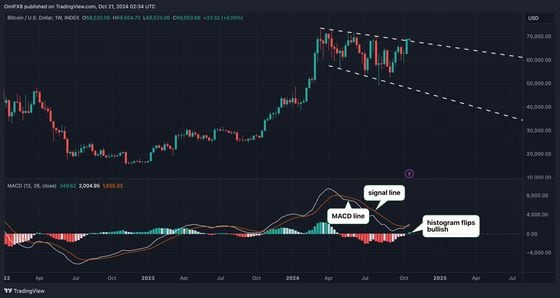
The MACD's latest bullish signal follows a similar flash from the "line break chart" last week and suggests that bulls might finally succeed in establishing a foothold above the $70,000 mark, having failed to do so several times since the first quarter.
A similar MACD bull cross happened in October last year as bitcoin moved past the long-held $30,000 resistance, eventually reaching a record high of over $73,000 in March this year. The bull cross seen in late 2022 marked the bear market bottom.
免责声明:本文章仅代表作者个人观点,不代表本平台的立场和观点。本文章仅供信息分享,不构成对任何人的任何投资建议。用户与作者之间的任何争议,与本平台无关。如网页中刊载的文章或图片涉及侵权,请提供相关的权利证明和身份证明发送邮件到support@aicoin.com,本平台相关工作人员将会进行核查。


