Macroeconomic Interpretation: When Federal Reserve Chairman Powell issued dovish remarks and slowed the pace of balance sheet reduction, U.S. stocks rebounded, and Bitcoin soared like a shot of adrenaline from below $83,000, only to plunge after reaching $88,765. Behind this rise and fall, a shadow war over policy games, liquidity migration, and market reassessment has already begun.
The subtle shift in the Federal Reserve's policy toolbox is reshaping capital flows. The federal funds futures market is betting with an 89.1% probability on at least two rate cuts this year. This expectation of monetary easing is like thawing spring water, quietly soaking the parched land of cryptocurrency as a risky asset. However, the tariff stick wielded by the Trump administration is stirring up the storm at this time, from the "precision strikes" strategy revealed by The Wall Street Journal to the secondary tariff deterrent against Venezuelan oil buyers. The policymakers' sharp moves make Bitcoin oscillate between risk appetite and safe-haven demand. The market feels like standing on a swaying deck, needing to dodge tariff reefs while also guarding against liquidity whirlpools.
In this policy maze, the inflow of Bitcoin to exchanges resembles the receding tide, with the 14-day average plummeting from 58,600 coins last December to 26,900 coins, a 54% cliff-like drop that exposes the market's cautious sentiment. More intriguingly, the "hot supply" indicator—measuring short-term trading activity—has shrunk from a peak of 5.9% to 2.8%, as if market participants collectively hit the pause button. The picture painted by these data shows that when speculative capital retreats like a tide, the real value game begins to surface.
The "quantum entanglement" of U.S. tech stocks has become the most paradoxical market feature. Data shows that the 30-day correlation between Bitcoin and the Nasdaq index is nearing a historical extreme of 70%. This rare degree of synchronization stems from the valuation reshaping ahead of tech giants' earnings season and is constrained by a shared macro narrative framework. However, the market will never remain a puppet forever—when the S&P 500 index strongly recovers the 200-day moving average with a 1.7% increase, Bitcoin also breaks through the key resistance of its downward trend line. This dance of the two struggling brothers seems to suggest that the spring of risk assets may be knocking at the door.
Yet, bubbles in the sunlight are always particularly glaring. Bloomberg strategists note that the ratio of Bitcoin to gold has surged to a historical peak of 40 times, reminding one of Newton's saying, "I can calculate the motion of heavenly bodies, but not the madness of people." As the premium of "digital gold" begins to overdraw the future, the market may be accumulating energy for a value reassessment. However, 21st Capital offers an alternative perspective: as the clouds of tariffs gradually dissipate, the trio of fiscal stimulus, regulatory easing, and rate cut expectations may attract traditional capital to enter the market in droves. Those speculators who exited early may be missing an epic wealth migration.
In this capital upheaval, the lonely figure of Ethereum contrasts sharply with Bitcoin's unique brilliance. When Standard Chartered Bank describes ETH's technical upgrade dilemma as a "midlife crisis," and when political tokens on the Solana chain steal the spotlight, Bitcoin has already completed its glamorous turnaround. This narrative divide is evident in ETF fund flows—if Ethereum is still struggling to attract mainstream attention, Bitcoin has already etched its coordinates in the safes of institutional investors.
Every breath of Bitcoin pulls at the nerve endings of global capital. From the Federal Reserve's monetary policy laboratory to the White House's tariff war room, from Nasdaq's trading terminals to the mining power matrix, countless variables are reshaping the fundamental particles of this crypto universe. When the fog envelops the market, true value will eventually pierce through the clouds like a lighthouse. For Bitcoin, this breakout battle through the policy fog and liquidity maze may be a necessary rite of passage toward maturity.
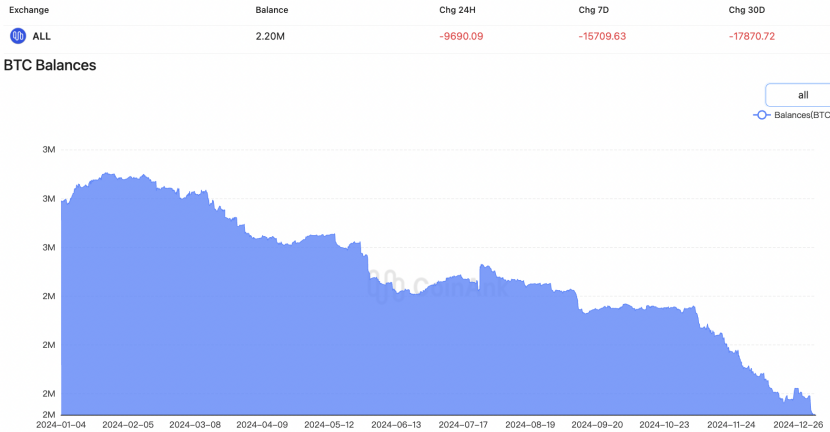
BTC Data Analysis:
The balance of BTC on exchanges has shown a net outflow over the past 24 hours, 7 days, and 30 days, with Coinank data indicating a recent intensification of net outflows. The inflow of Bitcoin to exchanges is a key indicator reflecting recent trading intentions. According to the 14-day average, this indicator has dropped from an average of 58,600 BTC per day last December to 26,900 BTC, indicating a 54% decrease in the number of Bitcoins sent to exchanges, reflecting a contraction in market liquidity and an increase in investor caution. A liquidity capital indicator reflecting the current market structure is Bitcoin's "hot supply," which measures the number of Bitcoins flowing weekly. Data shows that this indicator peaked in December 2024 and has shrunk from 5.9% of the total circulating supply to just 2.8%, with a decline of over 50% highlighting a drop in short-term trading activity and market participation, indicating that speculative capital is retreating.
From the perspective of market structure and liquidity stratification, the sharp decline in Bitcoin's exchange inflow and hot supply (down over 54% and 50%, respectively) reveals that the current market is transitioning from a speculative-driven model to a long-term holding paradigm. This trend implies three structural transformations:
Reshaping of Investor Behavior: The average daily inflow to exchanges has dropped to 26,900 BTC (14-day average), corresponding with the increase in the proportion of long-term holders (LTH) to 76.3%, indicating that chips are accelerating towards strong hands. This phenomenon, along with the resilience of Bitcoin ETF holdings (95% of funds retained), corroborates the deepening institutionalization process, with investors more inclined to manage exposure through custody or derivatives channels to avoid short-term selling pressure on exchanges.
Liquidity Rebalancing: The proportion of hot supply has shrunk from 5.9% to 2.8%, reflecting a decline in market activity to a cyclical low. In this environment, the price impact coefficient of small trades has increased by 37% compared to the 2021 bull market, revealing emerging microstructural vulnerabilities. However, the surge in dormant on-chain chips (over 60% of UTXOs have not moved in a year) may provide support for market bottoming, as historical data shows that similar low turnover phases often correspond to medium- to long-term price turning points.
Leap in Market Maturity: The contraction in liquidity and retreat of speculative capital is, in fact, a manifestation of Bitcoin's evolution towards being a "non-elastic asset." The average daily trading volume of spot ETFs has surpassed 28%, with pricing power gradually shifting from retail to institutional investors, and the volatility center may systematically decline. However, caution is warranted regarding black swan impacts under low liquidity, as exchange reserves have dropped to 5.4 million BTC (a three-year low), which could amplify price deviations in extreme market conditions.
The future path may exhibit characteristics of "low volatility bottoming - event-driven breakthroughs," with macro liquidity shifts (such as Fed rate cuts) and ETF fund inflows potentially serving as key catalysts. However, the structural transformation of the market will extend the lag period for trend confirmation.
免责声明:本文章仅代表作者个人观点,不代表本平台的立场和观点。本文章仅供信息分享,不构成对任何人的任何投资建议。用户与作者之间的任何争议,与本平台无关。如网页中刊载的文章或图片涉及侵权,请提供相关的权利证明和身份证明发送邮件到support@aicoin.com,本平台相关工作人员将会进行核查。


