What is the Correlation Between Bitcoin and the Global Financial Market?
Author: Sam Callahan | Blockchain in Plain Language

Sam Callahan is a research analyst at Swan Bitcoin, a financial institution focused on the cryptocurrency sector. He primarily studies Bitcoin's market trends, macroeconomic dynamics, and the intersection of digital assets with traditional financial markets.
Recently commissioned by Lyn Alden, he wrote a research report exploring the close correlation between Bitcoin prices and global liquidity.
The following is the main text:
Bitcoin aligns with global liquidity trends 83% of the time over any 12-month period, a higher percentage than any other major asset class, making it a strong indicator of liquidity conditions.
Although Bitcoin has a high correlation with global liquidity, it is not completely immune to short-term deviations, especially during periods of extreme valuation, influenced by specific events or internal market dynamics.
By combining global liquidity conditions with on-chain valuation metrics for Bitcoin, a more nuanced understanding of Bitcoin's cyclical changes can be achieved, helping investors identify moments when internal market dynamics may temporarily detach Bitcoin from liquidity trends.

Understanding how asset prices fluctuate with changes in global liquidity has become key for investors to enhance returns and effectively manage risk. In today's market, asset prices are increasingly influenced directly by central bank policies, with liquidity conditions becoming a primary driver of asset prices, while fundamentals alone no longer play a decisive role.
This has been particularly evident since the global financial crisis (2007-2008). Since then, an increasing number of unconventional monetary policies have become the dominant force driving asset prices. Central banks have turned the market into a massive trading arena by adjusting liquidity leverage, as economist Mohamed El-Erian noted, central banks have become the "only main character."
Stanley Druckenmiller also agrees, stating: “Returns do not drive the overall market; it’s the Federal Reserve… focus on central banks, focus on changes in liquidity… most people in the market are looking for returns and traditional indicators, but what actually drives the market is liquidity.”
This is particularly evident when studying the close relationship between the S&P 500 index and global liquidity.
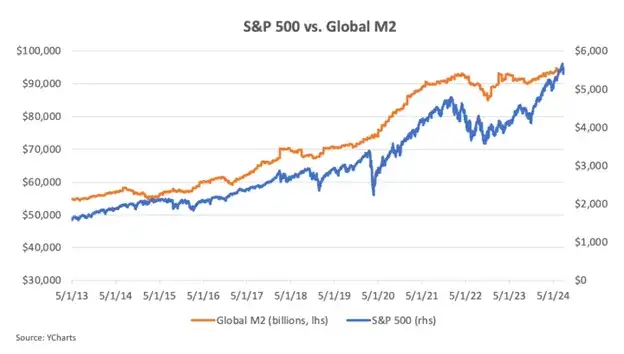
The explanation of the above chart can be summarized as a simple supply and demand relationship. If more funds are available to purchase assets, whether stocks, bonds, gold, or Bitcoin, the prices of these assets typically rise. Since 2008, central banks have injected a large amount of fiat currency into the system, and asset prices have risen accordingly. In other words, monetary inflation has driven asset price inflation.
In this context, understanding how to measure global liquidity and how different assets respond to changes in liquidity has become crucial for investors navigating liquidity-driven markets.
01
How to Measure Global Liquidity
There are many ways to measure global liquidity, but in this analysis, we will use global M2—a broad measure of the money supply that includes physical currency, demand deposits, savings deposits, money market securities, and other forms of easily accessible cash.
Bitcoin Magazine Pro provides a method for measuring global M2, which aggregates data from eight major economies: the United States, China, the Eurozone, the United Kingdom, Japan, Canada, Russia, and Australia. This metric well represents global liquidity as it reflects the total amount of funds available for spending, investment, and borrowing globally. In other words, it can be seen as a measure of the total amount of global credit creation and central bank money printing.
It is important to note that global M2 is denominated in U.S. dollars. Lyn Alden explained the significance of this in an article:
As the global reserve currency, the dollar serves as the primary unit of account for global trade, contracts, and debt, making the strength of the dollar crucial. When the dollar strengthens, the debt burden of countries increases; conversely, when the dollar weakens, the debt burden decreases. The dollar-denominated global broad money supply is a key indicator of global liquidity. How quickly are fiat currency units being created? How strong is the dollar in the global currency market?
When global M2 is measured in U.S. dollars, it not only reflects the relative strength of the dollar but also indicates the speed of credit creation, making it a reliable indicator for assessing global liquidity conditions.
While there are other ways to measure global liquidity, such as considering short-term government debt or the global foreign exchange swap market, in the following articles, when we refer to "global liquidity," we will consider it as "global M2."
02
Why Bitcoin May Be the Purest Liquidity Barometer
For years, one of the assets that has shown a strong correlation with global liquidity is Bitcoin. As global liquidity expands, Bitcoin typically performs well; conversely, when liquidity contracts, Bitcoin often underperforms. This dynamic has led some to refer to Bitcoin as a "liquidity barometer."
The following chart clearly shows how Bitcoin prices align with changes in global liquidity.
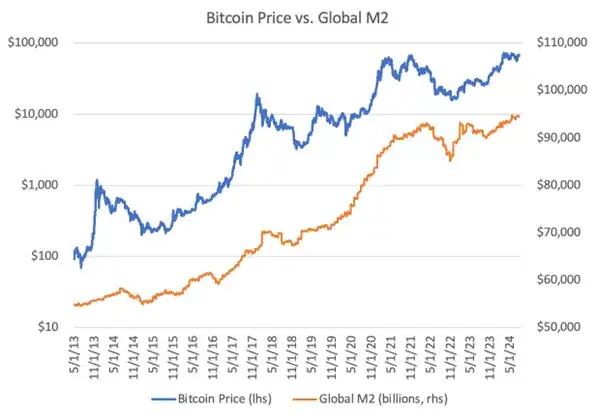
Similarly, comparing Bitcoin's year-over-year changes with global liquidity further highlights the close correlation between the two. When liquidity increases, Bitcoin prices rise; when liquidity decreases, Bitcoin prices fall.
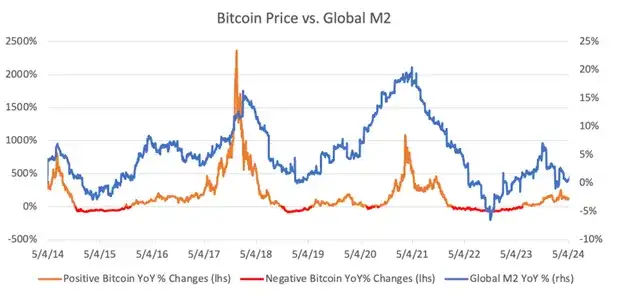
From the above charts, it is evident that Bitcoin's price is very sensitive to changes in global liquidity. But is it truly the most sensitive asset to liquidity in today's market?
Overall, risk assets show a more significant correlation with liquidity conditions. In a liquidity-rich environment, investors tend to adopt higher risk/higher return investment strategies, shifting funds toward assets perceived as riskier; conversely, when liquidity tightens, investors typically turn to what they consider safer assets. This can explain why assets like stocks often perform well when liquidity increases.
However, stock prices are also influenced by other factors unrelated to liquidity. For example, stock performance is partly driven by earnings and dividends, so their prices are often correlated with economic performance. This may weaken the pure correlation between stocks and global liquidity. Additionally, U.S. stocks are affected by passive inflows from retirement accounts (like 401(k)s), which can influence their performance regardless of liquidity conditions. These passive inflows may provide a buffer for U.S. stocks during liquidity fluctuations, resulting in lower sensitivity to global liquidity conditions.
The relationship between gold and liquidity is more complex. On one hand, gold benefits from increased liquidity and a weaker dollar; on the other hand, it is also viewed as a safe-haven asset. During liquidity contractions and market shifts toward risk aversion, investors seeking safety may increase demand for gold. Therefore, even when liquidity drains from the system, gold prices may still perform well. This means that gold's performance may not be closely related to liquidity conditions. Similarly, bonds are also seen as safe-haven assets, so their correlation with liquidity conditions may be lower.
Returning to Bitcoin, unlike stocks, Bitcoin does not have earnings or dividends, nor does it have structural buying pressure affecting its performance. Compared to gold and bonds, during Bitcoin's adoption cycle, most capital pools still view it as a risk asset. This may allow Bitcoin to maintain a relatively pure correlation with global liquidity.
If this holds true, it is a valuable insight for Bitcoin investors and traders. For long-term holders, understanding the correlation between Bitcoin and liquidity can provide deeper insights into the driving forces behind price movements. For traders, Bitcoin serves as an effective tool to express views on the future direction of global liquidity.
This article aims to delve into the correlation between Bitcoin and global liquidity, compare its relationship with other asset classes, identify periods of correlation disruption, and share insights on how investors can leverage this information for an advantage in the future.
03
Quantifying the Correlation Between Bitcoin and Global Liquidity
When analyzing the correlation between Bitcoin and global liquidity, it is essential to consider both the strength and direction of the correlation. The strength of the correlation reveals the degree of synchronization between the two variables. A stronger correlation means that changes in global M2 have a more predictable impact on Bitcoin prices, whether in the same direction or the opposite. Understanding this strength is key to assessing Bitcoin's sensitivity to fluctuations in global liquidity.
By analyzing data from May 2013 to July 2024, it is clear that Bitcoin is highly sensitive to liquidity. During this period, the correlation between Bitcoin prices and global liquidity reached 0.94, indicating a very strong positive correlation. This suggests that, within this timeframe, Bitcoin prices are highly sensitive to changes in global liquidity.
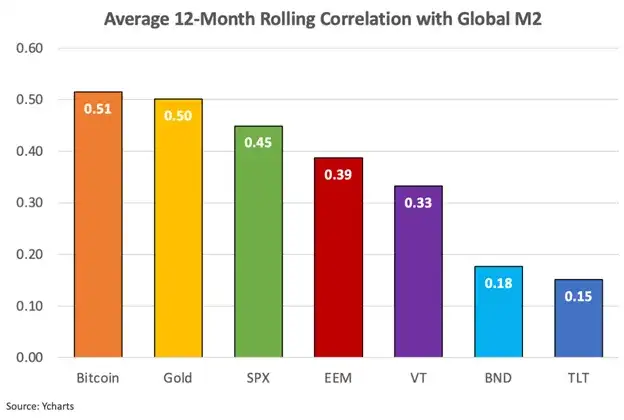
However, when observing the 12-month rolling correlation, the average correlation between Bitcoin and global liquidity drops to 0.51. This still represents a moderate positive correlation but is significantly lower than the overall correlation.
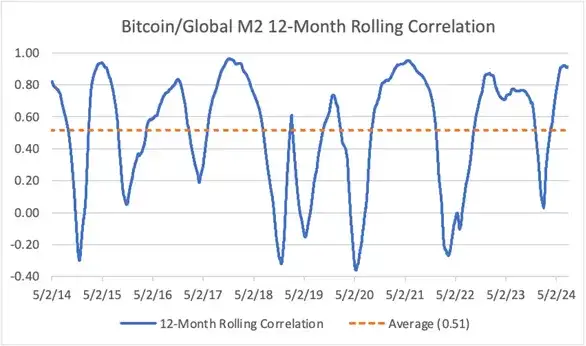
This indicates that Bitcoin's price does not maintain such a close connection to liquidity on an annual basis. Furthermore, when examining the 6-month rolling correlation, the correlation further declines to 0.36. This means that as the time frame shortens, the deviation between Bitcoin's price and its long-term liquidity trend increases, suggesting that short-term price fluctuations are more likely influenced by specific factors related to Bitcoin itself rather than liquidity conditions.
To better understand the correlation between Bitcoin and global liquidity, we compared it with other assets, including the SPDR S&P 500 ETF (SPX), Vanguard Total World Stock ETF (VT), iShares MSCI Emerging Markets ETF (EEM), iShares 20+ Year Treasury Bond ETF (TLT), Vanguard Total Bond Market ETF (BND), and gold.
Within a rolling 12-month timeframe, Bitcoin has the highest average correlation with global liquidity, followed by gold. The correlation of stock indices is slightly weaker, while bond indices have the lowest correlation with liquidity, which aligns with expectations.
When analyzing the year-over-year changes in asset correlation with global liquidity, the correlation of stock indices is slightly stronger than that of Bitcoin, followed by gold and bonds.
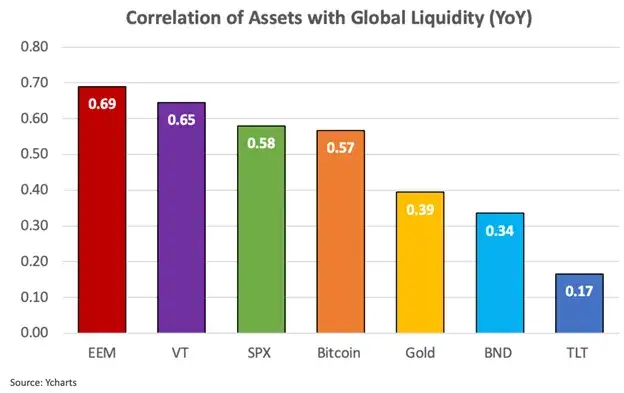
One reason stocks may have a tighter correlation with global liquidity in year-over-year changes compared to Bitcoin is Bitcoin's high volatility. Bitcoin often experiences significant price fluctuations within a year, which can distort its correlation with global liquidity. In contrast, stock indices typically exhibit smaller price fluctuations, making them more consistent with the year-over-year changes in global M2. Nevertheless, in the year-over-year analysis, Bitcoin still shows a moderate strong correlation with global liquidity.
The data above emphasizes three key points: 1) The performance of stocks, gold, and Bitcoin is closely related to global liquidity; 2) Bitcoin has a stronger overall correlation compared to other asset classes and has the highest correlation over a 12-month rolling period; 3) The correlation between Bitcoin and global liquidity weakens as the time frame shortens.
The directional consistency of Bitcoin with liquidity makes it unique. As mentioned earlier, a strong positive correlation does not guarantee that the two variables always move in the same direction, which is particularly evident in volatile assets like Bitcoin, which may temporarily deviate from the long-term relationship with relatively stable indicators like global M2. Therefore, by combining both strength and direction, a more comprehensive understanding of the interaction between Bitcoin and global M2 can be achieved.
By examining the directional consistency of this relationship, we can better understand the reliability of its correlation, which is particularly important for investors focused on long-term trends. If you know that Bitcoin tends to follow the directional changes of global liquidity most of the time, you can more confidently predict its future price movements based on changes in liquidity conditions.
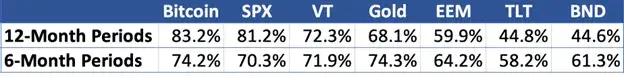
In terms of directional consistency, Bitcoin has the highest directional consistency with global liquidity among all analyzed assets. Over a 12-month period, the probability of Bitcoin moving in the same direction as global liquidity is 83%, and over a 6-month period, it is 74%, highlighting the consistency of the directional relationship.
The following chart further illustrates the directional consistency of Bitcoin with global liquidity over a 12-month period compared to other asset classes.
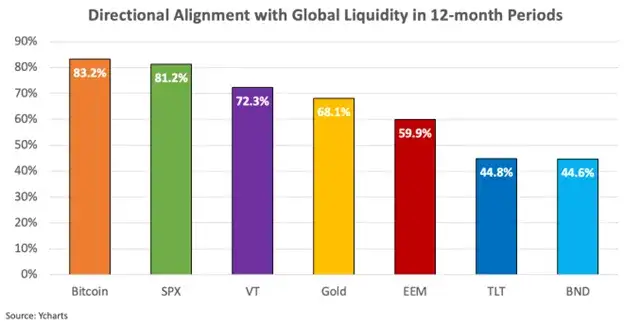
These findings are significant, as they indicate that while the strength of the correlation may vary with the time frame, the price direction of Bitcoin generally aligns with the direction of global liquidity. Additionally, Bitcoin's price direction is closer to global liquidity than any other traditional asset.
This analysis shows that the relationship between Bitcoin and global liquidity is not only significant in strength but also very stable in directional consistency. The data indicates that Bitcoin is more sensitive to liquidity conditions than other traditional assets, especially over longer time frames.
For investors, this means that global liquidity may be a key driver of Bitcoin's long-term price performance, and thus should be taken into account when assessing Bitcoin market cycles and predicting future price fluctuations. For traders, this means that Bitcoin serves as a highly sensitive investment tool to express views on global liquidity, suitable for those with strong beliefs about liquidity.
04
Identifying Breaks in Bitcoin's Long-Term Liquidity Relationship
Although the overall correlation between Bitcoin and global liquidity is strong, research has found that Bitcoin's price often deviates from liquidity trends during shorter rolling periods. These deviations may be due to internal market dynamics exerting greater influence at certain moments in Bitcoin's market cycle or triggered by industry-specific events related to Bitcoin.
These individual events refer to occurrences within the broader cryptocurrency industry that typically lead to rapid changes in market sentiment or trigger large-scale liquidations. For example, significant bankruptcies, exchange hacks, regulatory dynamics, or the collapse of Ponzi schemes are typical examples of such events.
By observing historical instances where the 12-month rolling correlation between Bitcoin and global liquidity weakened, it is clear that Bitcoin's price often decouples from liquidity trends during major industry events. The following chart illustrates the breaks in the correlation between Bitcoin and liquidity during these significant events.
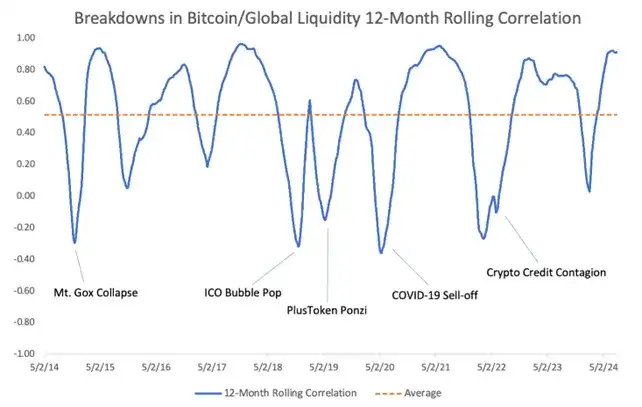
Key events, such as the Mt. Gox collapse, the PlusToken Ponzi scheme unraveling, and the crypto credit collapse triggered by the Terra/Luna crash and the bankruptcies of several crypto lending institutions, led to panic and selling pressure that were largely unrelated to global liquidity trends.
The COVID-19 market crash in 2020 provides another example. Amid widespread panic selling and risk aversion, Bitcoin initially experienced a sharp decline. However, as central banks implemented unprecedented liquidity injection measures, Bitcoin quickly rebounded, highlighting its sensitivity to changes in liquidity. The break in correlation at that time was primarily due to a sudden shift in market sentiment rather than changes in liquidity conditions.
While understanding the impact of these individual events on the correlation between Bitcoin and global liquidity is crucial, their unpredictability reduces their operability for investors. However, as the Bitcoin ecosystem matures, infrastructure improves, and regulatory transparency increases, I expect the frequency of these "black swan" events to decrease over time.
05
How Supply-Side Dynamics Affect Bitcoin's Liquidity Correlation
In addition to individual events, another significant pattern in the weakening correlation between Bitcoin and liquidity often coincides with periods when Bitcoin prices reach extreme valuations and subsequently decline sharply. This is particularly evident during the market peaks of 2013, 2017, and 2021, when Bitcoin's liquidity correlation decoupled due to significant price pullbacks from high levels.
While liquidity primarily affects demand, understanding the distribution patterns on the supply side is also helpful in identifying periods when Bitcoin may deviate from its long-term correlation with global liquidity. The main source of available supply comes from long-term holders taking profits when Bitcoin prices rise. Additionally, there will be new issuance from block rewards, but this portion is relatively small and continues to decrease with each halving event. During bull markets, long-term holders often reduce their holdings and sell to new buyers until new demand reaches saturation. At this saturation point, the peak of the bull market typically occurs.
A key metric for assessing this behavior is the HODL Wave, which measures the percentage of Bitcoin held by long-term investors (those holding for at least one year) relative to the total circulating supply. In simple terms, it reflects the proportion of available supply held by long-term investors at any given moment.
Historically, this metric tends to decline during bull markets as long-term holders choose to sell, while it rises during bear markets as they accumulate. The following chart highlights this behavior, with red circles marking cycle peaks and green circles indicating bottoms.
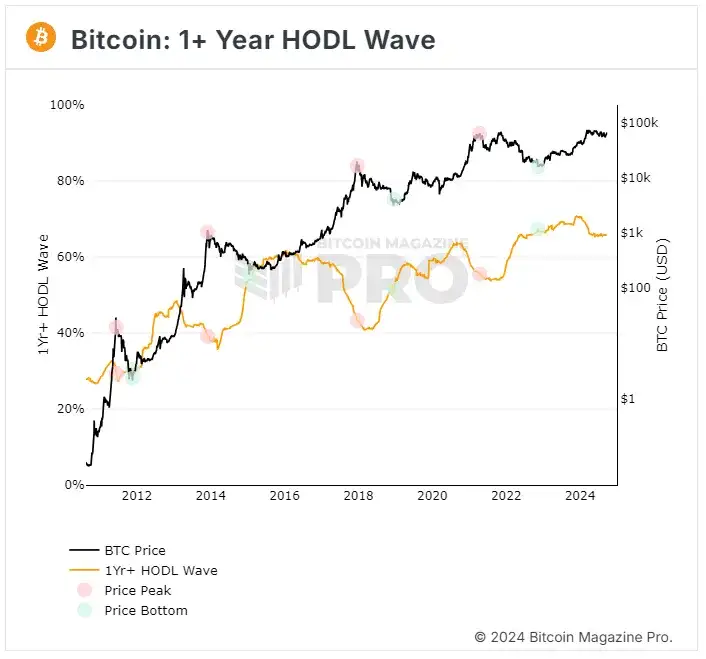
This illustrates the behavior of long-term holders in the Bitcoin cycle. Long-term holders tend to take profits when Bitcoin is perceived as overvalued and accumulate when it is considered undervalued.
The question then becomes… “How do we determine whether Bitcoin is undervalued or overvalued to better predict when supply will flood into or be withdrawn from the market?”
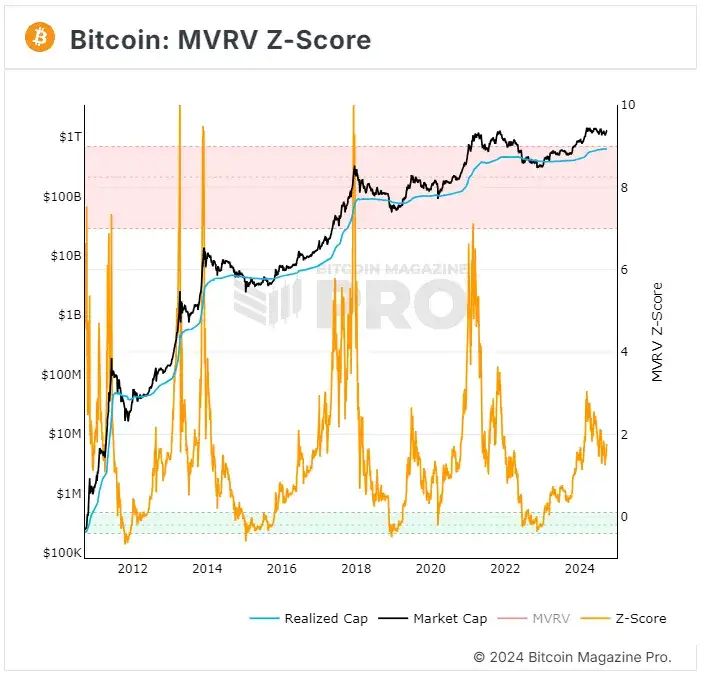
Although the dataset is still relatively small, the Market Value to Realized Value Z-score (MVRV Z-score) has proven to be an effective tool for identifying whether Bitcoin has reached extreme valuation levels. The MVRV Z-score consists of the following three components:
1) Market Value—the current market capitalization, calculated by multiplying Bitcoin's price by the total number of coins in circulation.
2) Realized Value—the average price at which each Bitcoin or unspent transaction output (UTXO) was last traded on-chain, multiplied by the total circulating supply, essentially representing the on-chain cost basis for Bitcoin holders.
3) Z-Score—this score measures the degree of deviation between market value and realized value, expressed in standard deviations, highlighting periods of extreme overvaluation or undervaluation.
When the MVRV Z-score is high, it indicates a significant gap between market price and realized price, with many holders enjoying unrealized profits. While this may intuitively seem positive, it can also signal that Bitcoin is overvalued or overbought—meaning long-term holders may begin to distribute their Bitcoin and take profits.
Conversely, when the MVRV Z-score is low, the market price is close to or below the realized price, indicating that Bitcoin is undervalued or oversold—this presents a good opportunity for investors to accumulate.
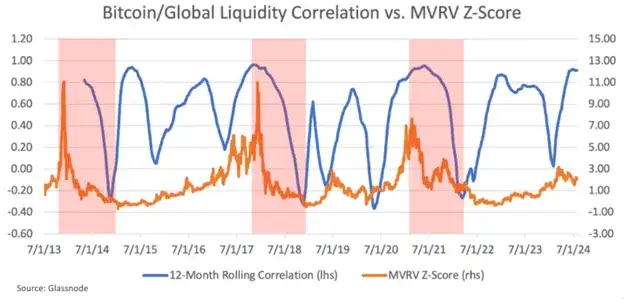
When overlaying the MVRV Z-score with the 12-month rolling correlation between Bitcoin and global liquidity, a clear pattern begins to emerge. When the MVRV Z-score sharply declines from historical highs, the 12-month rolling correlation also seems to decrease. The red rectangles below highlight these periods.
This phenomenon suggests that when Bitcoin prices reach extremely high valuation levels and begin to adjust, the correlation with global liquidity may weaken. This weakened correlation reflects the impact of supply-side dynamics and the dominant role of market sentiment on price behavior. During these periods, long-term holders typically choose to take profits, while short-term traders may overreact to price fluctuations, leading to a disconnection between Bitcoin's short-term price movements and changes in global liquidity conditions.
This analysis provides important insights for investors, helping them identify potential shifts in the relationship between Bitcoin and liquidity, as well as possible market corrections at high valuation levels.
This indicates that when Bitcoin's MVRV Z-score declines from high levels and the correlation with liquidity weakens, internal market dynamics (such as profit-taking and panic selling) may exert a greater influence on Bitcoin prices than global liquidity conditions. At extreme valuation levels, Bitcoin's price movements are often driven more by market sentiment and supply-side dynamics rather than global liquidity trends.
For traders and investors, this insight is crucial as it helps identify those rare moments when Bitcoin deviates from its long-term liquidity correlation. For example, suppose a trader firmly believes that the dollar will depreciate and that global liquidity will rise over the next year. Based on this analysis, Bitcoin would be the best tool to express this view, as it serves as the purest liquidity barometer in the market.
However, these findings suggest that traders should first assess Bitcoin's MVRV Z-score or other similar valuation metrics before placing orders. If Bitcoin's MVRV Z-score indicates extreme overvaluation, traders should remain cautious, even if the liquidity environment is positive, as internal market dynamics may overwhelm liquidity conditions and trigger price corrections.
By simultaneously monitoring the long-term correlation between Bitcoin and global liquidity along with its MVRV Z-score, investors and traders can better predict how Bitcoin's price will respond to changes in liquidity conditions. This approach enables market participants to make more informed decisions and potentially increase their chances of success when investing in or trading Bitcoin.
06
Conclusion
The strong correlation between Bitcoin and global liquidity makes it an important macroeconomic barometer for investors and traders. This correlation is not only strong but also exhibits a high degree of directional consistency compared to other asset classes. Bitcoin can be viewed as a mirror reflecting the pace of global money creation and the relative strength of the dollar. Unlike traditional assets such as stocks, gold, or bonds, Bitcoin maintains a relatively pure correlation with liquidity.
However, Bitcoin's correlation is not perfect. Research has found that the strength of Bitcoin's correlation tends to decline over shorter time frames, emphasizing the importance of identifying moments when the correlation between Bitcoin and liquidity may break. Internal market dynamics, such as idiosyncratic shocks or extreme valuation levels, can cause Bitcoin to temporarily deviate from global liquidity conditions. These moments are crucial for investors as they often signal price corrections or accumulation phases.
Combining global liquidity analysis with on-chain indicators (such as the MVRV Z-score) helps to better understand Bitcoin's price cycles and assists in identifying times when prices are more likely driven by market sentiment rather than broad liquidity trends.
Michael Saylor famously stated, “All your models are broken.” Bitcoin represents a paradigm shift in currency itself. Therefore, no statistical model can perfectly capture the complexity of the Bitcoin phenomenon, but certain models can serve as useful tools for decision-making, even if they are not perfect. As the old saying goes, “Nothing is absolute in this world; some models are still useful.”
Since the global financial crisis (2007-2008), central banks have distorted financial markets through unconventional policies, making liquidity a primary driver of asset prices. Therefore, understanding changes in global liquidity is crucial for any investor hoping to succeed in today’s market. In the past, macro analyst Luke Gromen described Bitcoin as “the last functioning smoke detector,” as it can signal changes in liquidity conditions, a view that has been supported.
When Bitcoin's alarm sounds, investors should listen carefully to effectively manage risk and position themselves appropriately to seize future market opportunities.
Original Title: Bitcoin: A Global Liquidity Barometer
Original Link: https://www.lynalden.com/bitcoin-a-global-liquidity-barometer/
Original Author: Sam Callahan, Lyn Alden
Translation: Baihua Blockchain
Article Link: https://www.hellobtc.com/kp/du/09/5442.html
Source: https://mp.weixin.qq.com/s/qRck57vh8tYaexxbZf30Rw
免责声明:本文章仅代表作者个人观点,不代表本平台的立场和观点。本文章仅供信息分享,不构成对任何人的任何投资建议。用户与作者之间的任何争议,与本平台无关。如网页中刊载的文章或图片涉及侵权,请提供相关的权利证明和身份证明发送邮件到support@aicoin.com,本平台相关工作人员将会进行核查。


