Author: Lisa, LD Capital
BTC is known as "digital gold," and traders often use the Nasdaq index as an important reference for BTC price changes. Gold and the Nasdaq index are typical representatives of safe-haven assets and risky assets, respectively, which seems contradictory. This article will uncover whether BTC belongs to safe-haven assets by exploring the factors influencing the prices of BTC and gold.
I. Overview of Gold and BTC
1. Gold
Unit of Measurement for Gold
"Ounce" is the internationally recognized unit of measurement for gold, where 1 troy ounce = 1.0971428 avoirdupois ounces = 31.1034768 grams.
Gold Purity
Purity refers to the purity of the metal, generally expressed as a percentage, and can also be represented by "carat" or "K." Gold purity can be divided into 24 "carats" or "K." Each carat (abbreviated as "k") contains 4.166% gold, with the gold content for each carat as follows:
8k = 8 * 4.166% = 33.328% (333‰)
9k = 9 * 4.166% = 37.494% (375‰)
10k = 10 * 4.166% = 41.660% (417‰)
12k = 12 * 4.166% = 49.992% (500‰)
14k = 14 * 4.166% = 58.324% (583‰)
18k = 18 * 4.166% = 74.998% (750‰)
20k = 20 * 4.166% = 83.320% (833‰)
21k = 21 * 4.166% = 87.486% (875‰)
22k = 22 * 4.166% = 91.652% (916‰)
24k = 24 * 4.166% = 99.984% (999‰)
For example, the standard delivery object for London gold is a gold ingot with a gold content of not less than 99.50% and a weight of 400 troy ounces. The Shanghai gold has varieties such as Au99.99, Au99.95, Au99.5, Au50g, and Au100g for delivery:
Au99.99 is a standard weight of 1 kilogram, with a purity of not less than 99.99% gold ingot.
Au99.95 is a standard weight of 3 kilograms, with a purity of not less than 99.95% gold ingot.
Au99.5 is a standard weight of 12.5 kilograms, with a purity of not less than 99.50% gold ingot.
Au50g is a standard weight of 0.05 kilograms, with a purity of not less than 99.99% gold bar.
Au100g is a standard weight of 0.1 kilograms, with a purity of not less than 99.99% gold bar.
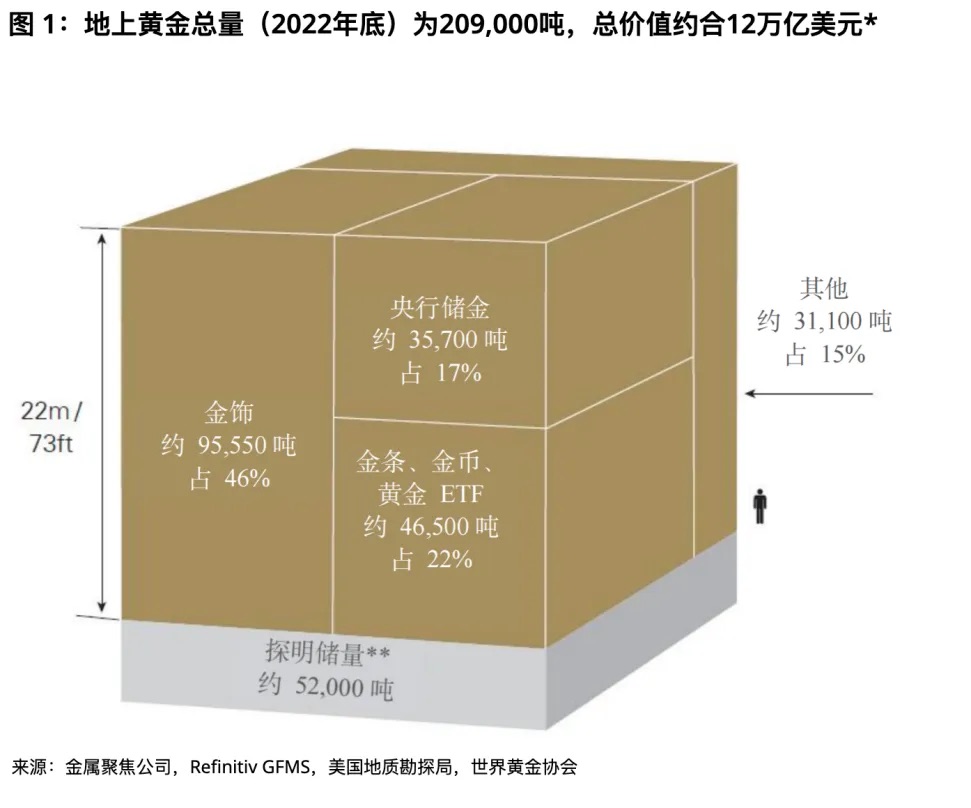
Total Market Value of Gold
According to the World Gold Council's estimate, approximately 209,000 tons of gold have been mined, valued at about $12 trillion, with about two-thirds mined after 1950. If all the existing gold were stacked together, the resulting pure gold cube would have a side length of up to 22 meters (or 73 feet).
Gold in the form of jewelry accounts for about 46% of the total amount (approximately 95,547 tons, valued at about $6 trillion).
Central banks hold 17% of the gold (approximately 35,715 tons, valued at about $2 trillion) as reserves.
Gold in the form of bars and coins accounts for about 21% of the total amount (approximately 43,044 tons, valued at about $3 trillion).
Gold ETF funds backed by physical gold account for about 2% of the total amount (approximately 3,473 tons, valued at about $0.2 trillion).
The remaining portion is used for various industrial purposes or held by other financial institutions, accounting for about 15% of the total amount (approximately 31,096 tons, valued at about $2 trillion).
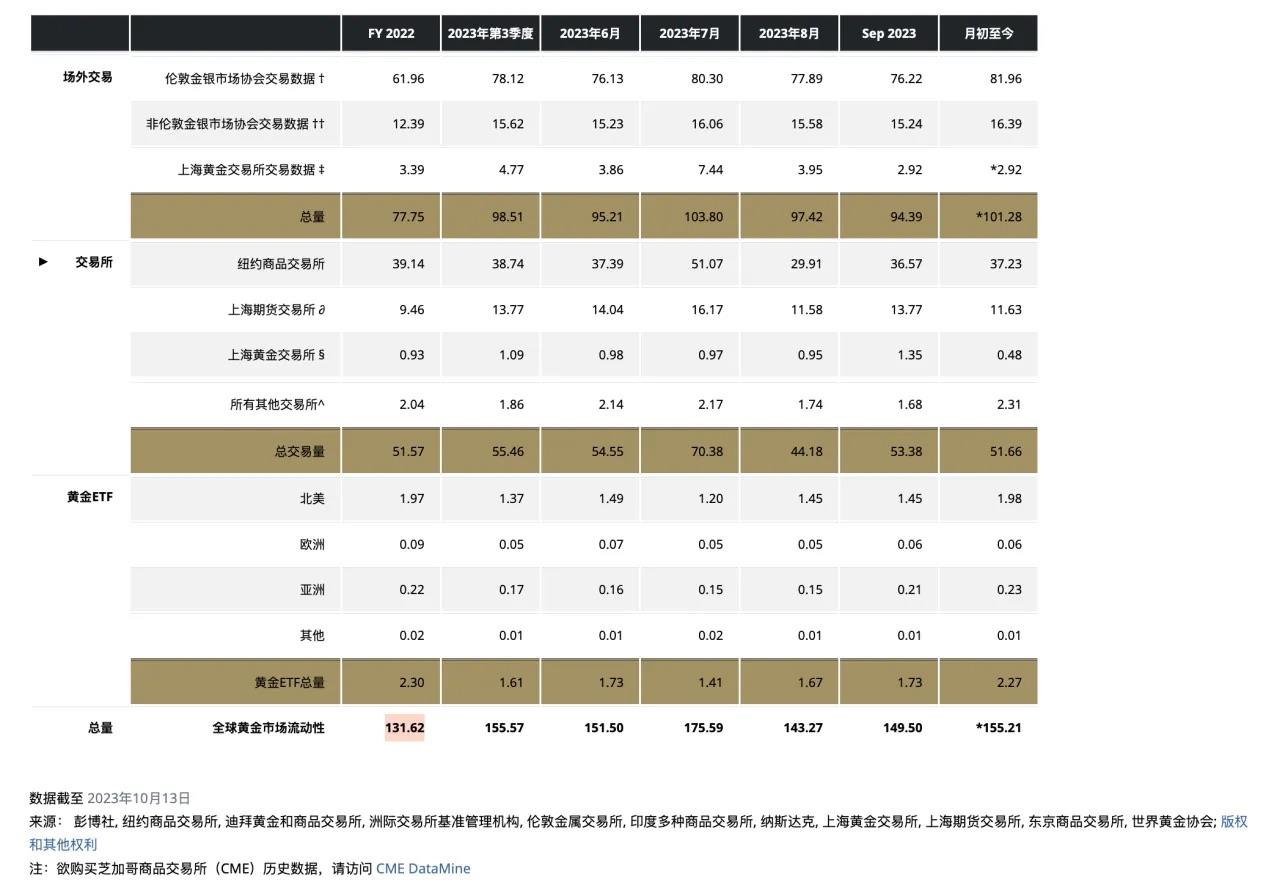
Gold Trading Volume
Gold is one of the most liquid assets in the world, with a daily average trading volume of $1.316 trillion in 2022. The main trading venues include the London OTC market, the U.S. futures market, and the Chinese market. The London OTC market, established in 1919, is a center for gold spot OTC trading. The London Bullion Market Association (LBMA) generates two daily gold reference prices (at 10:30 am and 3:00 pm London time) as benchmarks for market participants to trade. The gold market at the New York Mercantile Exchange (COMEX) is currently the world's largest gold futures market. The Shanghai Gold Exchange (SGE) officially opened on October 30, 2002, providing a spot trading platform for the Chinese gold market. The Shanghai Futures Exchange (SHFE) complements the spot trading of the Shanghai Gold Exchange with futures trading.
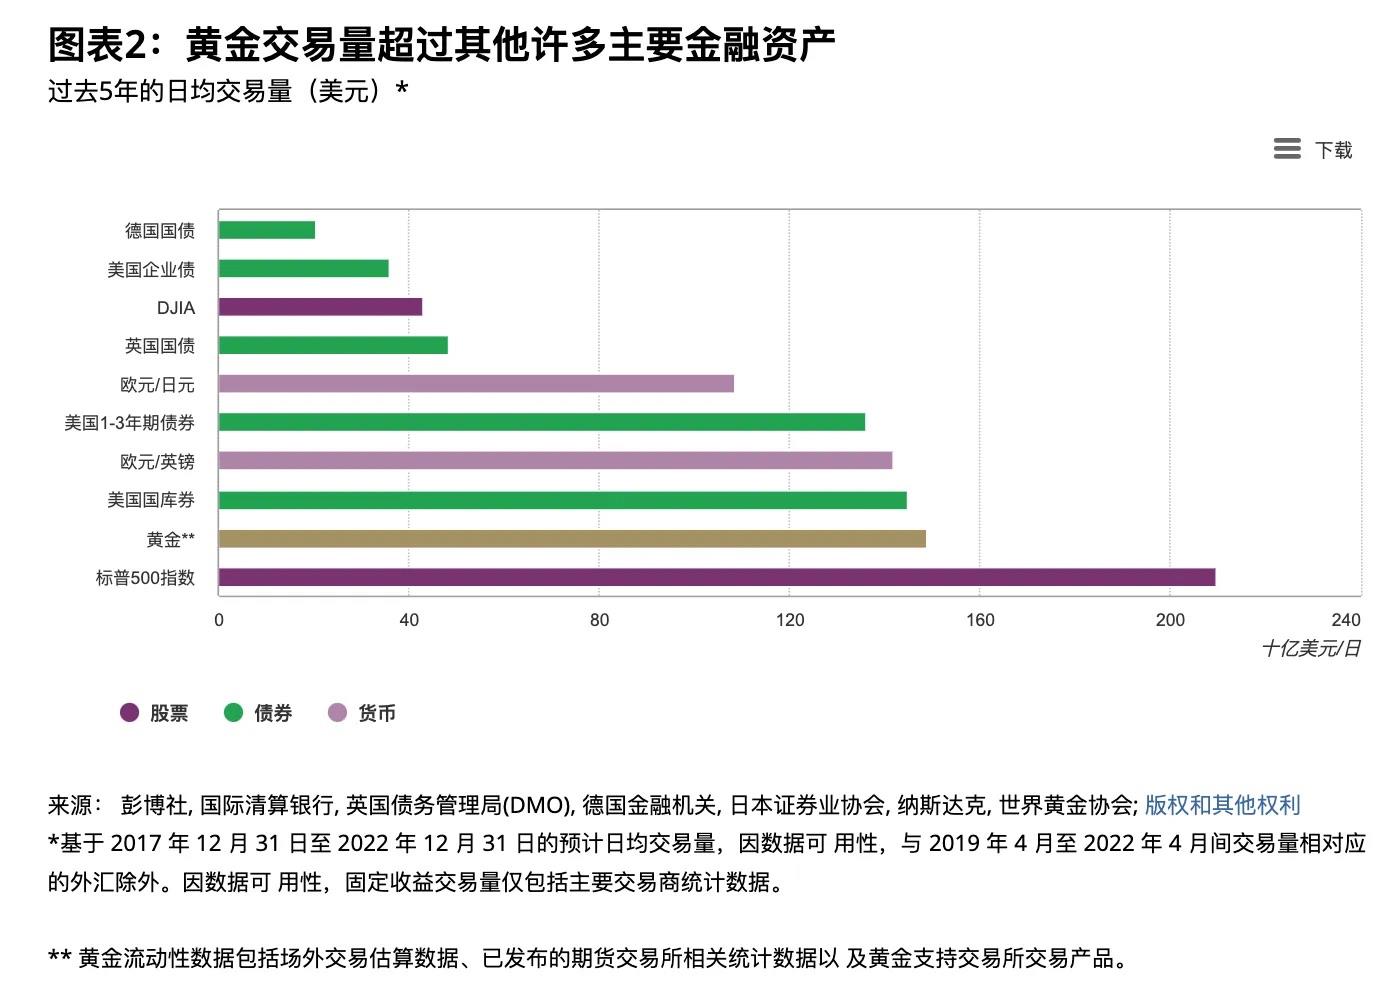
Daily Average Gold Trading Volume (in billion U.S. dollars)
2. BTC
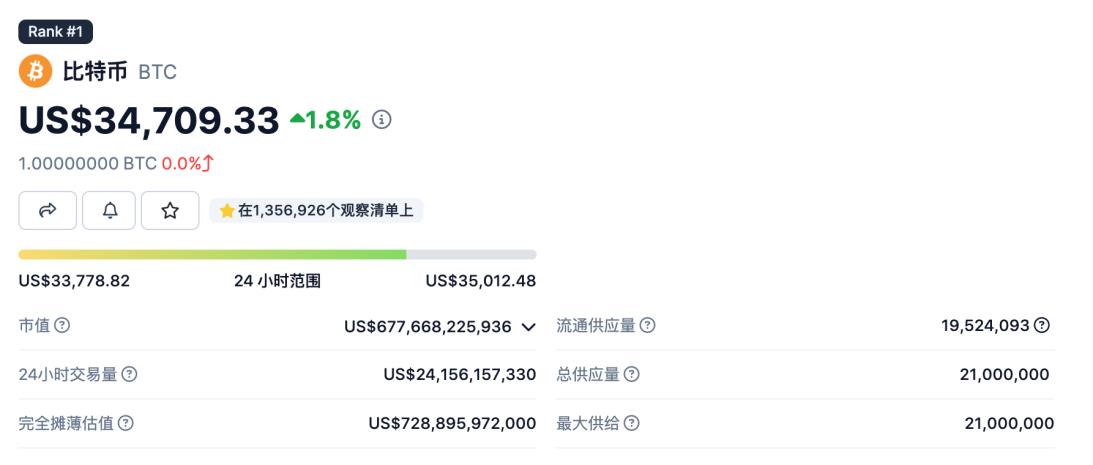
The 24-hour trading volume of BTC is approximately $240 billion, with the majority of trading volume occurring in perpetual contracts. The recent daily average trading volume of BTC has increased significantly, with a 24-hour trading volume of approximately 15% of gold (previously at less than 10% before this round of market trends). The largest trading venues for spot and perpetual contracts are both on Binance.
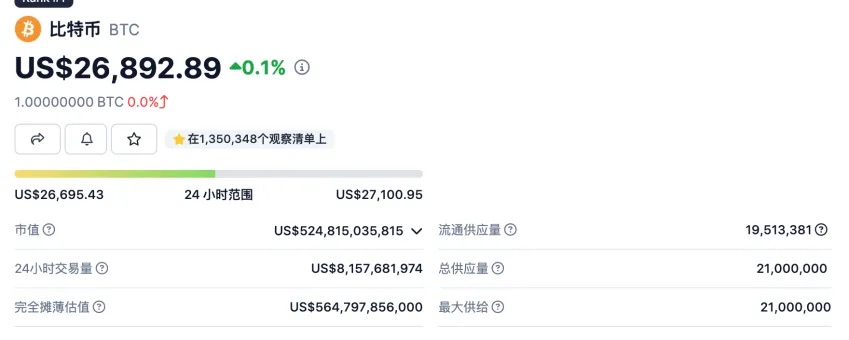
The current total market value of BTC is $677.7 billion, approximately 5.6% of the total market value of gold.
II. Factors Influencing the Prices of Gold and BTC
1. Supply and Demand for Gold
Gold Supply
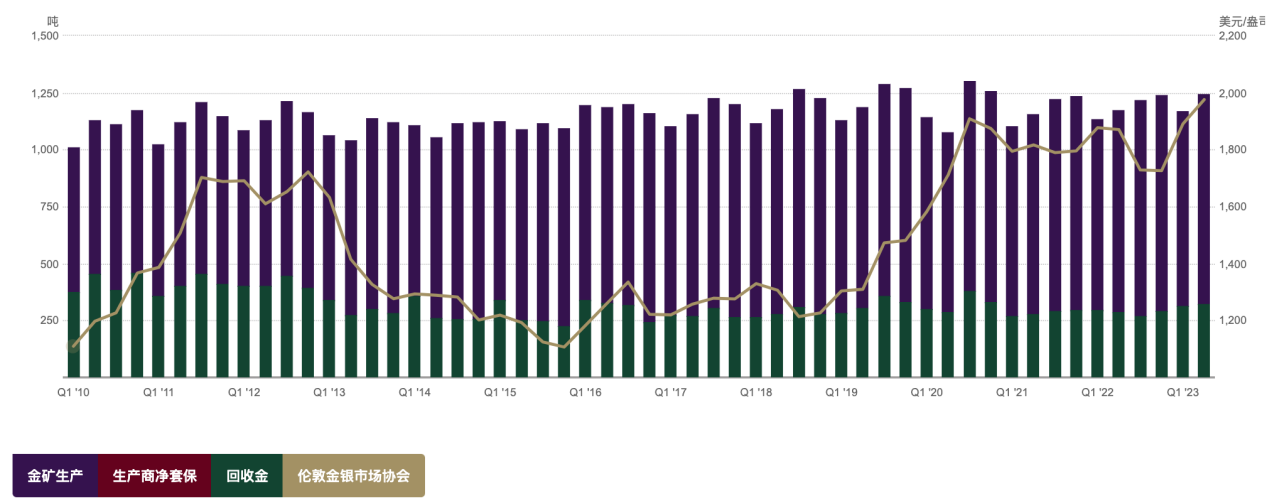
The annual increase in global gold supply has been relatively stable, at around 4,800 tons from 2016 to 2022. Since gold is not easily consumed, gold in the consumer sector still exists in some form and can re-enter the supply through recycling. Therefore, gold supply comes from two parts: mine production and gold recycling. In 2022, the total gold recycling volume was 1,140.6 tons, and the total mine production volume was 3,626.6 tons, with about three-quarters of the supply coming from gold mines and one-quarter from gold recycling. It can be observed from the following chart that gold supply has been stable over the years without significant trend fluctuations, so the relatively rigid supply of gold has a minimal impact on prices.
Gold Demand
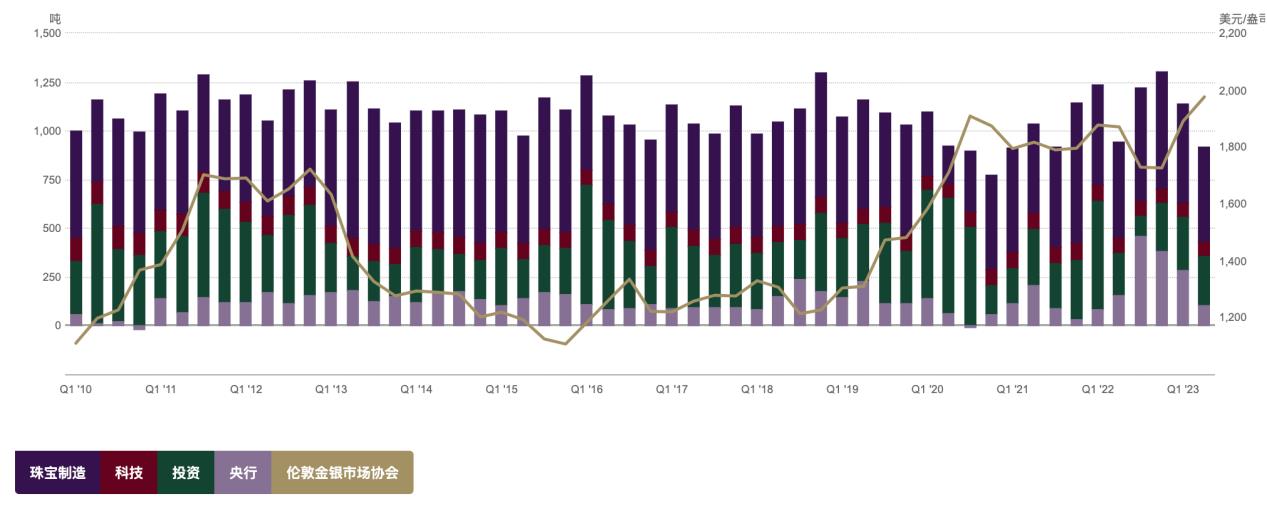
2022 global gold demand totaled 4712.5 tons. In the first half of 2023, global gold demand reached 2460 tons, a 5% year-on-year increase. Gold demand includes jewelry, medical technology, investment, and central bank reserves. In 2022, jewelry manufacturing, technology, investment, and central bank gold demand were 2195.4 tons, 308.7 tons, 1126.8 tons, and 1081.6 tons, respectively. Jewelry manufacturing accounted for the largest share at 47%, while central bank demand accounted for 23%. Influenced by traditional culture, China and India are the largest consumers of gold jewelry globally, accounting for 23% of global gold jewelry demand in 2022.
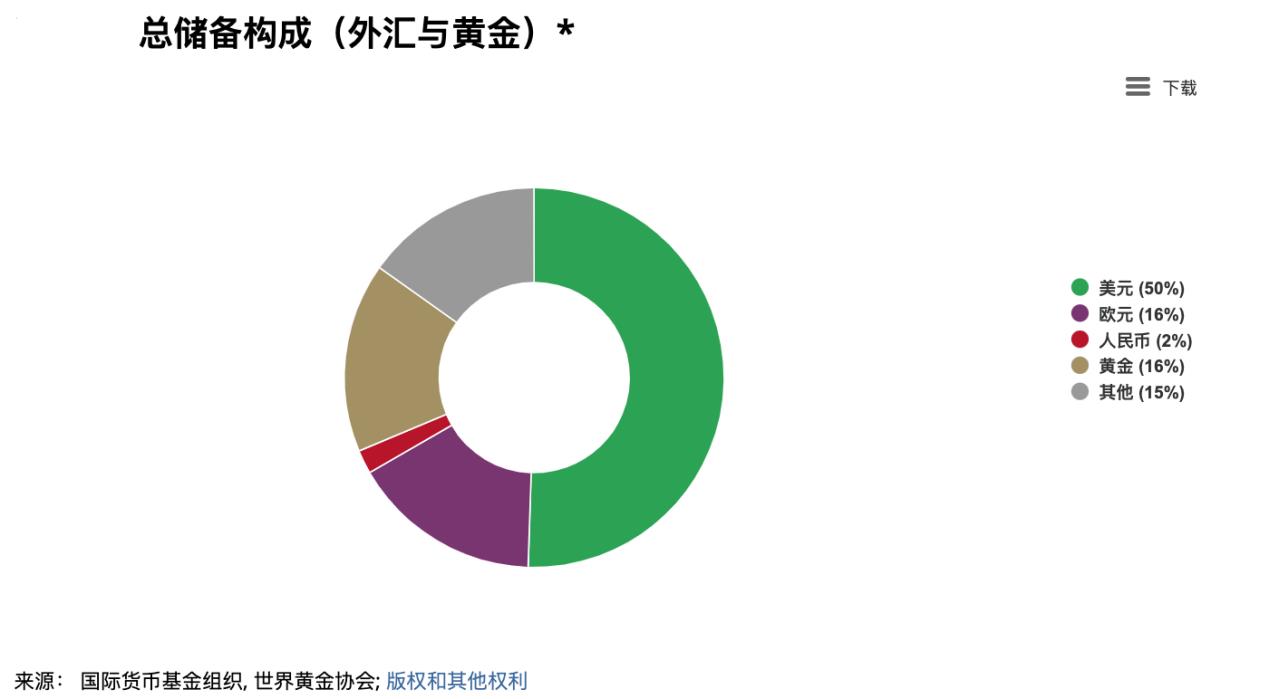
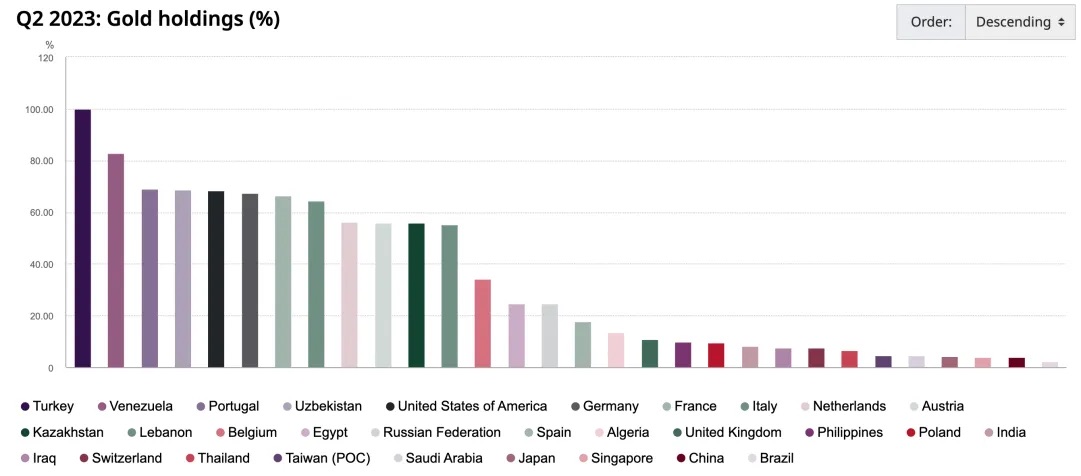
Gold is an important component of global central bank reserves. The proportion of gold in central bank reserves varies greatly by country or region. For example, the U.S. and Germany are close to 70%, while mainland China is only 3.8% and Japan is 4.2%. After the Russia-Ukraine conflict, the freezing of Russia's central bank dollar reserves by the U.S. and Europe led to a rise in demand for diversified foreign exchange reserves, leading to an increase in gold reserves. As the trend towards de-dollarization continues, the systemic trend of global central banks increasing their gold reserves will become more prominent in the long term.
Top 20 Countries/Organizations with Global Gold Reserves
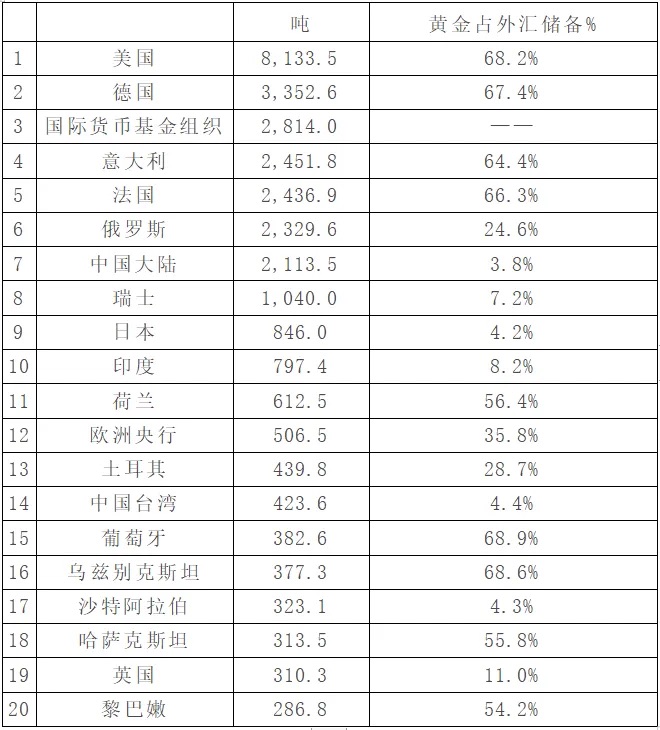
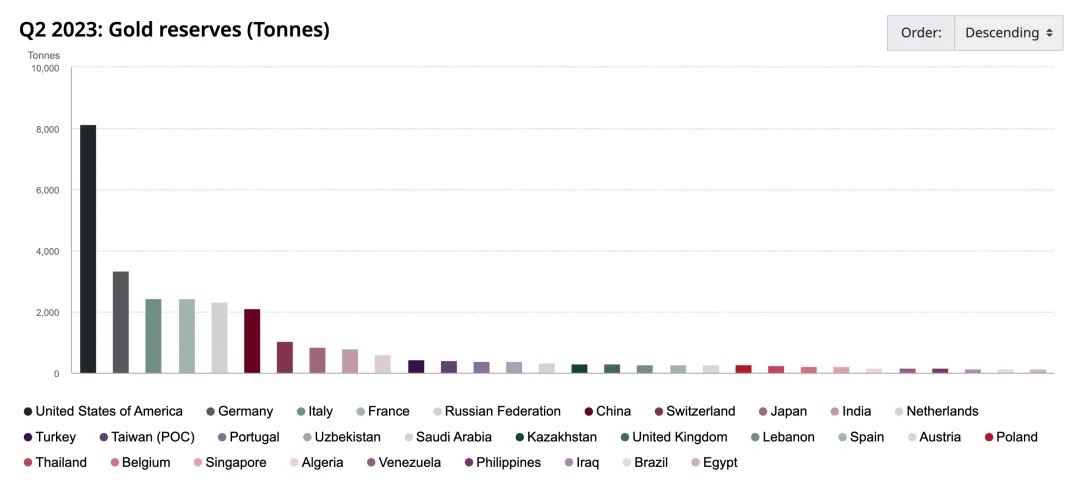
Source: World Gold Council
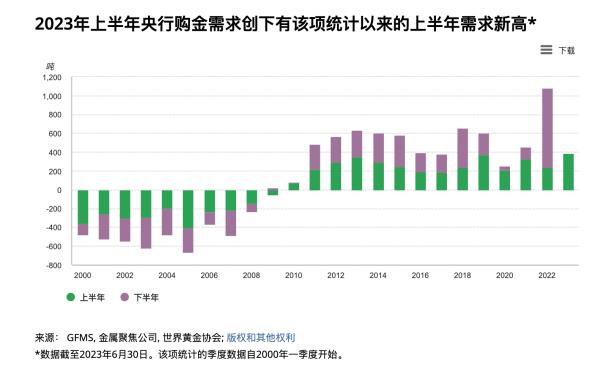
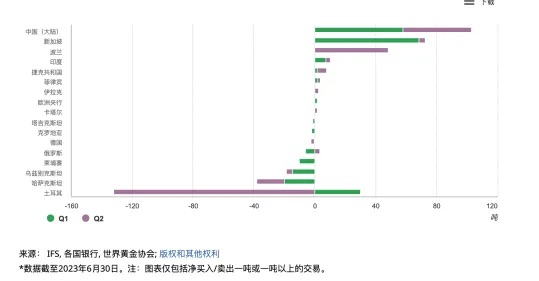
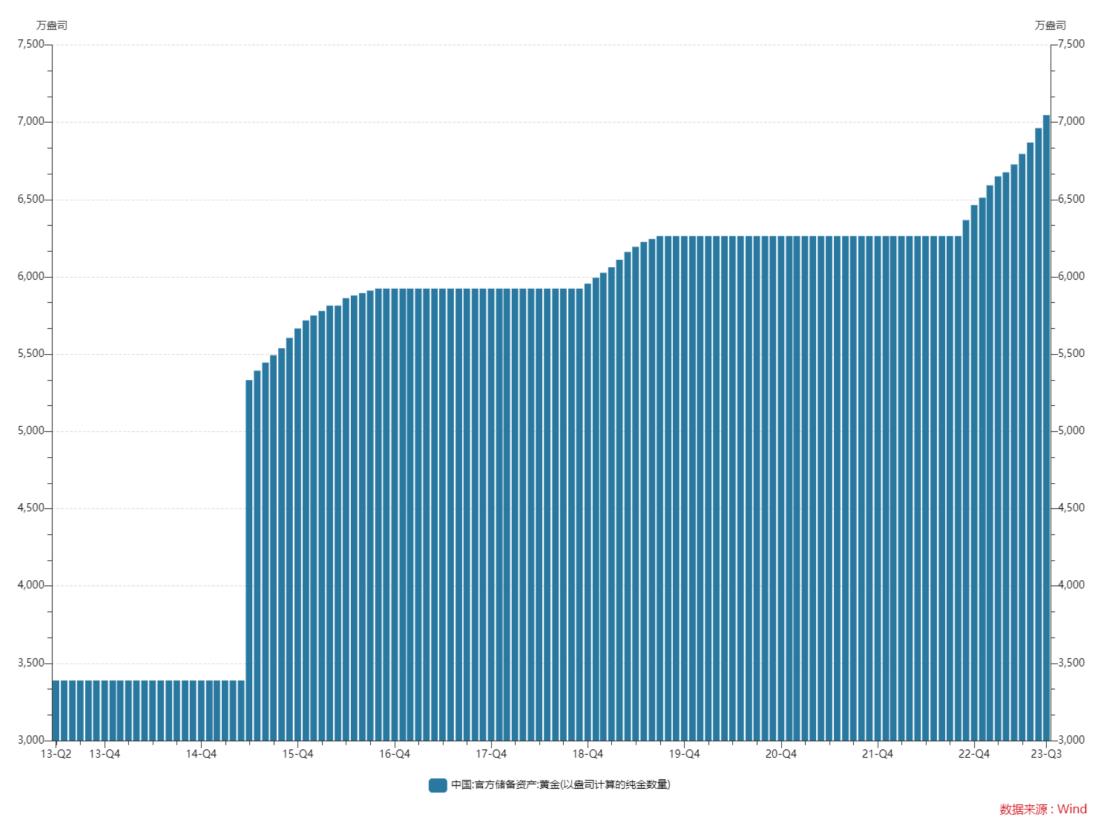
According to data from the World Gold Council, central bank gold purchases have sharply increased since the second half of 2022, totaling 840.6 tons, which is 1.8 times the total amount in 2021. In the first half of this year, central bank gold purchases were relatively stable compared to the second half of last year but still reached 387 tons, setting a new high since 2000. Turkey, due to temporary political instability, experienced strong domestic gold demand. The government temporarily banned the import of certain gold bars and sold gold in the domestic market, but this does not represent a long-term shift in Turkey's gold strategy. Overall, Turkey's gold sales in the second quarter did not weaken the overall positive trend in central bank gold demand. Mainland China had the largest gold purchases, buying 57.85 tons and 45.1 tons in the first and second quarters, respectively. As of October 13, at the end of September, China's gold reserves reported 70.46 million ounces, an increase of 840,000 ounces compared to the previous month, marking the 11th consecutive month of increase. Over the past 11 months, China's central bank has accumulated a total of 7.82 million ounces in gold reserves. Historically, China's central bank has shown a strategic feature of almost no gold sales.
BTC
The total supply of BTC is fixed at 21 million, with the current circulation at 19.51 million, accounting for approximately 90% of the total supply.
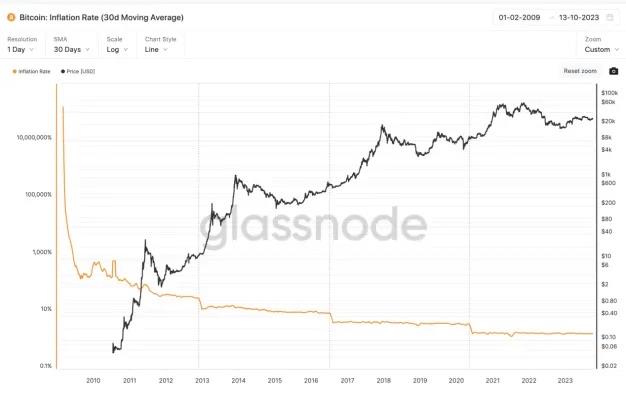
Currently, the inflation rate of BTC is approximately 1.75%, while the annual inflation rate of gold is around 2%, making them relatively close. Due to the halving mechanism of BTC, the future inflation rate of BTC will be significantly lower than that of gold. The most recent halving in 2020 reduced the number of bitcoins issued per block from 12.5 to 6.25. The next halving is expected to occur at the end of April 2024.
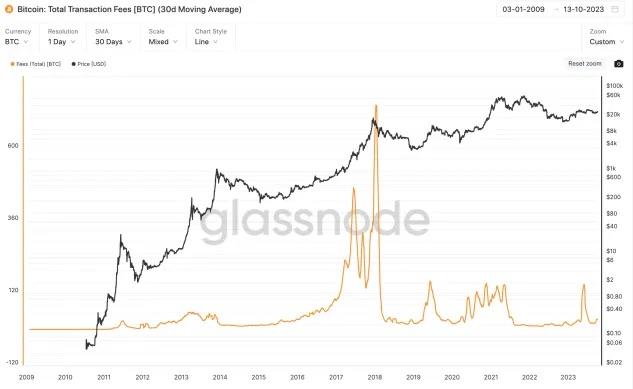
In terms of demand, it is divided into transaction fees and investment demand. For most of this year, BTC has consumed approximately 20-30 BTC in transaction fees per day, with an estimated annual transaction fee expenditure of approximately 10,000 BTC, accounting for about 0.5% of the total circulation. The remaining portion represents investment or speculative demand.
2. Macroeconomic Environment
From the breakdown of the Bretton Woods system to around 2000, inflation expectations and safe-haven demand were the main determinants of gold prices. In 2004, the gold market began to introduce ETFs, and with the introduction of gold ETFs and the expansion of gold-related trading markets, the financial attributes of gold were enhanced, and real interest rates and the U.S. dollar index became important factors influencing gold prices.
U.S. Dollar Index
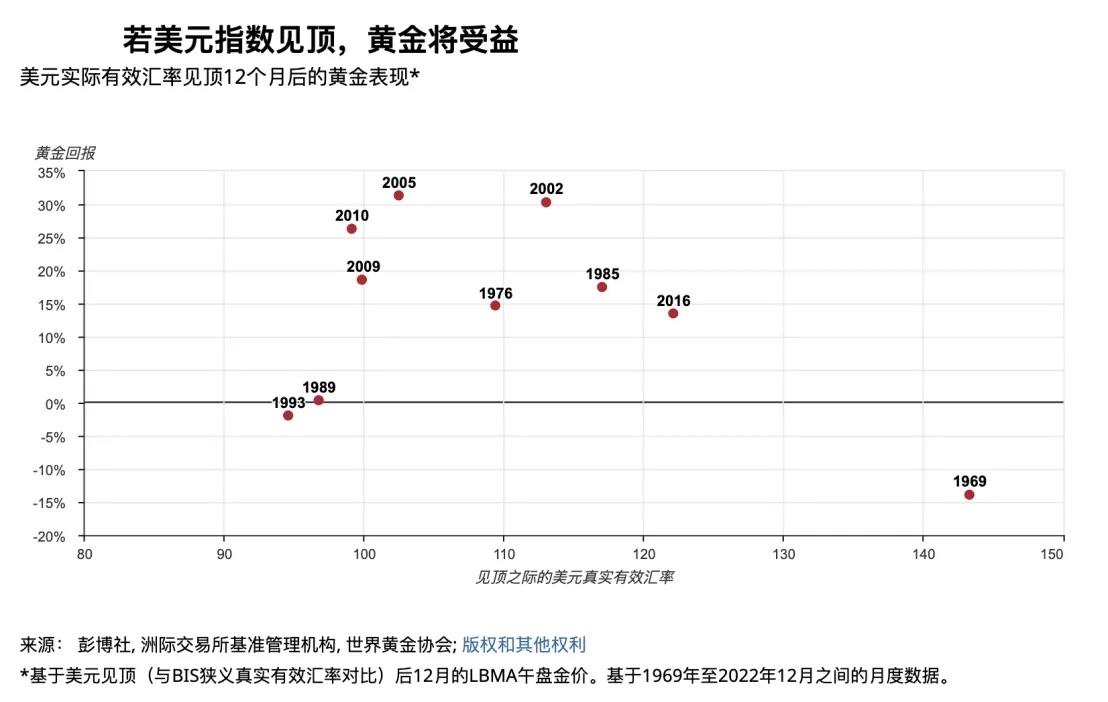
In theory, the price of gold is usually inversely related to the value of the U.S. dollar because gold is priced in dollars. An increase in the value of the dollar makes gold relatively more expensive, putting downward pressure on gold prices. From another perspective, from a long-term perspective, after the collapse of the Bretton Woods system, the U.S. dollar departed from the gold standard, and gold is essentially a hedge against credit currency (mainly the U.S. dollar). The stronger the U.S. dollar credit, the lower the value of gold allocation, and the weaker the U.S. dollar credit, the higher the value of gold allocation. Periods when gold and the U.S. dollar rise together usually accompany geopolitical or economic shocks such as oil crises, subprime crises, and debt crises, leading to significantly increased market caution and safe-haven sentiment.
Historically, after the U.S. dollar index peaked for 12 months, gold returns were positive 80% of the time (average return +14%, median return +16%).
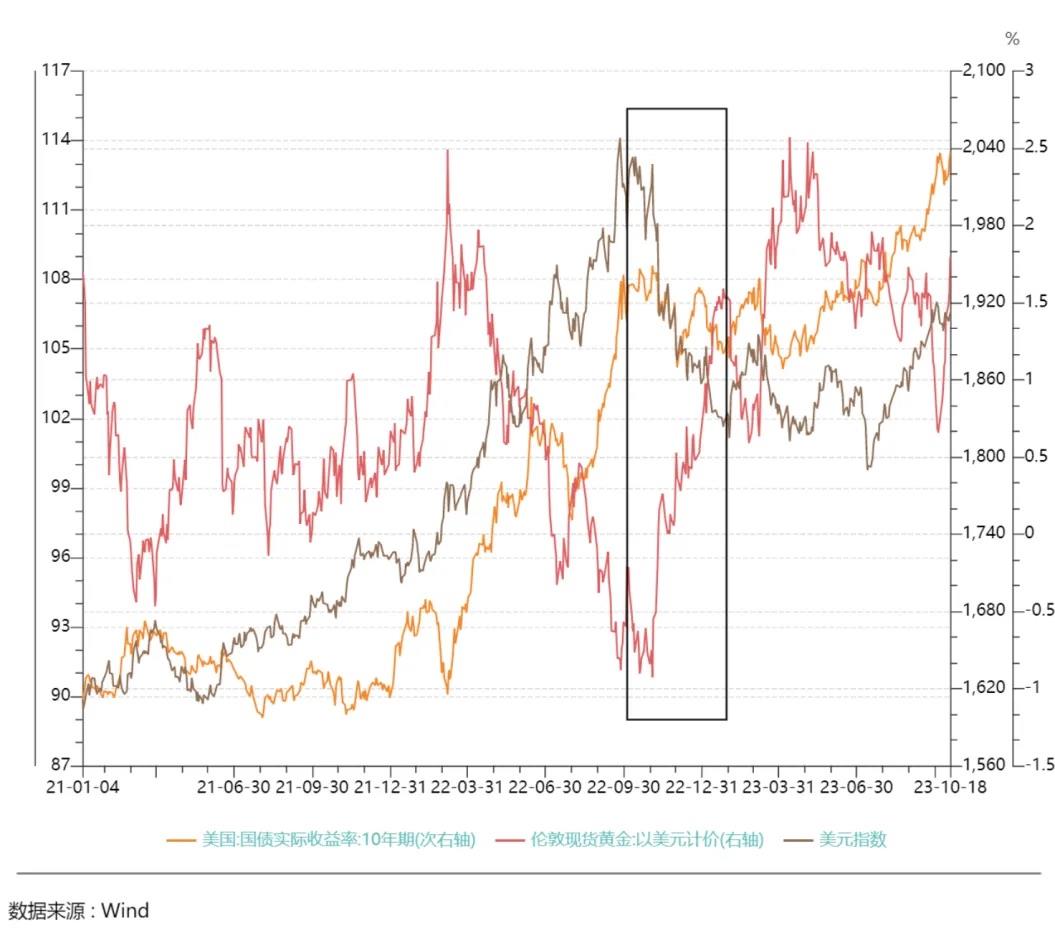
From the fourth quarter of 2022 to the beginning of 2023, the real yield of the U.S. 10-year Treasury remained volatile without significant fluctuations. However, the price of gold rose from a low point of about $1600 per ounce to $2000 per ounce, deviating from the constraint of long-term U.S. yields. From October 2022 to January 2023, due to expectations of economic recovery after the relaxation of the Chinese epidemic and the rebound of the European economy, growth momentum outside the United States was stronger, leading to a nearly 9% decline in the DXY. During this period, gold showed a significant correlation with the rise of the DXY.
U.S. Treasury Real Yields
Gold is a non-interest-bearing asset, while the U.S. dollar is an interest-bearing asset. The U.S. dollar yield and inflation expectations are two forces that drive changes in the price of gold. The real interest rate in the U.S. (nominal interest rate - inflation expectations) represents the opportunity cost of holding gold. In theory, the two are negatively correlated. From another perspective, the U.S. real interest rate represents the level of real return that can be achieved in the U.S. dollar system and is an indicator of the strength or weakness of the U.S. dollar credit.
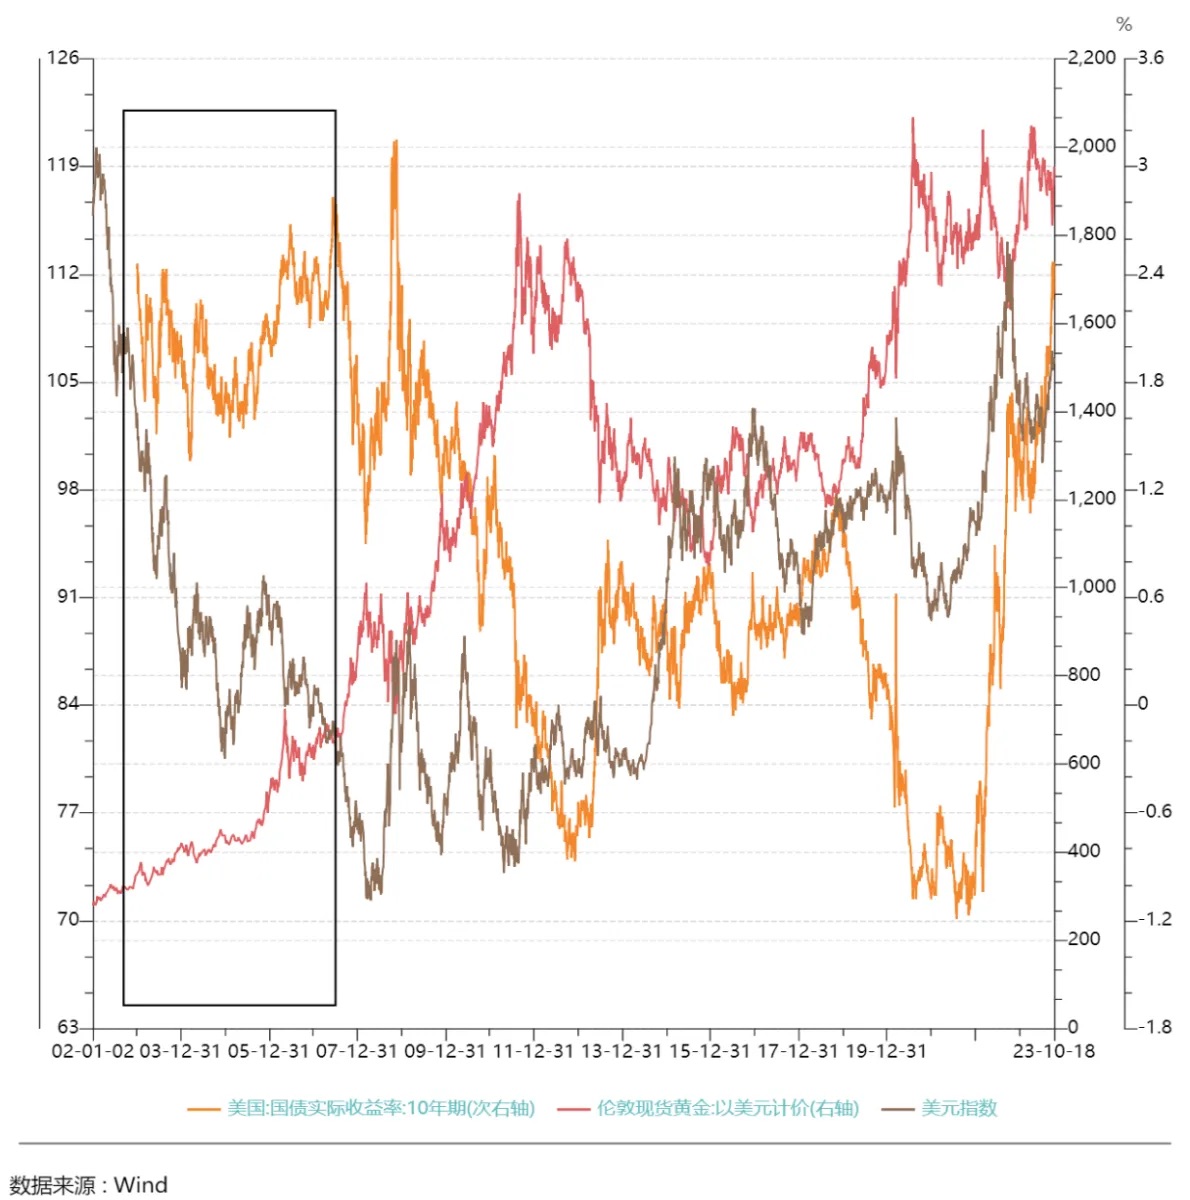
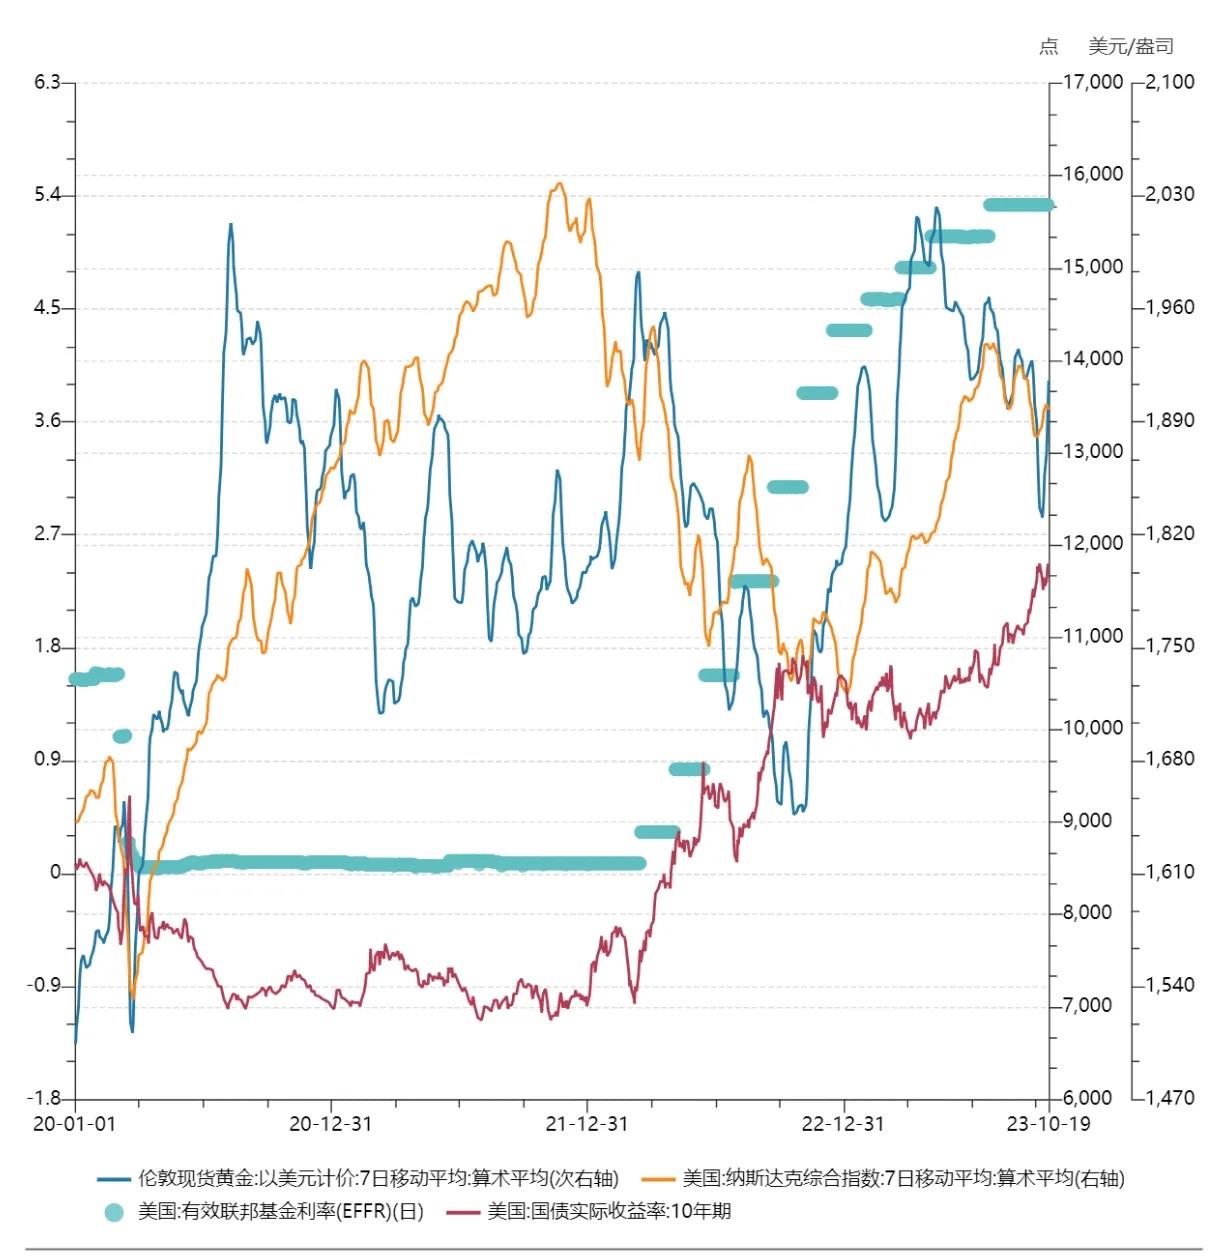
Both the U.S. dollar index and the real yield of U.S. Treasuries can be used to explain changes in the price of gold. The correlation between gold prices and the 10-year real yield of U.S. Treasuries has been significantly negative for most of the time since the 21st century, except for the period before 2005. The real yield of U.S. Treasuries has dominated the gold price for a longer period than the U.S. dollar index, and it can be considered the most important factor affecting the long-term price of gold.
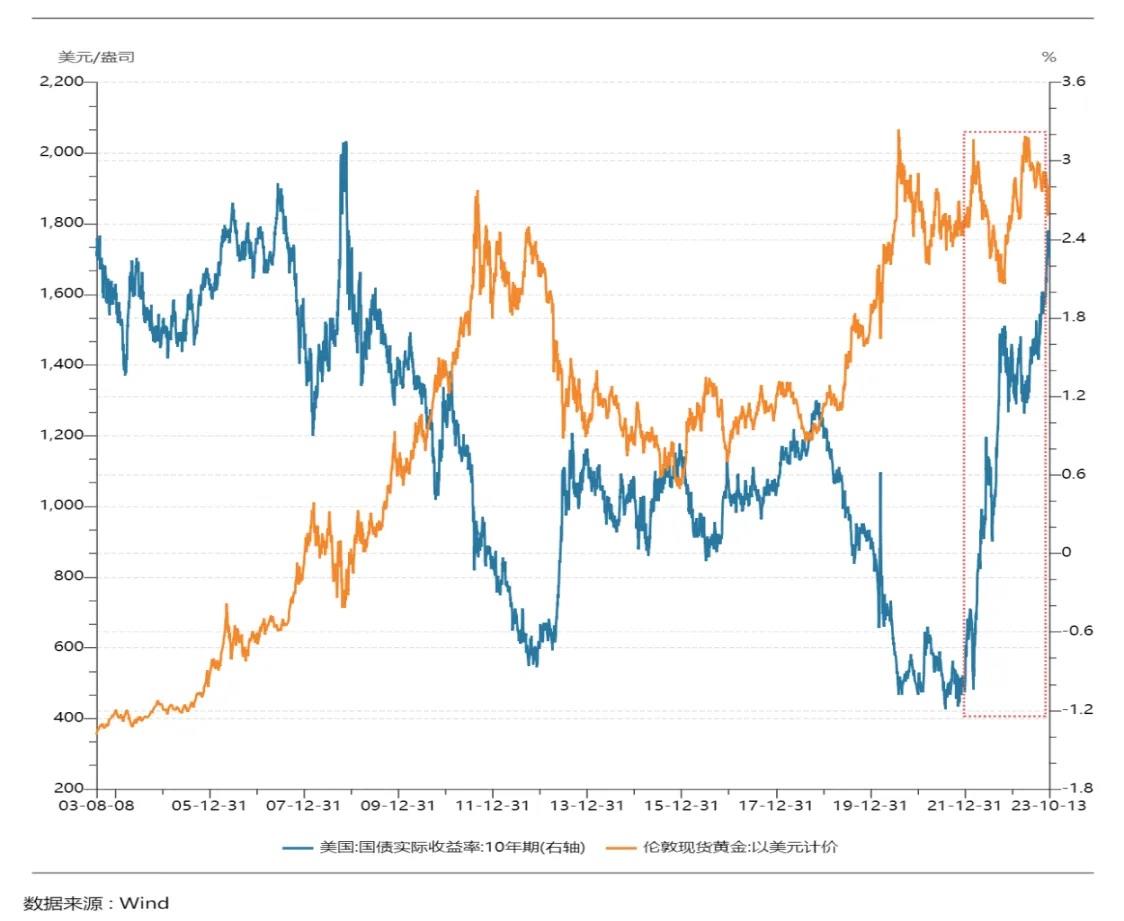
Since 2022, the sensitivity of gold prices to real interest rates has decreased. As the real yield of U.S. Treasuries rapidly increased, the decline in gold prices was lower than historical levels, demonstrating good resilience. Both the real yield and the U.S. dollar index cannot fully explain the price changes of gold during this period, which may be mainly related to the central bank's gold-buying spree that began in the second half of 2022. The World Gold Council released a report on October 9, stating that the annual global central bank gold reserves will continue to show strong growth. In August, global central bank gold reserves increased by 77 tons, a 38% increase from July. Structural changes may be occurring in the demand side of the gold market.
3. Geopolitics
The outbreak of geopolitical conflicts stimulates the demand for safe-haven assets and leads to a rapid short-term increase in gold prices. For example, after the Russia-Ukraine and Israel-Palestine conflicts in 2022, gold prices rose to around $2000 per ounce, a part that could not be explained by U.S. real yields and the U.S. dollar.
Asset Price Changes After the Russia-Ukraine Conflict
On February 24, 2022, Russian President Putin announced that the Russian military would carry out a military operation with the goal of "demilitarizing and de-Nazifying Ukraine." The Russian military did not plan to occupy Ukrainian territory and supported the self-determination of the Ukrainian people. Minutes after Putin's speech, Russian forces launched cruise and ballistic missiles at military bases and airports in Kyiv, Kharkiv, and Dnipro, destroying the Ukrainian National Guard headquarters. Subsequently, Russian forces launched attacks on the Ukrainian-controlled areas of Luhansk, Sumy, Kharkiv, Chernihiv, and Zaporizhzhia. In the southern Ukrainian cities of Mariupol and Odesa, Russian forces conducted large-scale amphibious landings.
Between February 25 and March 8, gold rose continuously by about 8%, while BTC did not show significant fluctuations in the three to four days after the war. On March 1, it surged by 15%, but quickly fell back to its pre-surge position. By March 8, when gold reached its peak, BTC was at $38,733, up 4% from the price before the conflict, and the Nasdaq index fell by about 1.5%.
From March 9 to the end of March, as the United States and other countries announced sanctions against Russia, the market expected the worst outcome of the events. Gold prices subsequently fell from their historical highs. BTC and the Nasdaq index began to rise together from March 14, while gold prices fluctuated in place. By the end of March, BTC had risen by 20%, while the increase in gold prices narrowed to 2% compared to February 24, and the Nasdaq rose by 6%.
At the same time, the Federal Reserve began a round of interest rate hikes in March 2022, and the impact of the Russia-Ukraine conflict on asset prices gradually weakened, shifting the trading logic to the pace of Fed rate hikes.
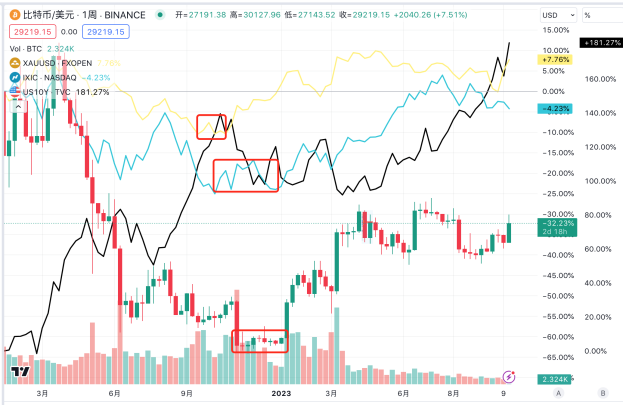
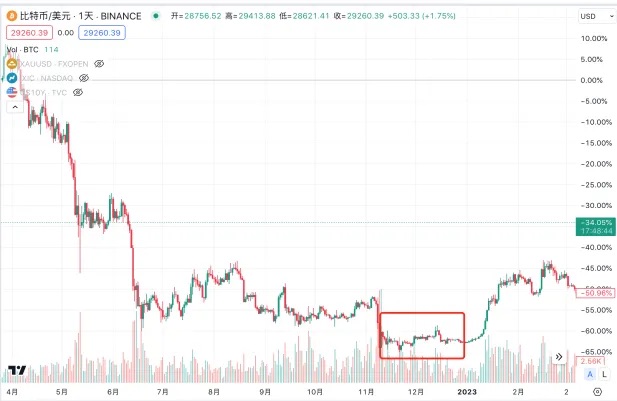
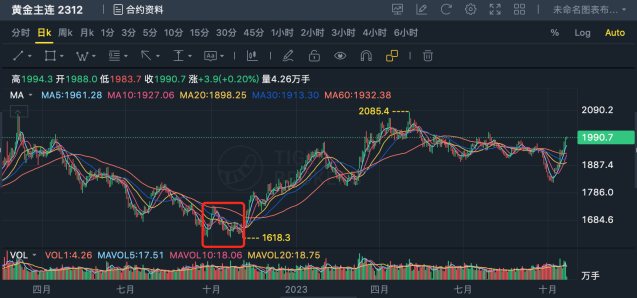
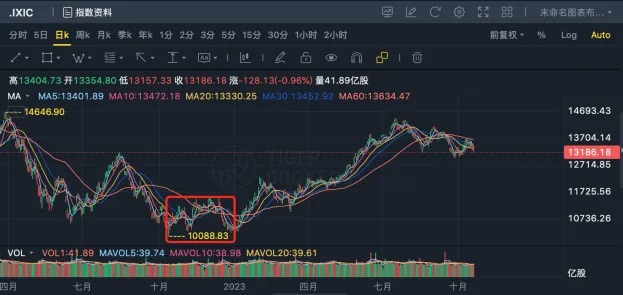
Starting in April, with the interest rate hikes, both BTC and the Nasdaq index entered a prolonged period of decline, and after a brief rise, gold prices also entered a long-term downward trend on April 19. The Nasdaq index hit a low of about 10,000 points in October 2022, with a cumulative decline of 28% since the interest rate hikes began; gold hit a low of $1615 in September and October, with a cumulative decline of 16% since the interest rate hikes began; BTC hit a low of about $16,000 in November, with a cumulative decline of 66% since the interest rate hikes began.
After hitting bottom, gold was the first to start a new round of gains, rising continuously from early November. The high point was reached on May 4 at $2072, an increase of 28% from the low point. BTC and the Nasdaq index started their trends two months later, and in 2023, they both began another synchronized upward trend. The high points for BTC and the Nasdaq index were reached in mid-July, with BTC reaching around $31,500, nearly doubling from the low point, and the Nasdaq reaching 14,446, an increase of 44% from the low point.
This wave of increases was mainly related to the temporary peak in U.S. bond yields in early November. Since early November, the decline in U.S. bond yields has driven a significant rebound in risk asset prices. The main triggering factors were the unexpected decline in CPI and core CPI data in October, as well as a further deepening of the 10Y-2Y U.S. bond yield spread, reflecting a significant downward revision of market expectations for the economy and inflation. The peak and subsequent decline in U.S. CPI and core CPI drove the peak and subsequent decline in the 10-year U.S. bond yield, and also led to a slowdown in the pace of Fed rate hikes. Subsequently, with the Nasdaq experiencing an artificial intelligence boom, both gold and BTC had their own independent narratives, further driving the upward trend in each market.
Overall, from the Russia-Ukraine conflict onwards, the degree of synchronization between BTC prices and gold is considered to indicate that BTC did not demonstrate strong safe-haven properties.
Asset Price Changes Since the Israel-Palestine Conflict
In the early morning of October 7, 2023, the Palestinian Islamic Resistance Movement (Hamas) launched Operation "Aqsa Flood," during which more than 5,000 rockets were launched into Israeli territory in a short period of time. Thousands of armed militants entered Israeli territory from the Gaza Strip and engaged in conflict with the Israeli military using three-dimensional tactics. Israel subsequently launched multiple rounds of airstrikes on the Gaza Strip, and Israeli Prime Minister Netanyahu declared a "state of war," stating that the Israeli military would use all its forces to destroy Hamas.
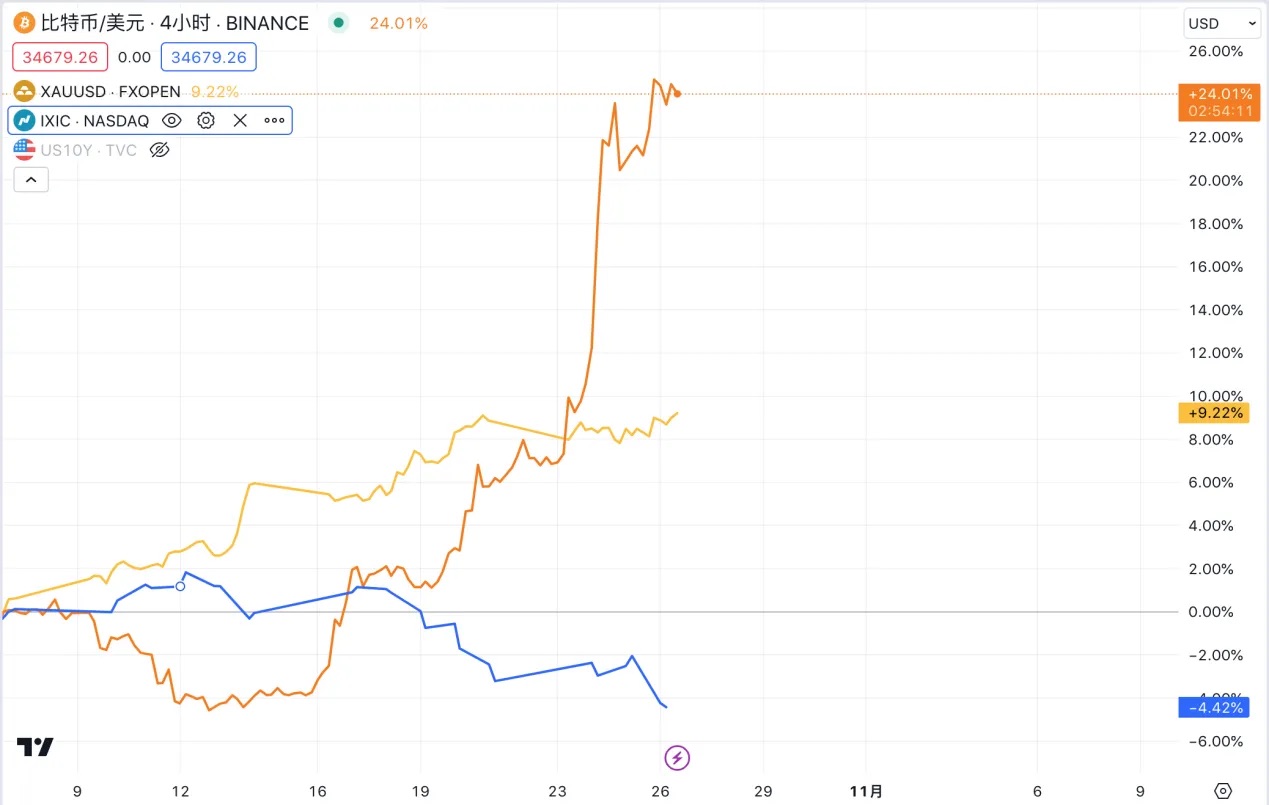
Gold has been the most noticeable asset to rise since the conflict, increasing from 1832 on October 9 to nearly $2000 on October 26, an increase of about 8%, coincidentally consistent with the increase during the Russia-Ukraine conflict. From October 7 to 13, BTC fell from 28,000 to 26,770, a 4.4% decline, and began to rebound on the 13th. On the 16th, it experienced a significant increase and then a pullback after the unexpected approval of the Balye ETF application, closing with half of the increase at 28,546. After the ETF approval expectation continued to ferment, it rose to $34,183 by the 25th. The Nasdaq rose slightly from October 9 to 11, then began to decline from 13,672 to 12,956 on October 20.
The trends of BTC and the Nasdaq during this period were almost completely opposite, showing independent market trends. The opposite price performance of BTC compared to gold in the week following the war suggests that BTC still does not demonstrate safe-haven properties. The subsequent rebound was due to the SEC not appealing the Grayscale Bitcoin Trust case, which reignited market confidence in the approval and continued to ferment.
III. Is BTC a Safe-Haven Asset?
BTC has a high degree of similarity with gold in terms of supply and demand, inflation, and other aspects. From a model design and logical perspective, BTC should have safe-haven properties. As Arthur Hayes explained in "For the War," war can lead to severe inflation, and the common method for ordinary citizens to protect their assets is to choose gold as a hard currency. However, in the event of a large-scale war breaking out domestically, the government may prohibit private ownership of precious metals, restrict precious metal trading, and even force gold owners to sell their gold bars to the government at low prices. Holding a strong currency may also be subject to strict capital controls. Only the value and transmission network of Bitcoin do not depend on government-licensed banking institutions, and it does not have a physical presence, allowing ordinary people to carry it anywhere without regulation. In a real war scenario, BTC is actually a better asset than gold and strong currencies.
However, based on the actual price performance of assets to date, BTC has not demonstrated clear safe-haven properties.
Supplementing the asset price changes before the Russia-Ukraine conflict can provide a better understanding of the changes in various assets over a complete cycle. The outbreak of the COVID-19 pandemic in early 2020 led to a rapid decline in inflation expectations, prompting the Federal Reserve to cut interest rates significantly to 0–0.25% and initiate unlimited QE in late March 2020. Asset prices collectively rose, with gold experiencing the most rapid increase, reaching a historic high of $2075 per ounce in London in August 2020, and then began to decline. From 6631 on March 30, 2020, to 16,212 on November 21, 2021, the Nasdaq rose by 144%. During the same period, BTC rose from $6850 to $58,716, an increase of 757%.
Since 2020, with the entry of traditional funds, BTC prices have increasingly shown characteristics of a major asset class. During this period, the fluctuations in BTC prices have been more in line with the Nasdaq's trend, while the difference in gold price performance is seen as reflecting its safe-haven function during the special period of the pandemic. The spread of COVID-19 panic and concerns about severe economic deterioration were driving factors for the rise in gold prices, in addition to the multiple barriers to the transportation of gold, which prompted a rapid increase in gold prices.
It can be observed that, whether from the long-term cycle of the current U.S. tide or the short-term conflicts of geopolitics, BTC has not demonstrated clear safe-haven properties, but has shown a higher correlation with the Nasdaq index. It should be noted that the so-called safe-haven asset gold has shown very strong financial attributes in the long term, and has been influenced by interest rates and has maintained a price trend in the same direction as the Nasdaq over a longer period.
IV. Future Trends Outlook
In October, several Fed officials made dovish remarks. For example, Dallas Fed President Logan, who was previously more hawkish, stated that the rise in U.S. bond yields might reduce the need for rate hikes. Vice Chairman Jefferson stated that recent increases in bond yields leading to financial tightening would be considered when determining future monetary policy. On Thursday, October 19, Fed Chairman Powell, in a speech at the New York Economic Club, hinted that as long as recent efforts to lower inflation continue to make progress, the rise in long-term U.S. bond yields might prompt the central bank to continue pausing rate hikes at the next meeting. However, the Fed will continue to work towards sustainably lowering inflation to 2%, and does not rule out the possibility of future rate hikes. After Powell's speech, the implied probability of no rate hike in November in the CME rate futures has risen to 99.9%. However, the 10-year U.S. bond yield surged again last week, briefly breaking through 5.0% during trading. In the short term, the expectation of rate hikes is no longer the focal point of the game for U.S. bond yield traders. The rise in rates on the day of the speech may be due to the interpretation of Powell's cautious remarks as hawkish, as well as concerns about the possibility of continued fiscal expansion and increased debt issuance in the United States. Overall, based on current economic data, the level of 5% for the 10-year U.S. bond yield is considered by the Fed to be the top position. In the short term, U.S. bond yields will continue to run at high levels. According to the dot plot and market forecasts, the Fed will likely begin rate cuts next year, and the shift in the main axis of Fed monetary policy will change the underlying logic of global asset allocation in 2024. Overall, the window for allocating gold and BTC is approaching, and it is more a matter of timing.
1. Gold
The real yield of U.S. Treasuries remains the main driving factor for the price of gold. After the cycle reversal next year, the negative correlation between gold and the 10-year real yield of U.S. Treasuries will be revitalized, and the real yield of U.S. Treasuries will once again become the main and sustained price-driving factor for gold. Secondly, the trend of a multipolar international monetary system, the push for "de-globalization," and the rise of non-U.S. currencies will have a long-term impact on U.S. dollar credit, supporting the continued gold-buying actions of central banks. Therefore, in the long term, gold is expected to enter an upward cycle under the dual influence of cycle reversal and structural change forces, breaking through its previous historical high.
In the short term, gold prices will continue to fluctuate, and geopolitics will remain the main influencing factor. The price trend will depend on whether the Israel-Palestine conflict expands to other areas in the Middle East. If the conflict is limited to both sides of Israel and Palestine, the long-term trend of gold will likely come to a halt, making it difficult to break through the psychological resistance level of $2000 per ounce. If the Israel-Palestine conflict spreads to surrounding areas such as Iran, Saudi Arabia, and other oil-producing countries, and in extreme cases leads to an oil embargo or a sudden drop in production, it may have a significant impact on the oil supply chain, prompting further increases in the prices of oil and gold. Additionally, the rise in energy prices and its transmission to other commodity prices may lead to a rebound in the CPI growth rate, creating more variables in the macro environment. Based on the current situation, the probability of the first scenario may be higher.
2. BTC
Similarly, with the start of the next cycle by the Fed in 2024, overall market liquidity will improve, and global investors' risk appetite will increase. Coupled with its unique market logic and the impact of ETFs and halving market trends, Bitcoin will experience another bull market and is expected to break through its previous high. In the short term, the driving factor will continue to be the approval of the BTC ETF spot by the SEC, and the price of BTC has recently surged to over $34,000. We will explore in-depth the specific impact of the spot ETF on the price of BTC and the price prediction after its approval in future research reports, so stay tuned.
免责声明:本文章仅代表作者个人观点,不代表本平台的立场和观点。本文章仅供信息分享,不构成对任何人的任何投资建议。用户与作者之间的任何争议,与本平台无关。如网页中刊载的文章或图片涉及侵权,请提供相关的权利证明和身份证明发送邮件到support@aicoin.com,本平台相关工作人员将会进行核查。


