BTC和ETH跌幅创最近七年Q1最差回报率,但ETF持有者平均浮盈17%
宏观解读:随着特朗普政府即将实施的"对等关税"政策进入倒计时,全球金融市场充满不确定性。芝加哥PMI超预期数据与季底再平衡交易形成多空对决,标普500最终收涨0.55%的表演,看似优雅实则惊险。这场政策迷雾不仅笼罩着传统市场,加密世界的投资者同样在屏息等待靴子落地。比特币在美股交易时段短暂触及8.4万美元高位后回落82265美元附近,日内再度反弹至8.44美元附近,完美演绎着风险资产与避险资产的双重人格。
从宏观层面观察,市场正经历着冰火两重天的考验。一方面,交易所比特币储备量降至7.53%的六年新低,揭示出长期持有者用脚投票的坚定信念。另一方面,现货比特币ETF持有者平均17%的浮盈水平,犹如悬在市场上的达摩克利斯之剑——既可能是价值共识的基石,也可能成为获利了结的隐患。这种矛盾态势在Coinbase股价31%的季度暴跌中展现得淋漓尽致,这家加密交易所巨头的表现甚至比FTX崩盘时期还要惨淡,堪称熊市先行指标。
技术派分析从历史轮回中寻找答案。Dragonfly资本指出,当前弥漫的悲观情绪与2018/2019年周期高度共振,这种似曾相识的既视感让人想起加密市场的"七年之痒"。富达数字资产的研究报告则为市场注入强心剂,其提出的"加速阶段"理论暗示,比特币可能正在复制2020年末突破2万美元前的蓄力曲线。这种技术面与基本面的博弈,恰如西西弗斯推石上山的过程,既充满绝望又饱含希望。
加密世界从未停止创造戏剧性情节。Arthur Hayes关于"比特币年底25万美元"的豪言壮语,与第一季度BTC跌幅-11.82%、ETH跌幅-45.41%的最近七年最差回报率形成魔幻对比。这位BitMEX联合创始人的预测模型建立在对美联储政策转向的精准预判上,他坚信法币流动性洪流终将托起加密方舟。这种乐观主义在16.3亿美元季度黑客损失面前显得尤为悲壮——2025年Q1安全漏洞造成的损失同比激增131%,加密货币的"原罪"与"救赎"在此刻完成同框。
市场参与者正在多重博弈中寻找平衡点。3月份美国比特币ETF净流出7.45亿美元的冰冷数据,与BlackRock旗下IBIT逆势吸金2.61亿美元形成鲜明对照,这场机构间矛盾揭示出资本对同一资产的分歧认知。值得玩味的是,当传统金融大鳄开始表演"多空双杀"时,链上数据却显示矿工和长期持有者正悄然筑底,这种明修栈道暗度陈仓的戏码,或许正是加密市场最迷人的叙事逻辑。
加密市场正经历着涅槃前的阵痛。特朗普关税政策带来的宏观扰动、机构投资者的战略分歧、安全漏洞的持续威胁、以及技术周期的自我验证,这些变量交织成的复杂方程式,正在重塑数字资产的估值逻辑。对于精明的投资者而言,当前市场的波动率或许正是布局阿尔法收益的黄金窗口。毕竟在加密世界,"当别人恐惧时贪婪"的箴言,往往在至暗时刻绽放光芒。在法币体系日渐式微与数字文明加速崛起的宏大叙事下,比特币或将在风暴中完成新一轮的价值锚定,这场关乎金融未来的博弈,注定比任何科幻剧本都更加跌宕起伏。
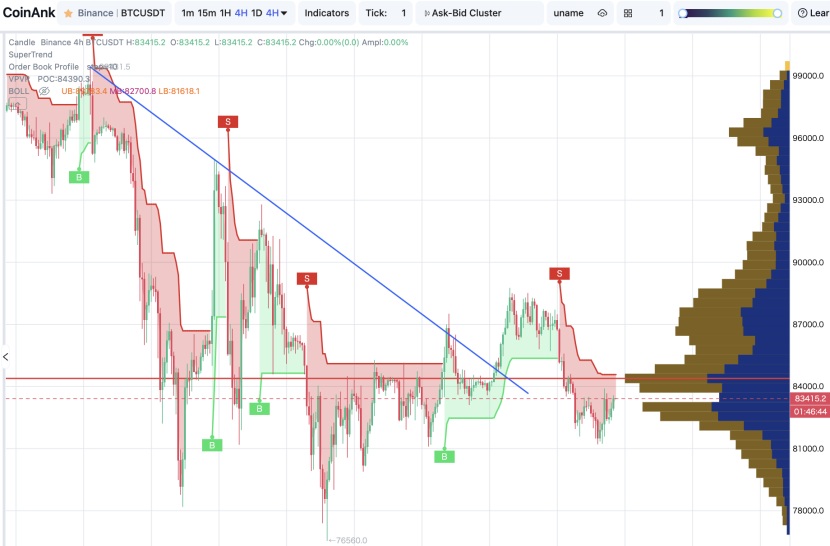
根据CoinAnk AI智能分析,BTC 4H行情分析报告如下:
主要支撑位:81811.54 USDT
主要压力位:84457.33 USDT
当前趋势:震荡偏多
详细解释:
技术指标综合:
均线系统: MA5=82940.90,MA10=82598.89,MA20=82700.79,MA120=84331.23。当前价格位于MA5和MA10之上,但低于MA120,显示出短期多头排列,但长期趋势尚未完全确认。
MACD: DIF=-501.00,DEA=-738.53,柱=237.53。MACD柱在零轴上方且持续扩大,显示出多头动能增强。
BOLL: 上轨=83783.43,中轨=82700.78,下轨=81618.13。当前价格接近上轨,显示出一定的上涨压力,但尚未突破。
RSI: RSI6=62.71,RSI12=51.34,RSI14=49.67,RSI24=47.05。RSI6接近超买区域,但其他周期RSI仍处于中性区域,显示出短期内可能有一定的回调压力。
KDJ: K=69.34,D=58.16,J=91.70。KDJ指标显示金叉,且J值较高,显示出短期内的多头动能较强。
指标数据:
资金费率: 0.00320100%。资金费率处于中性区域,多空情绪不明显。
成交量变化: 近期成交量有所放大,尤其是在价格上涨时,显示出多头动能的增强。
资金流数据: 24小时合约资金净流入780551972.54 USDT,显示出多头资金流入较多,但现货资金净流入33074711.88 USDT,显示出现货市场资金流入相对较少。
分析结果
方向: 谨慎做多
入场时机: 当前价格接近BOLL上轨,建议等待价格回调至支撑位入场。
止损设定: 止损约3.8%的止损比例。
目标价位: 目标价位设在87000 USDT。
提示:本次分析仅供参考,不构成任何投资建议!
免责声明:本文章仅代表作者个人观点,不代表本平台的立场和观点。本文章仅供信息分享,不构成对任何人的任何投资建议。用户与作者之间的任何争议,与本平台无关。如网页中刊载的文章或图片涉及侵权,请提供相关的权利证明和身份证明发送邮件到support@aicoin.com,本平台相关工作人员将会进行核查。