Ethereum (ETH) to $12,000? Head and Shoulders Pattern Target

CN
U.today
關注
23 小時前

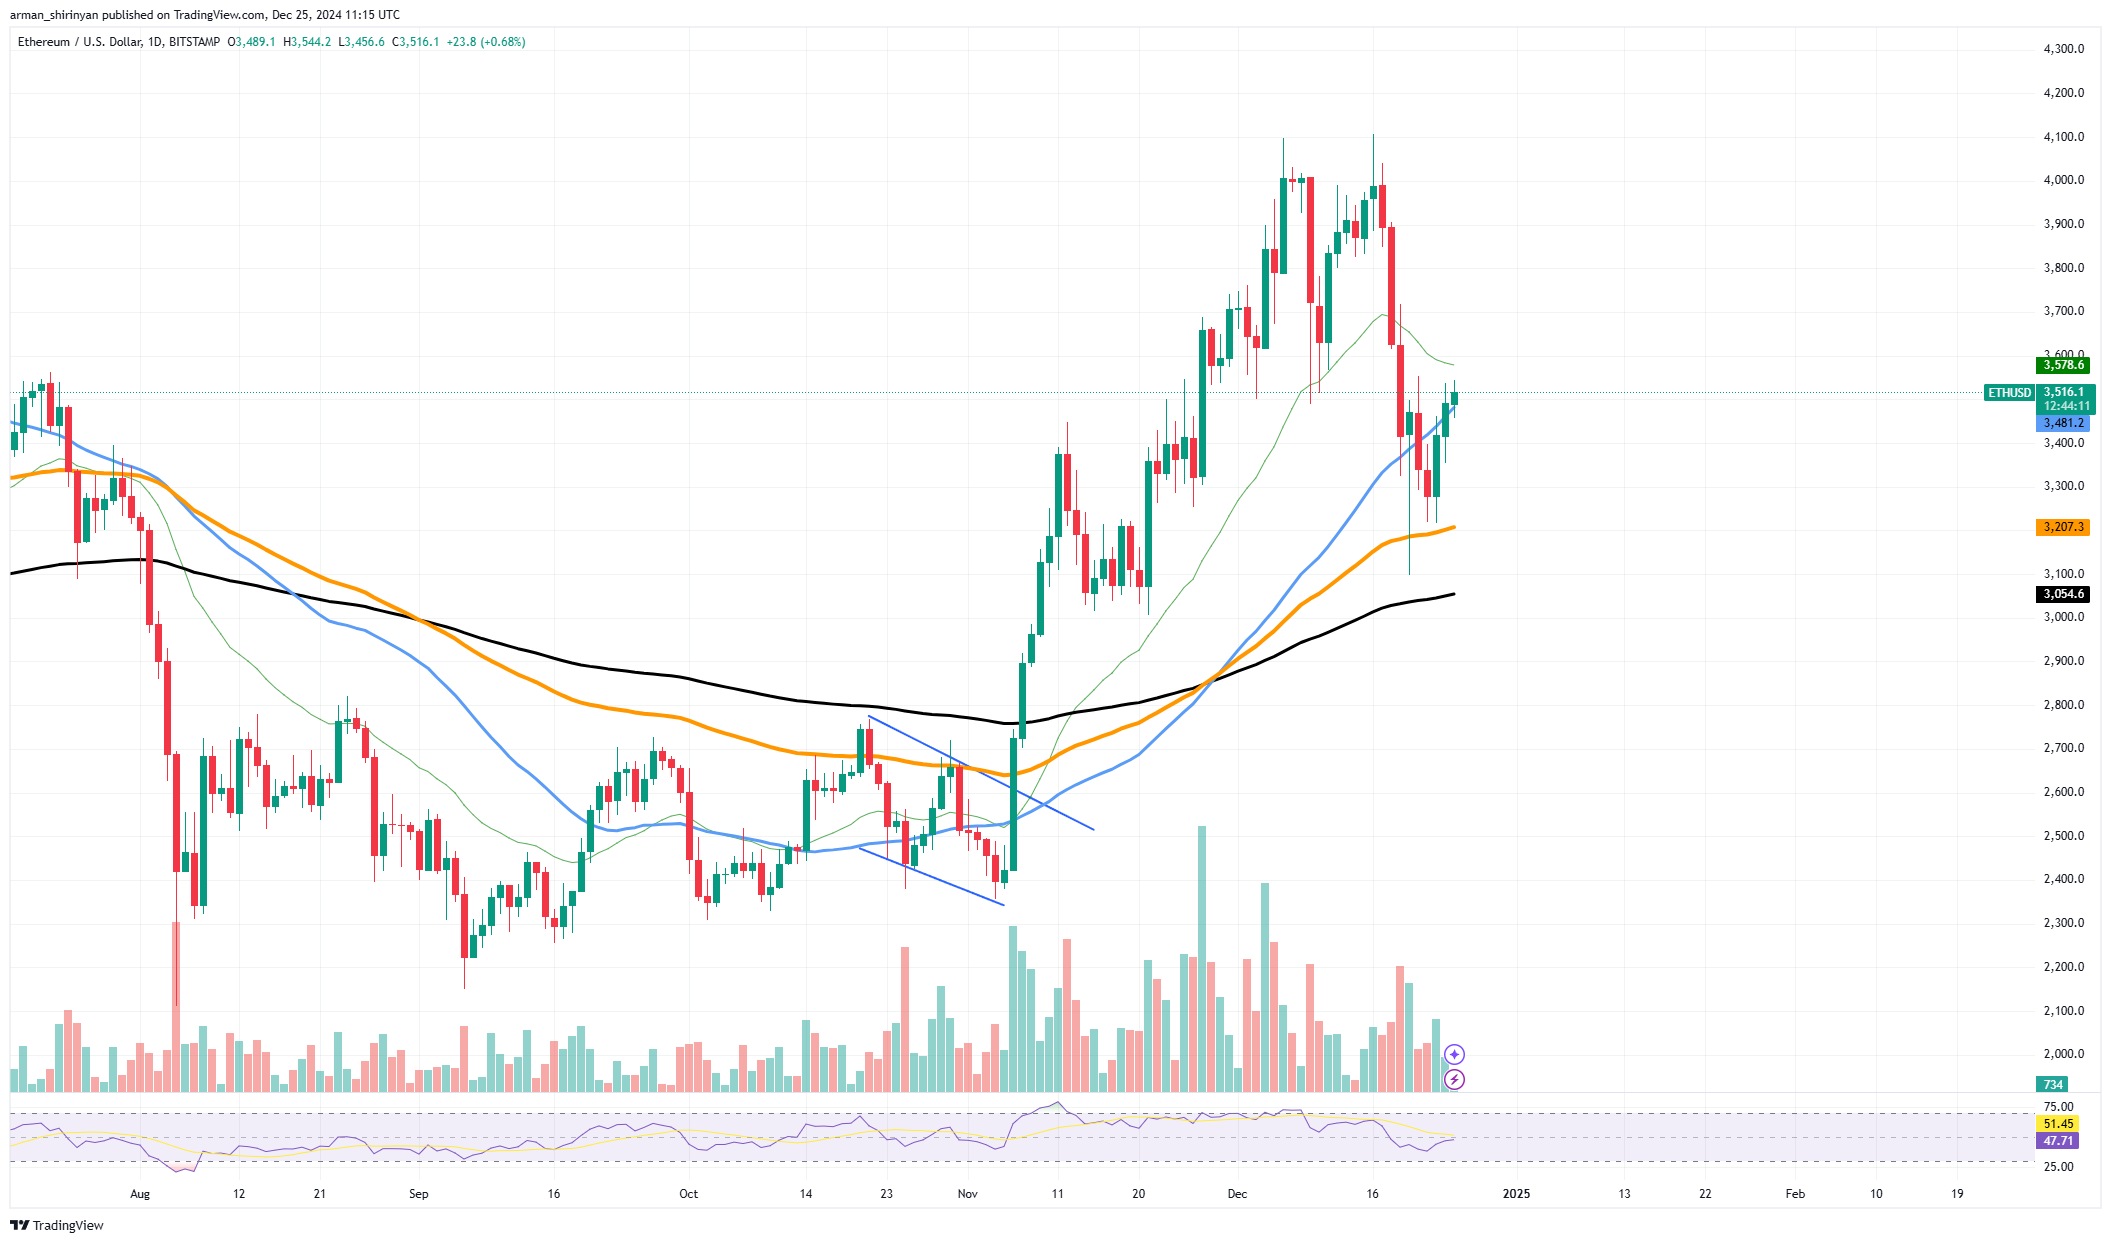
Recent charts of Ethereum have shown an interesting picture with analysts, keeping a close eye on what may be an inverse Head and Shoulders pattern. Looking at this formation over a longer period of time, it appears that Ethereum might be preparing for a big breakout


ETH may reach levels as high as $10,450 if everything goes according to plan, which would be a 265% increase over current prices. The pattern's neckline is located at about $4,000, which has long been a crucial Ethereum resistance area. Ethereum is consolidating below its current price of $3,450, testing earlier resistances as support. 


ETH/USDT Chart by TradingView

A normal and healthy aspect of the pattern's evolution, this retest frequently indicates the strength needed to push higher. Ethereum could start a new rally if it breaks above $4,000; its previous all-time high of $4,800 would be the first significant milestone. After that, the anticipated $10,000 goal becomes attainable. 


HOT Stories Michael Saylor Reacts to Bitcoin Xmas Rally: 'There Is No Second-Best Christmas Gift' Dogecoin Whales on Move: 270 Million DOGE Shifted Within 96 Hours BlackRock's Ethereum ETF Greatly Outperforming Bitcoin ETF XRP's Flag Pattern: What to Expect? Dogecoin (DOGE) Reaches Equilibrium, Bitcoin (BTC) Critical Support Level Reached

The cryptocurrency market as a whole would probably follow such a breakout, rekindling optimism and drawing in fresh investment. This bullish outlook is bolstered by Ethereum's solid foundation of continuous network improvements and leadership in the non-fungible token (NFT) and decentralized finance (DeFi) industries. These factors still support investors' faith in ETH's long-term prospects.


Related
Wed, 12/25/2024 - 10:26 Key SHIB Metaverse Launch Post Issued by Shiba Inu Team After Long Silence
Yuri Molchan

But in order to continue on its upward trajectory, Ethereum needs to hold onto key support levels. Ethereum may experience a retracement toward $3,200 or even $3,050 if the current support level around $3,450 fails. The bullish pattern would be undermined and a protracted period of consolidation or additional decline would be indicated by a drop below the 200 EMA (~$2,700). 


Ethereum's ability to surpass $4,000 will determine whether or not this lofty goal is achieved, even though the inverse Head and Shoulders pattern is a positive indication. The next stage of ETH's development may be significantly impacted by external market conditions and trading volumes, so investors should pay special attention to these variables.


免责声明:本文章仅代表作者个人观点,不代表本平台的立场和观点。本文章仅供信息分享,不构成对任何人的任何投资建议。用户与作者之间的任何争议,与本平台无关。如网页中刊载的文章或图片涉及侵权,请提供相关的权利证明和身份证明发送邮件到support@aicoin.com,本平台相关工作人员将会进行核查。
分享至:
APP下載

X

Telegram

Facebook

Reddit

複製鏈接