
There may be more pain ahead for bitcoin (BTC). That is the message from a weekly chart momentum indicator, which is about to flash the first bearish signal in over three years.
Bitcoin's 50-week simple moving average (SMA) is trending south and looks set to drop below the 100-week SMA in a week or two, confirming the so-called bearish crossover, the first since February 2019.
While, in theory, the upcoming bearish cross would imply strengthening of bearish momentum, the indicator has a perfect record of trapping sellers on the wrong side of the market, similar to the negative SMA crossover confirmed on the three-day chart last month.
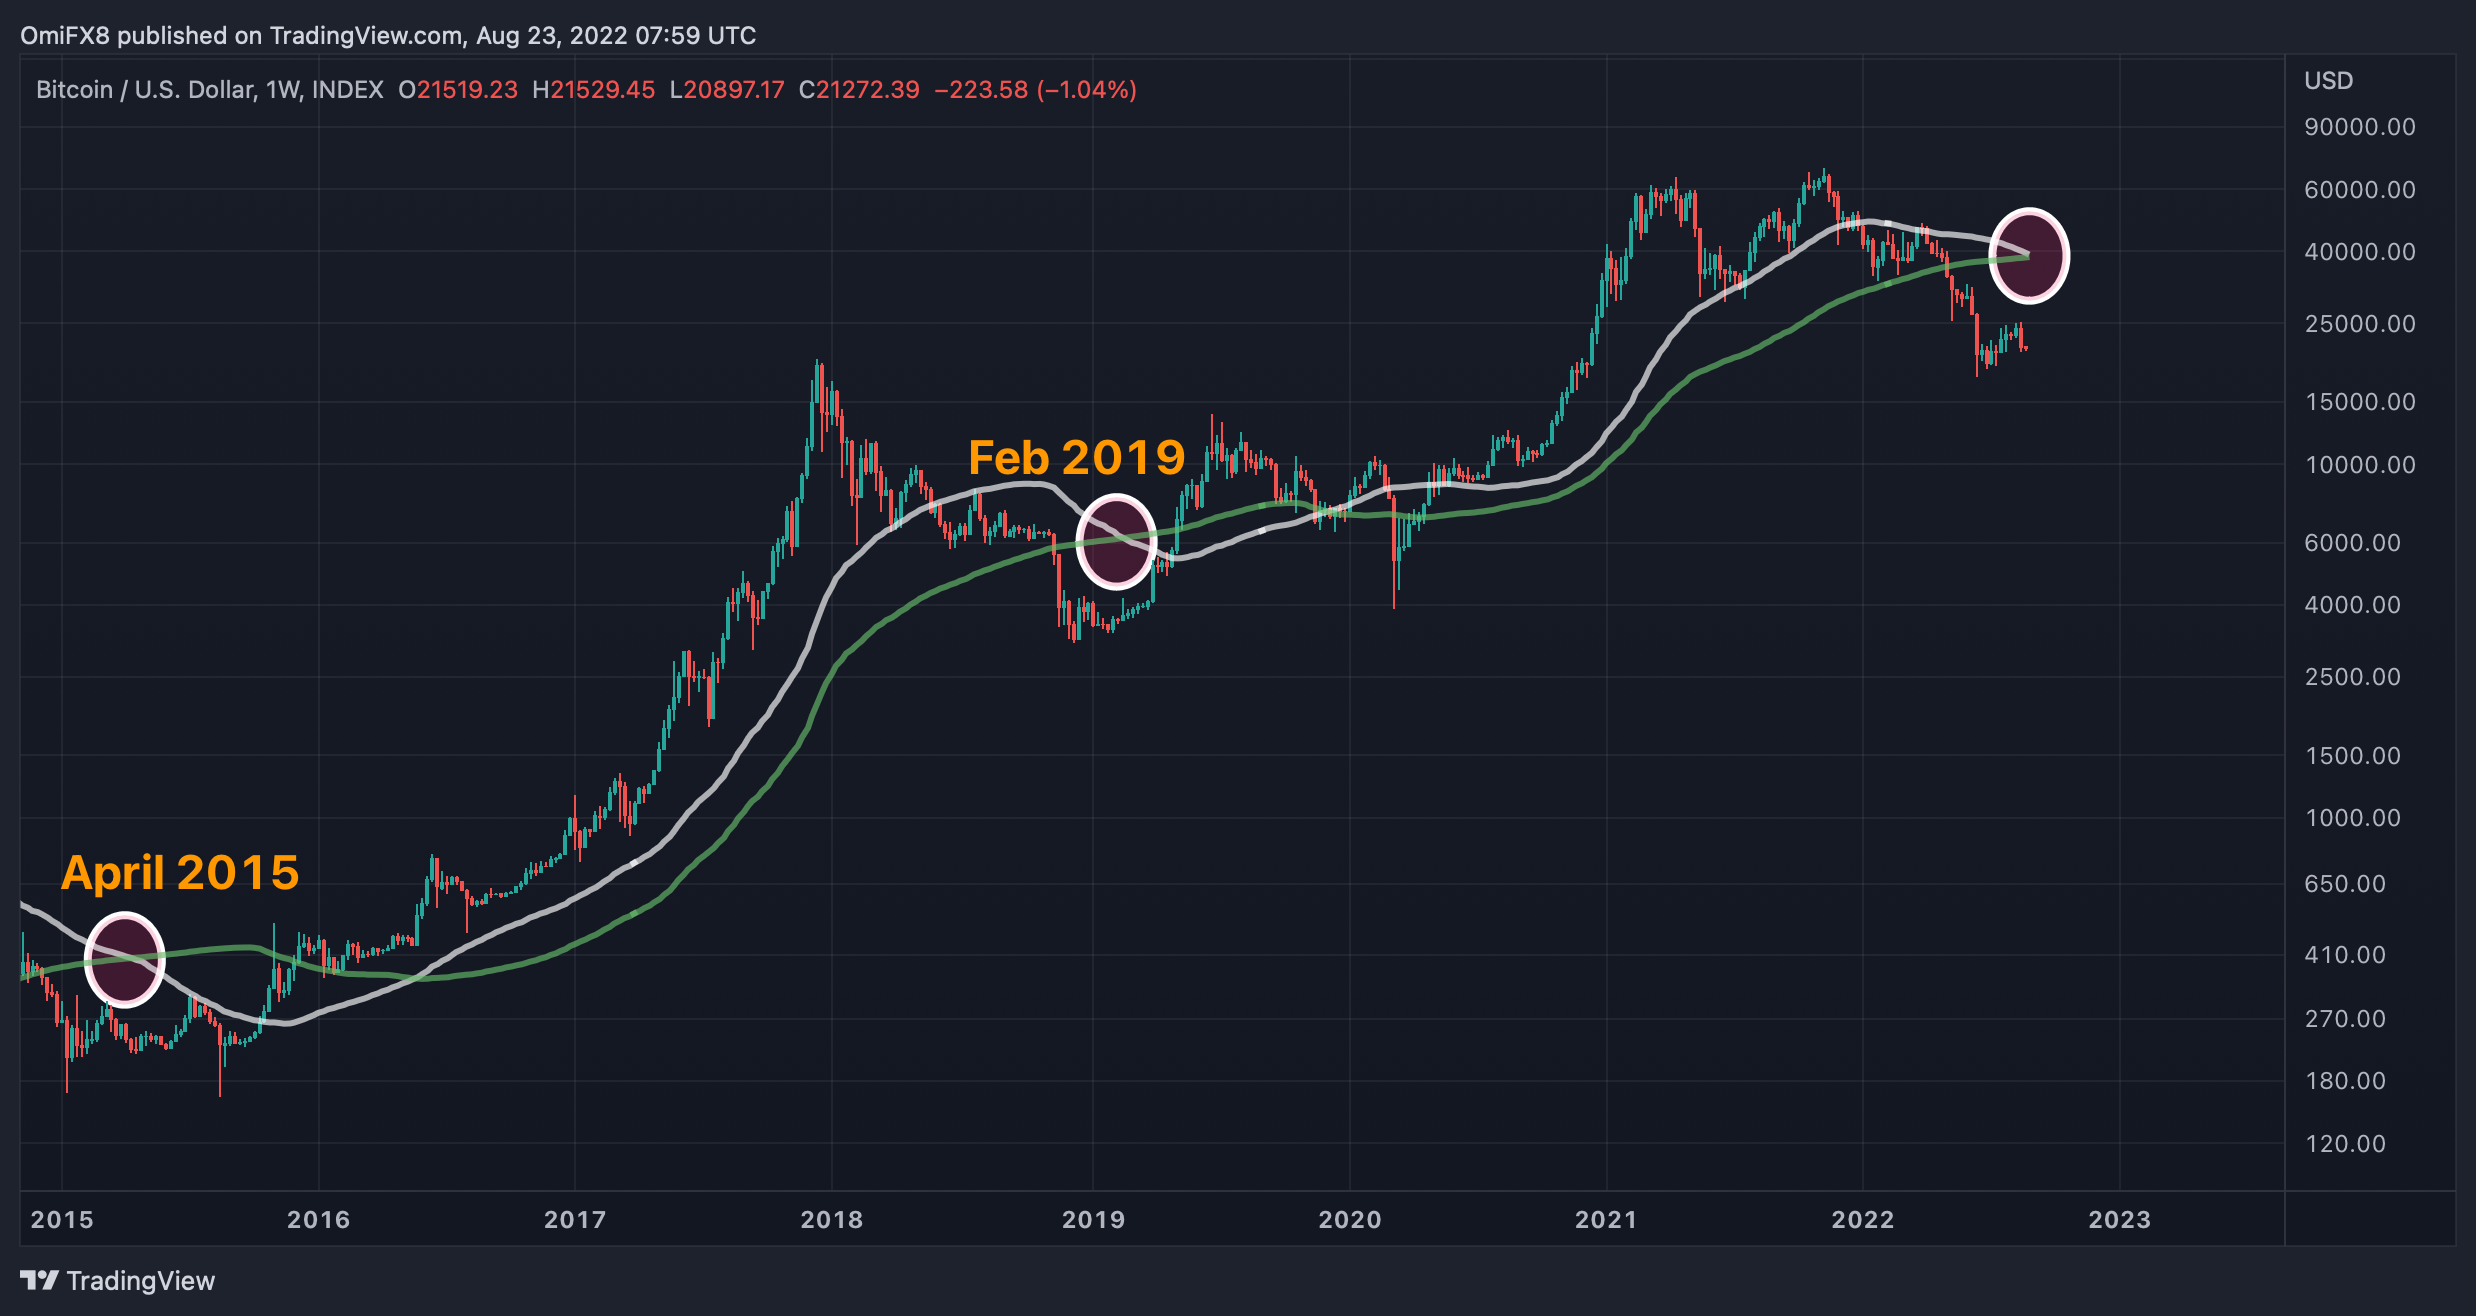
Bearish crossovers dated April 2015 and February 2019 proved to be contrary indicators – those that tell you to bet against the herd.
It remains to be seen if upcoming crossover marks peak selling. Per Delphi Digital, the cryptocurrency could bottom out in November.
"From the previous two cycles, BTC bottomed out 59 and 53 weeks following its cycle top. "Based on this, history suggests a bottom sometime around the end of November 2022 and a new cycle top in August 2025," Delphi Digital's Andrew Krohn wrote in a daily update sent to clients.
Past performance is no guarantee of future results, more so, as the cryptocurrency has become sensitive to macro factors like central bank policies and traditional market sentiment over the past two years.
免责声明:本文章仅代表作者个人观点,不代表本平台的立场和观点。本文章仅供信息分享,不构成对任何人的任何投资建议。用户与作者之间的任何争议,与本平台无关。如网页中刊载的文章或图片涉及侵权,请提供相关的权利证明和身份证明发送邮件到support@aicoin.com,本平台相关工作人员将会进行核查。


