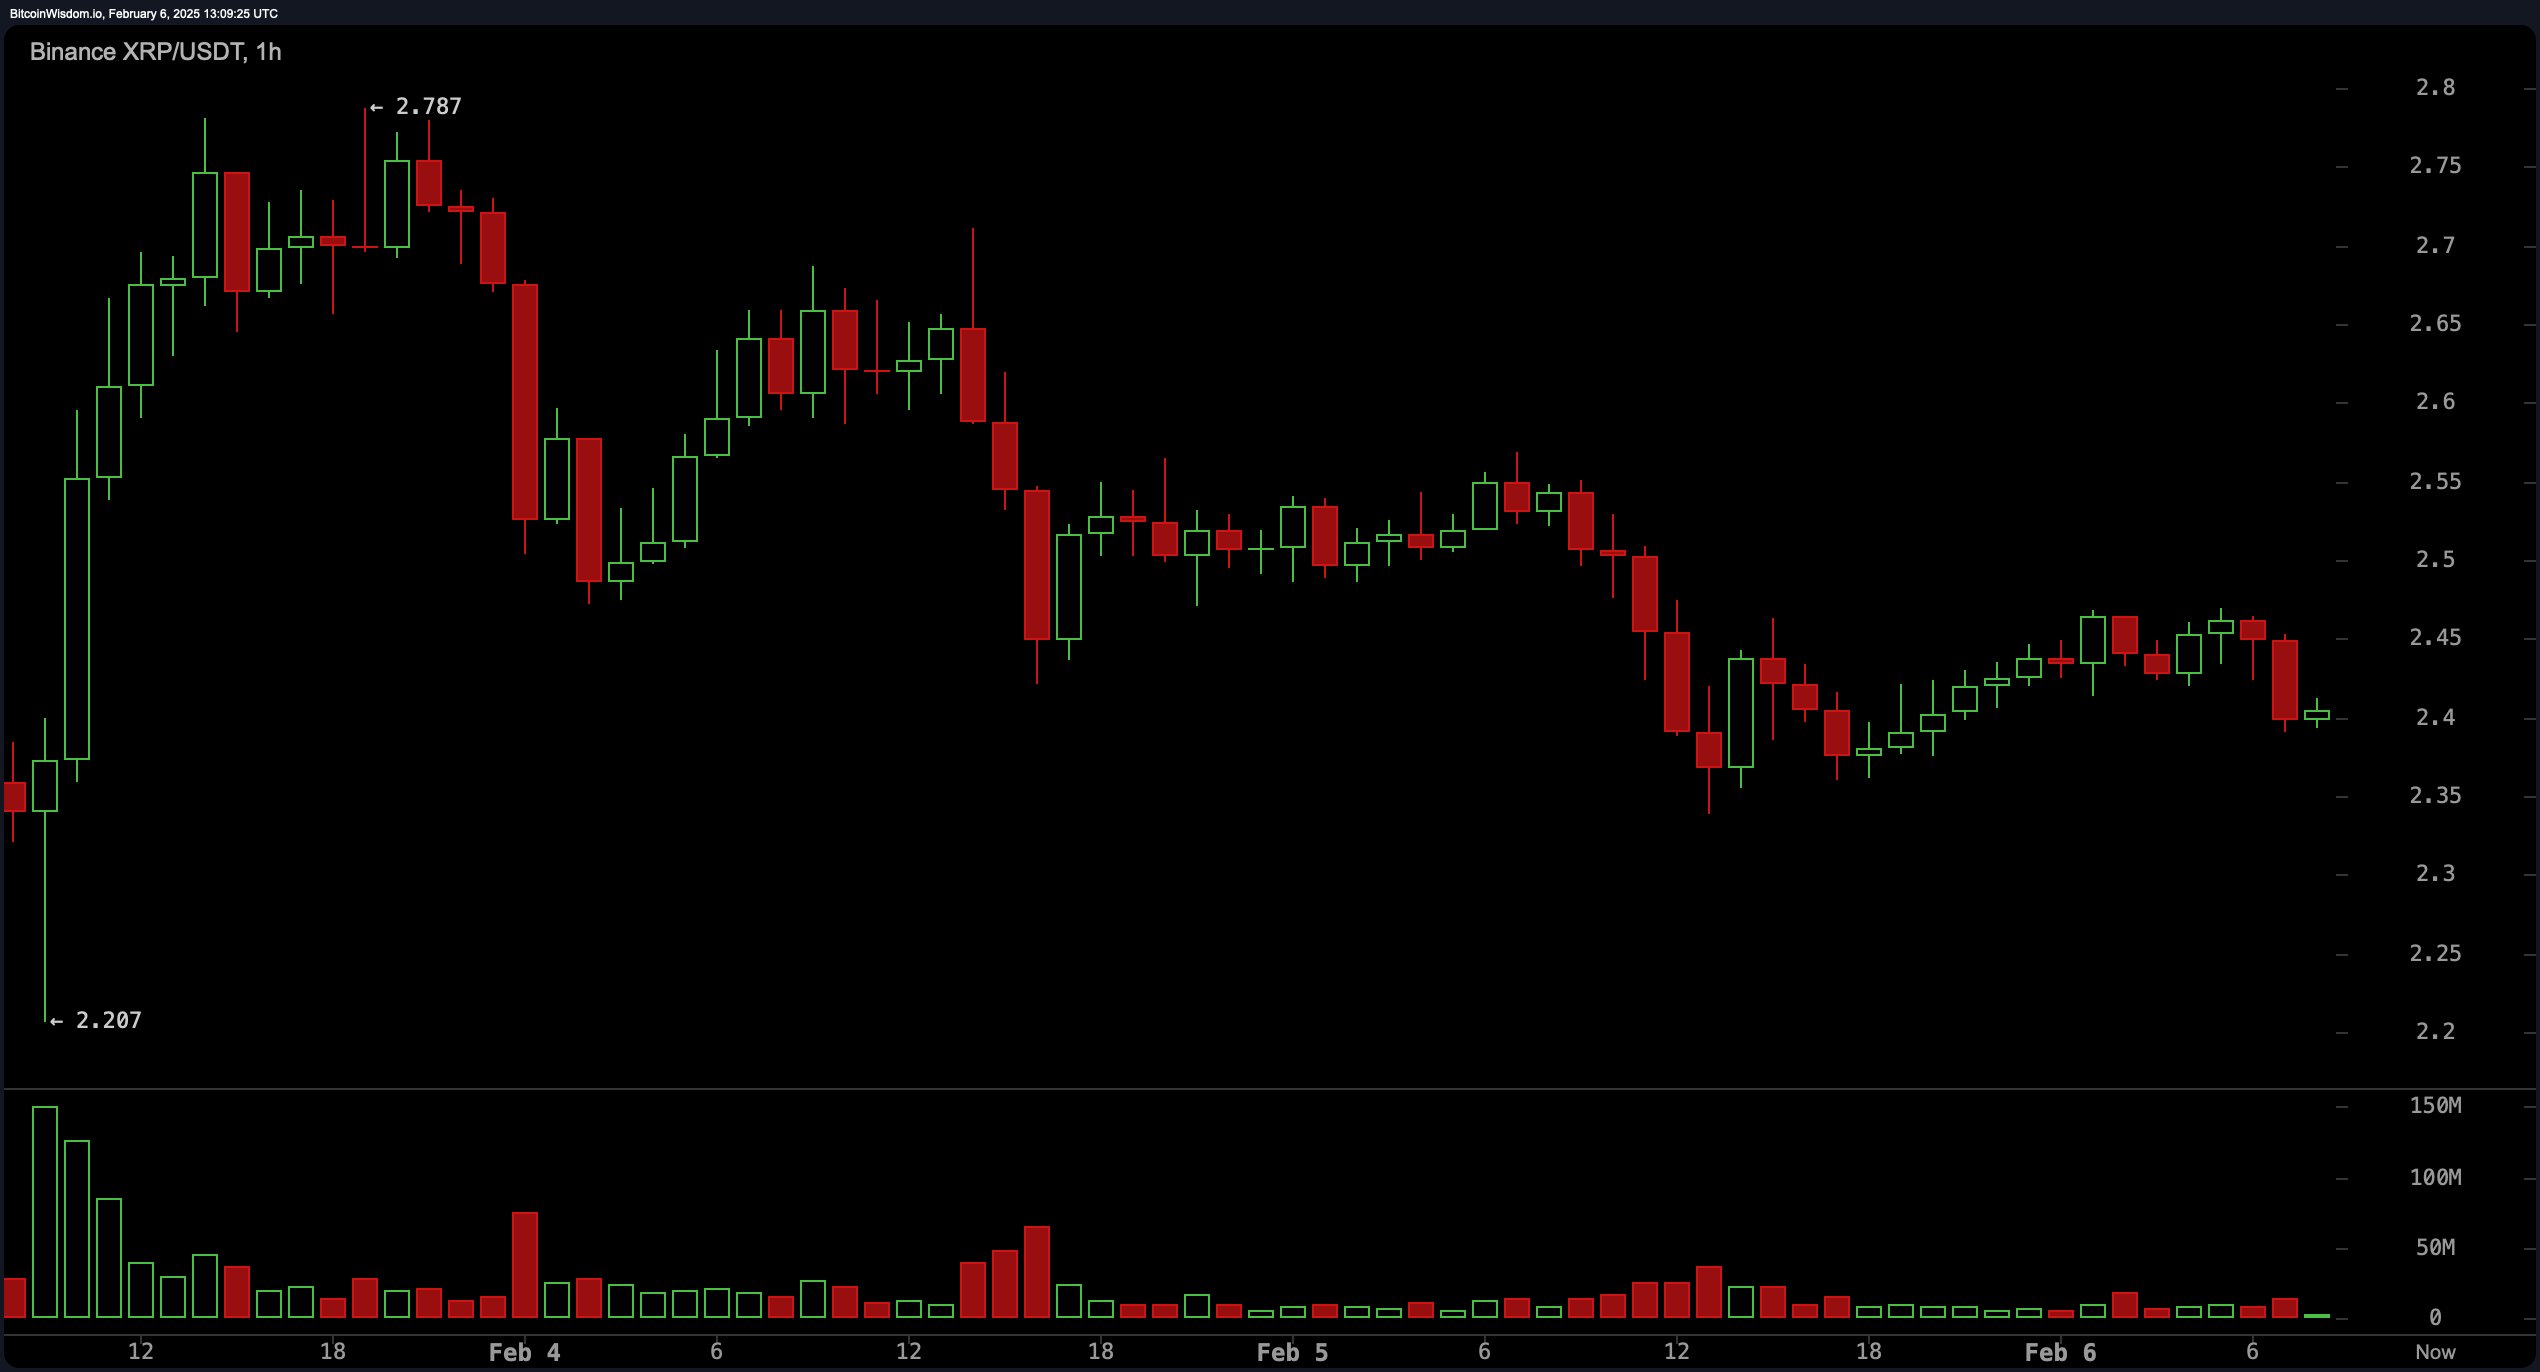
On XRP’s hourly chart, the digital asset oscillates within a constricted corridor of $2.35 to $2.50, as sellers dominate yet tentative stabilization efforts emerge. Piercing the $2.50 ceiling might propel a rally toward $2.60, whereas slipping beneath $2.35 could trigger a descent to $2.30 or beyond. Ambiguity pervades the market: descending peaks hint at persistent pessimism, though faint green candlesticks whisper of a fleeting respite.

XRP/USDT Binance 1H chart on Feb. 6, 2025.
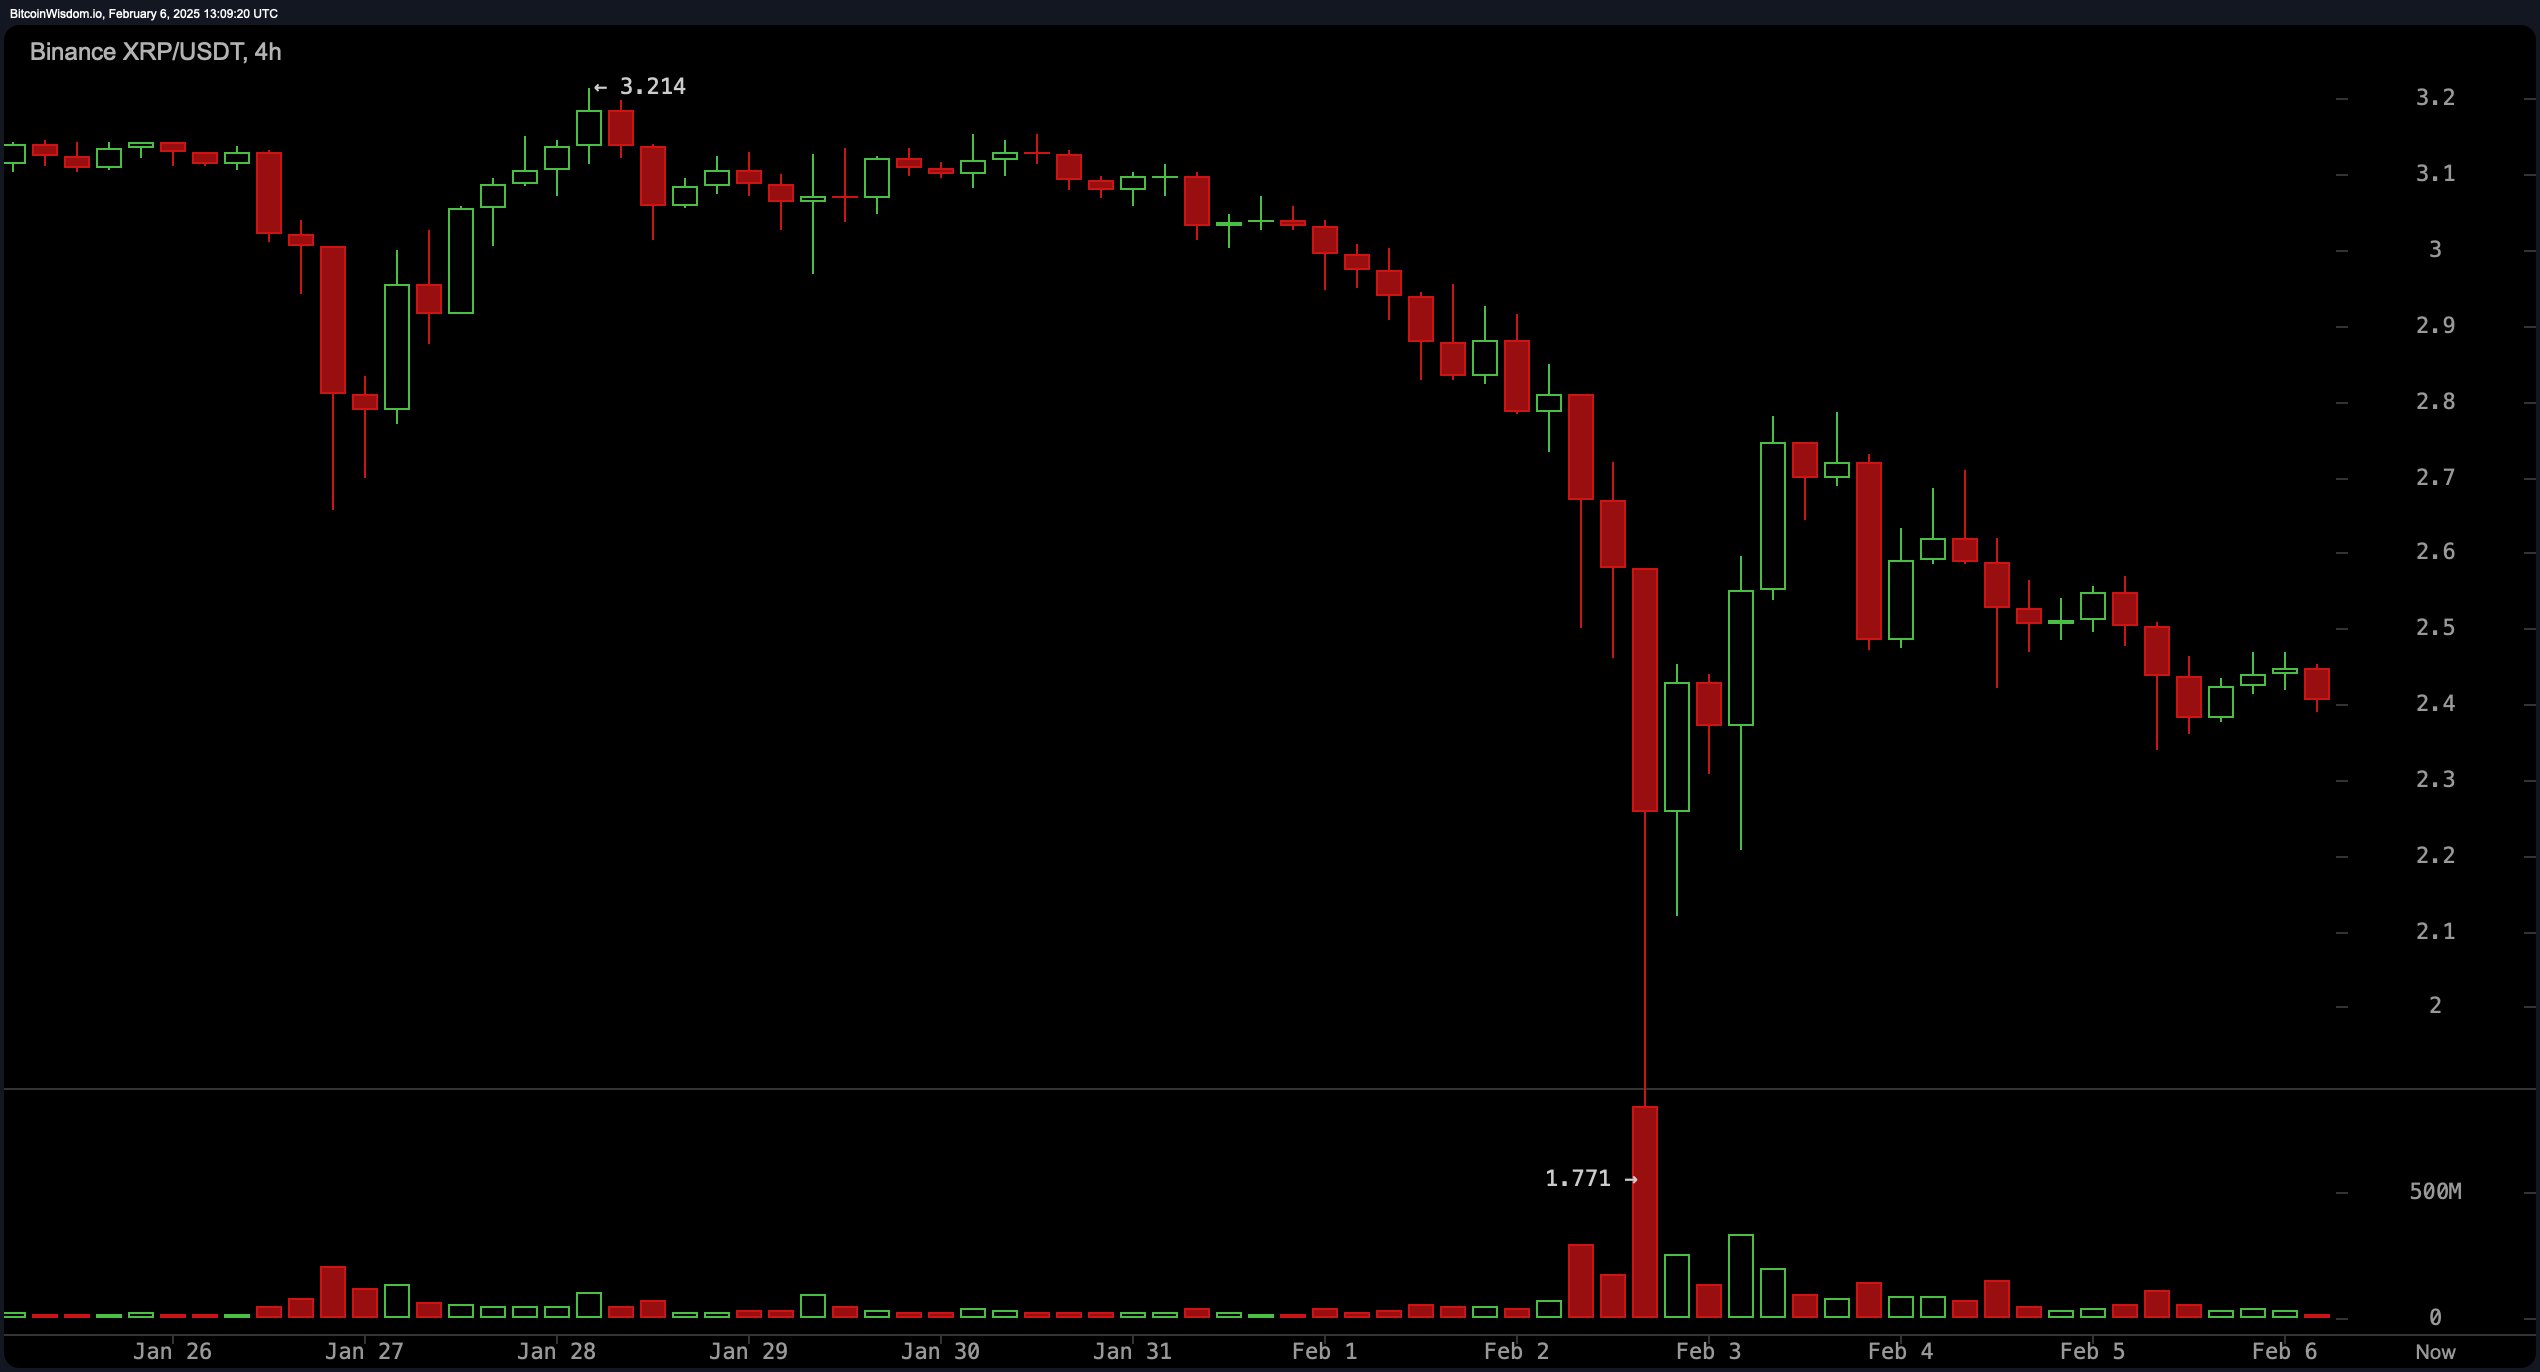
The four-hour view reveals a precipitous plunge from $3.21, punctuated by a high-volume cascade to $1.77 before a partial recovery. Current efforts to anchor near $2.40–$2.50 face headwinds from consecutive lower peaks, underscoring the bears’ grip. Immediate barriers cluster at $2.60–$2.70, with foundational support at $2.30–$2.40. Sustained footing above $2.40 accompanied by rising activity might seed a brief equilibrium, but faltering at $2.60 risks reigniting downward momentum toward $2.00–$1.80.

XRP/USDT Binance 4H chart on Feb. 6, 2025.
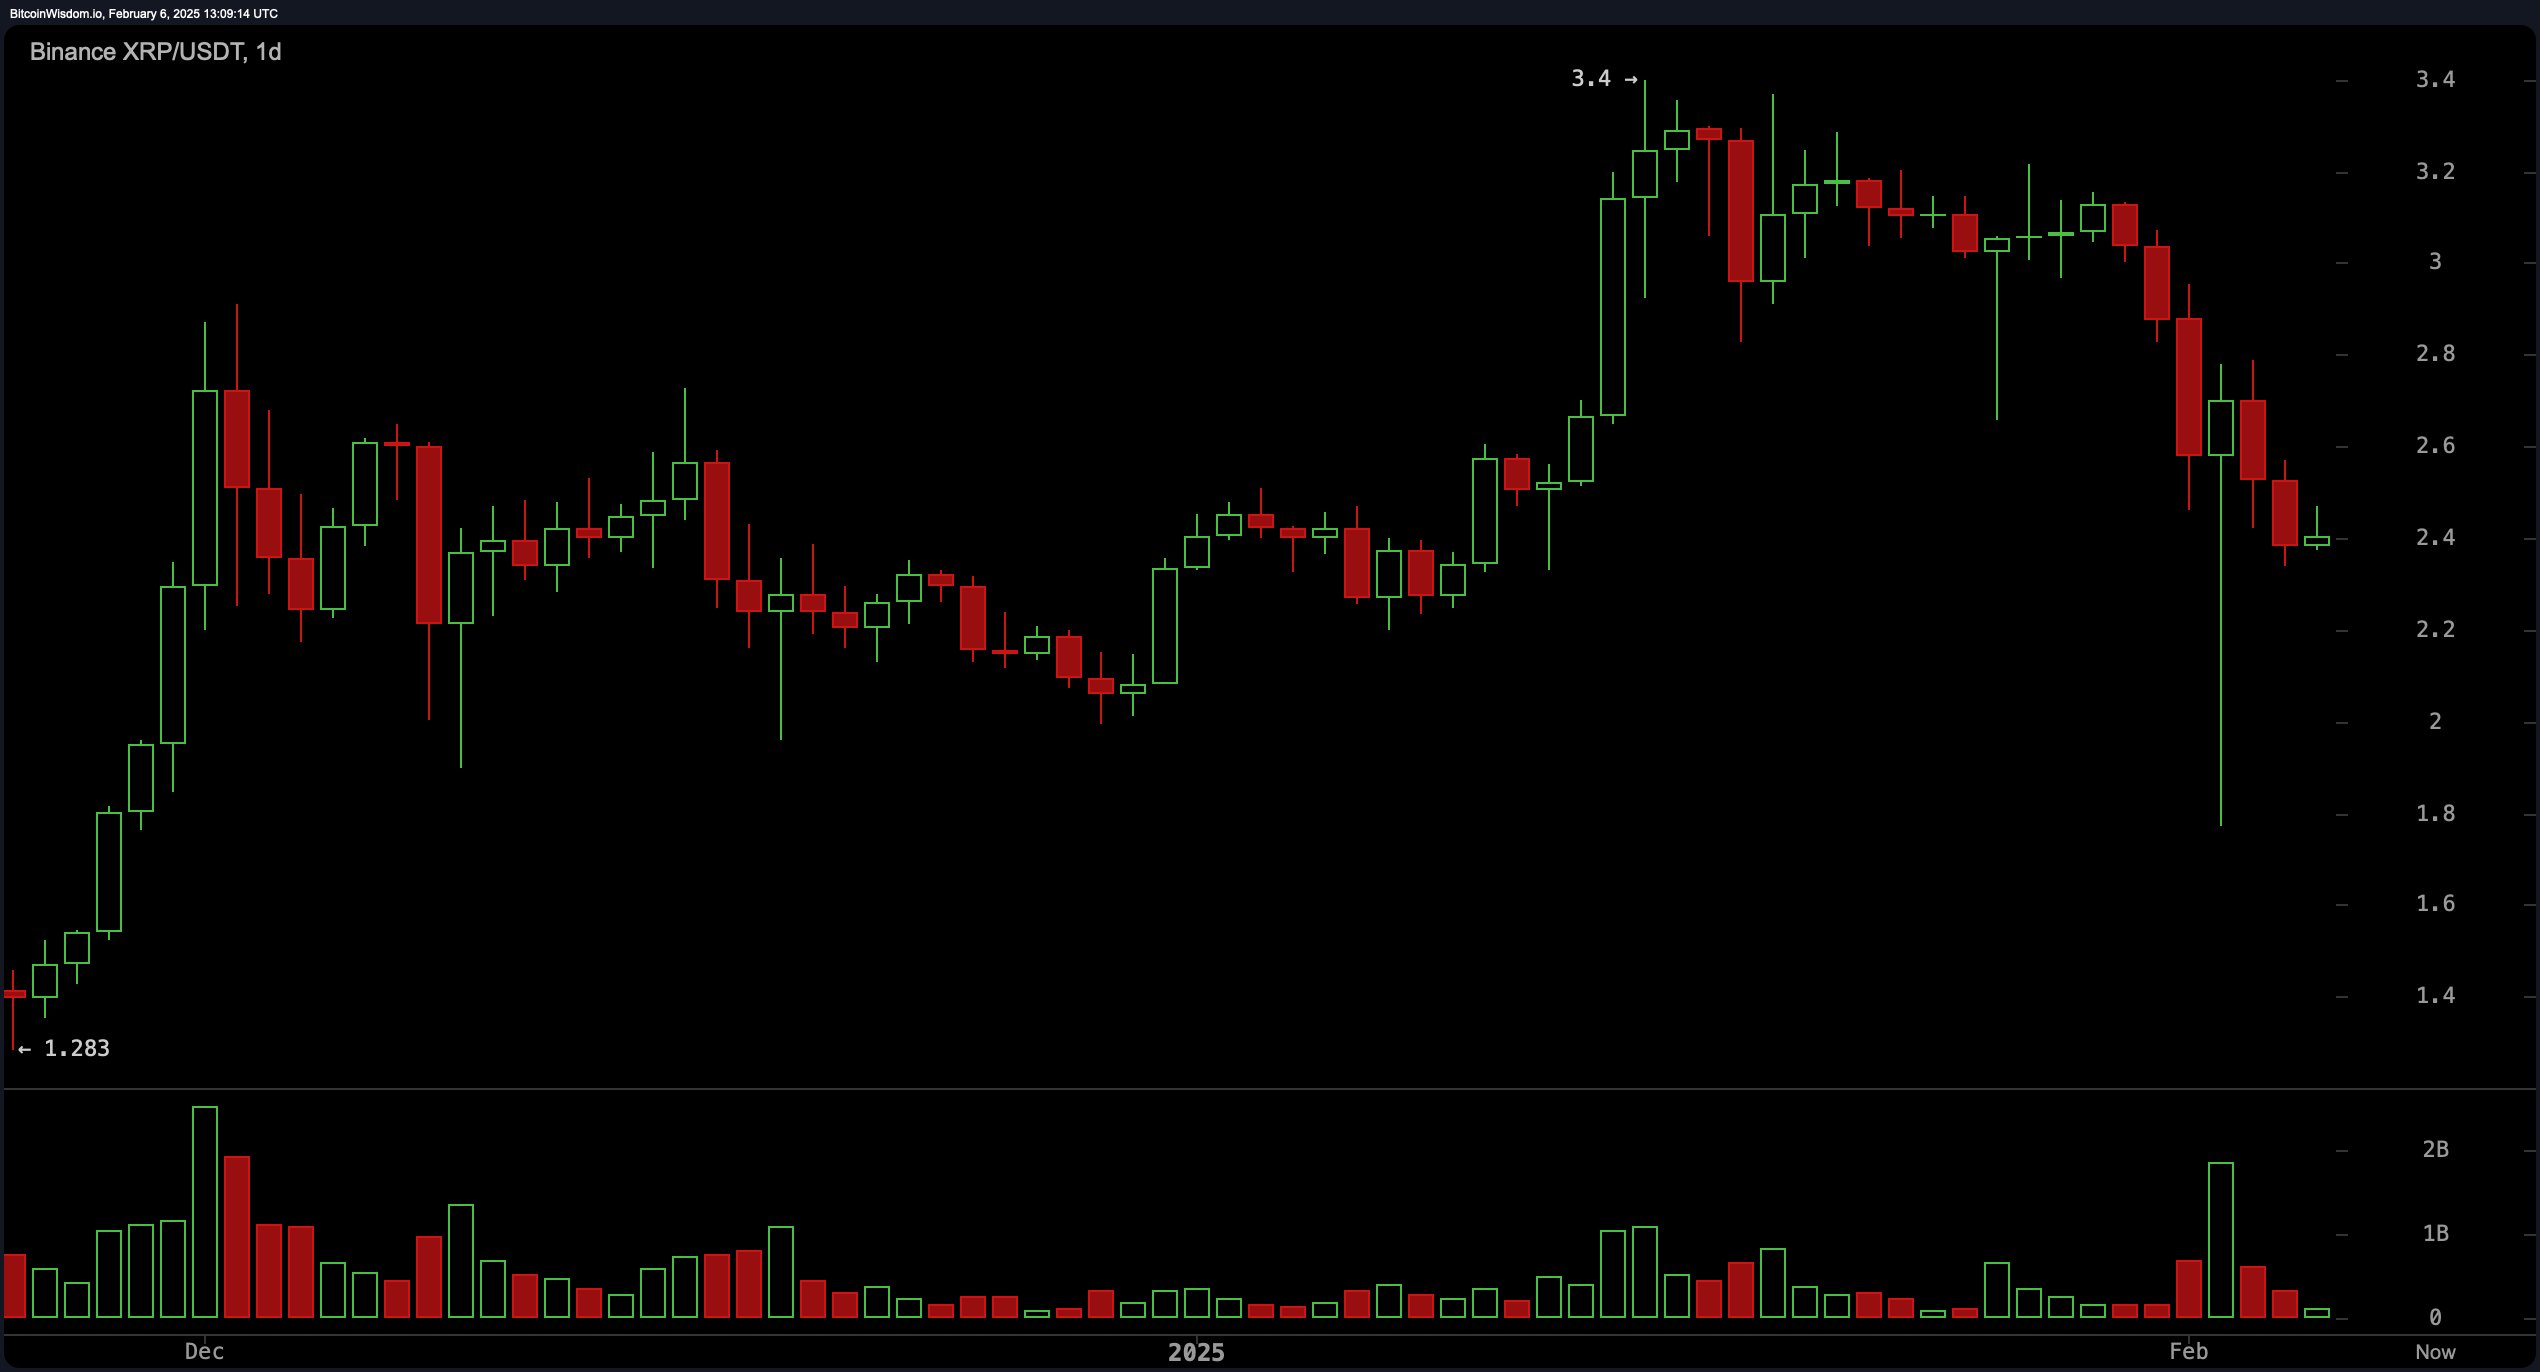
Zooming to the daily perspective, XRP’s earlier vigorous ascent to $3.40 dissolved into a swift retreat, amplified by fervent selling that cemented bearish fervor. The $2.40 threshold now serves as a critical juncture; breaching it could expedite a slide toward $2.00. Optimists must recapture $2.80 to reassert authority, though the $3.00–$3.40 zone looms as a formidable barrier. While sellers command the narrative, a coiled consolidation phase might foreshadow a pivot if demand intensifies.

XRP/USDT Binance 1D chart on Feb. 6, 2025.
Technical oscillators offer divergent signals. The relative strength index (RSI) at 36.35 and Stochastic at 45.43 hover in neutral realms. Meanwhile, the commodity channel index (CCI) at -157.56 hints at latent purchasing prospects, countered by momentum (-0.65) and moving average convergence divergence (MACD) (-0.047) readings that echo caution. The average directional index (ADX) at 29.16 remains noncommittal, while the awesome oscillator’s -0.288 reading mirrors tepid market vitality.
Trending moving averages (MAs) lean bearish near-term: The exponential moving average (EMA) 10 (2.68884), simple moving average (SMA) 10 (2.77590), EMA 20 (2.78095), and SMA 20 (2.94195) collectively echo a somber refrain. Downward gravitas finds reinforcement from the EMA 50 (2.60493) and SMA 50 (2.61975). Yet glimmers of underlying strength flicker in longer horizons, with the EMA 100 (2.17199), SMA 100 (2.05501), EMA 200 (1.62961), and SMA 200 (1.31022) all flashing green for patient strategists.
Bull Verdict:
Despite recent selling pressure, XRP’s ability to hold the $2.40 support level could set the stage for a relief bounce, with a potential breakout above $2.60 leading to a push toward $2.80 or higher. If volume increases and oscillators shift bullish, buyers may regain control, targeting resistance at $3.00 and beyond.
Bear Verdict:
XRP remains in a downtrend with lower highs and consistent selling pressure across multiple timeframes. A break below $2.35 could accelerate losses toward $2.00 or lower, while weak momentum indicators and bearish moving averages suggest further downside. Unless bulls reclaim key resistance zones, XRP may struggle to regain its previous highs.
免责声明:本文章仅代表作者个人观点,不代表本平台的立场和观点。本文章仅供信息分享,不构成对任何人的任何投资建议。用户与作者之间的任何争议,与本平台无关。如网页中刊载的文章或图片涉及侵权,请提供相关的权利证明和身份证明发送邮件到support@aicoin.com,本平台相关工作人员将会进行核查。


