Technical analysis is a method of analyzing past price movements and historical trading data to identify patterns in price changes within the trading market, thereby predicting future trends and changes. Unlike fundamental analysis, which requires evaluating market prices from multiple levels and different perspectives, technical analysis focuses primarily on observing price behavior in the market and calculating various indicators derived from a large amount of trading data.
History of Technical Analysis
The origin of technical analysis can be traced back to centuries of human observation of financial markets. In 18th century Japan, there were already individuals using technical analysis for trading. It is said that a rice merchant named Homma Sōkyū recorded the opening price, highest price, lowest price, and closing price of rice in the market daily, and invented the candlestick chart, which is now widely used in stock, futures, and digital currency markets. However, a more systematic theory of technical analysis was gradually developed in the 19th century when Charles Dow synthesized the work of several researchers and proposed the famous Dow Theory. Dow Theory can be considered the foundation of technical analysis, judging future trends based on previous price changes and trading volumes. Technical analysis typically uses charts for presentation, and after a long evolution, modern technical analysis now includes hundreds of chart patterns and indicators.
Principles and Assumptions of Technical Analysis
There are three very basic assumptions in the study of technical analysis:
All market information will eventually be reflected in prices, and the market is highly efficient; prices act like a mirror, reflecting the effects of various news factors on price fluctuations in real-time.
Even in seemingly random market price behavior, identifiable patterns and trends can still be found, and prices are easily influenced by past trends, continuing in their previous direction.
Due to the psychological expectations of market participants, history tends to repeat itself, causing prices to exhibit certain periodicity and trend directions, rather than changing abruptly.
Based on the above arguments, researchers in technical analysis believe that by identifying the hidden patterns in historical prices, they can predict future market price trends.
Applications of Technical Analysis
When using technical analysis, discussions are generally divided into two different categories: patterns and indicators. When price patterns change, specific shapes will appear on the candlestick chart, such as head and shoulders, double tops, double bottoms, ascending triangles, descending triangles, etc. Based on different chart patterns, key price zones can be identified as references for trading; in the vocabulary of technical analysis, these key price areas are commonly referred to as support and resistance.
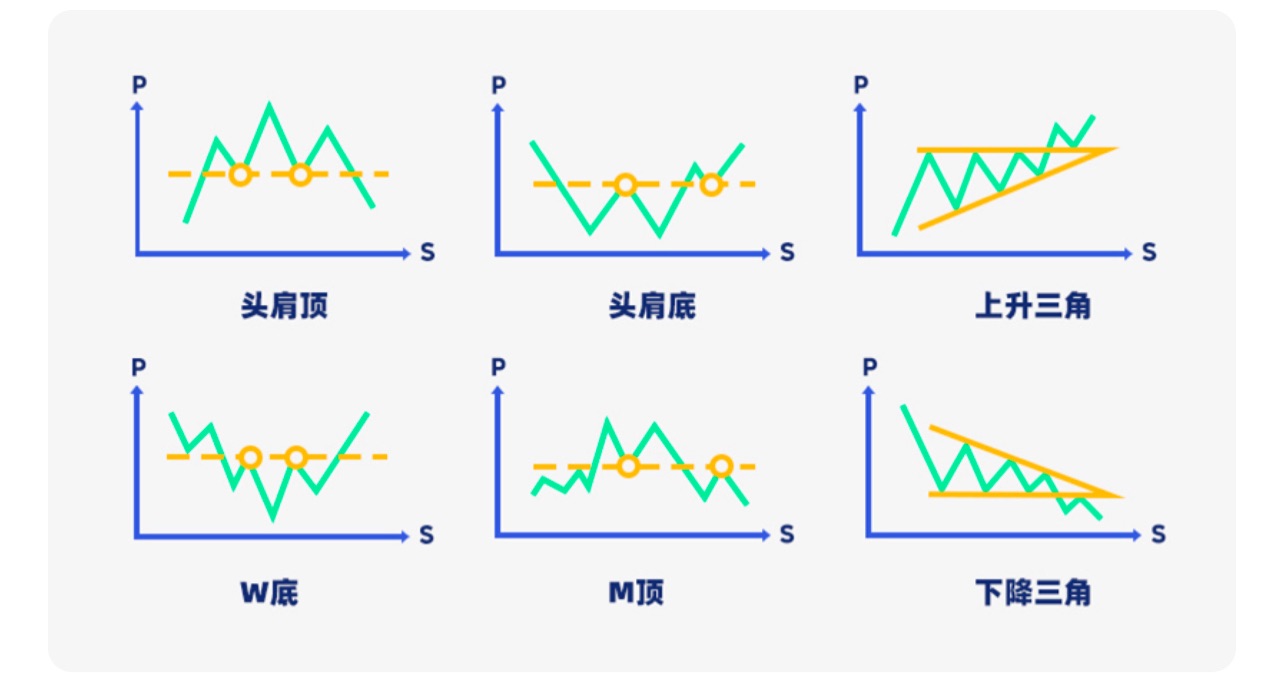
Determining support and resistance is quite important for traders using technical analysis. These price ranges are usually accompanied by a large amount of capital turnover and are one of the bases for judging trend formation or reversal. In an uptrend, encountering resistance may lead to a reversal and decline, while in a downtrend, encountering support may lead to a rebound. Therefore, traders can choose to buy long when prices approach support levels and sell short when prices approach resistance levels.
Taking the common double bottom pattern as an example, after a rebound following a decline that breaks through the previous high, the price range of the previous high forms a key support level, indicating that the selling pressure in that area has been exhausted and turned into buying pressure, suggesting a bullish pattern for the future. Conversely, the double top is exactly the opposite; after a pullback following an uptrend that breaks below the previous low, the price range of the previous low forms a key resistance level, indicating that the buying pressure in that area has been exhausted and turned into selling pressure, suggesting a bearish pattern for the future.
Technical analysis indicators use statistical methods to study historical trading data, summarizing mathematical formulas used to predict future market trends. Based on the variables used, they can be divided into trend indicators, oscillators, and volume indicators, and based on the applicable time frame, they can be divided into short-term, medium-term, and long-term indicators.
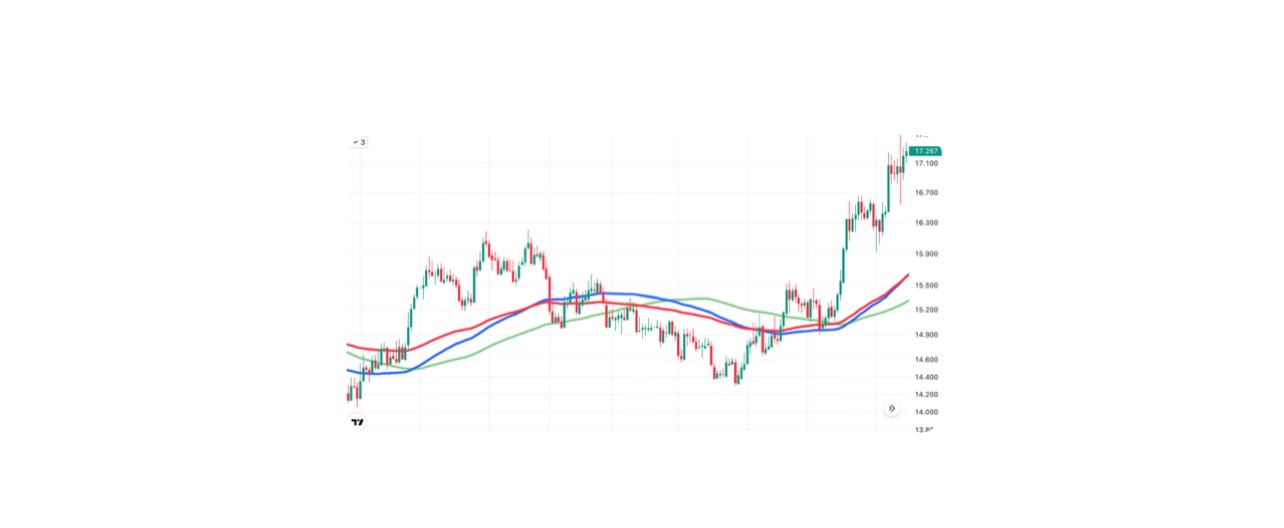
A convenient and commonly used indicator is the moving average. The moving average is calculated based on historical prices over a specified period and can be seen as the price trend over a past period. Depending on whether there is price weighting, moving averages can be divided into simple moving averages (SMA) without weighting, exponential moving averages (EMA) that place more emphasis on recent prices, and weighted moving averages (WMA), which use weighting on recent prices to highlight deviations in trends and potential trend reversals.
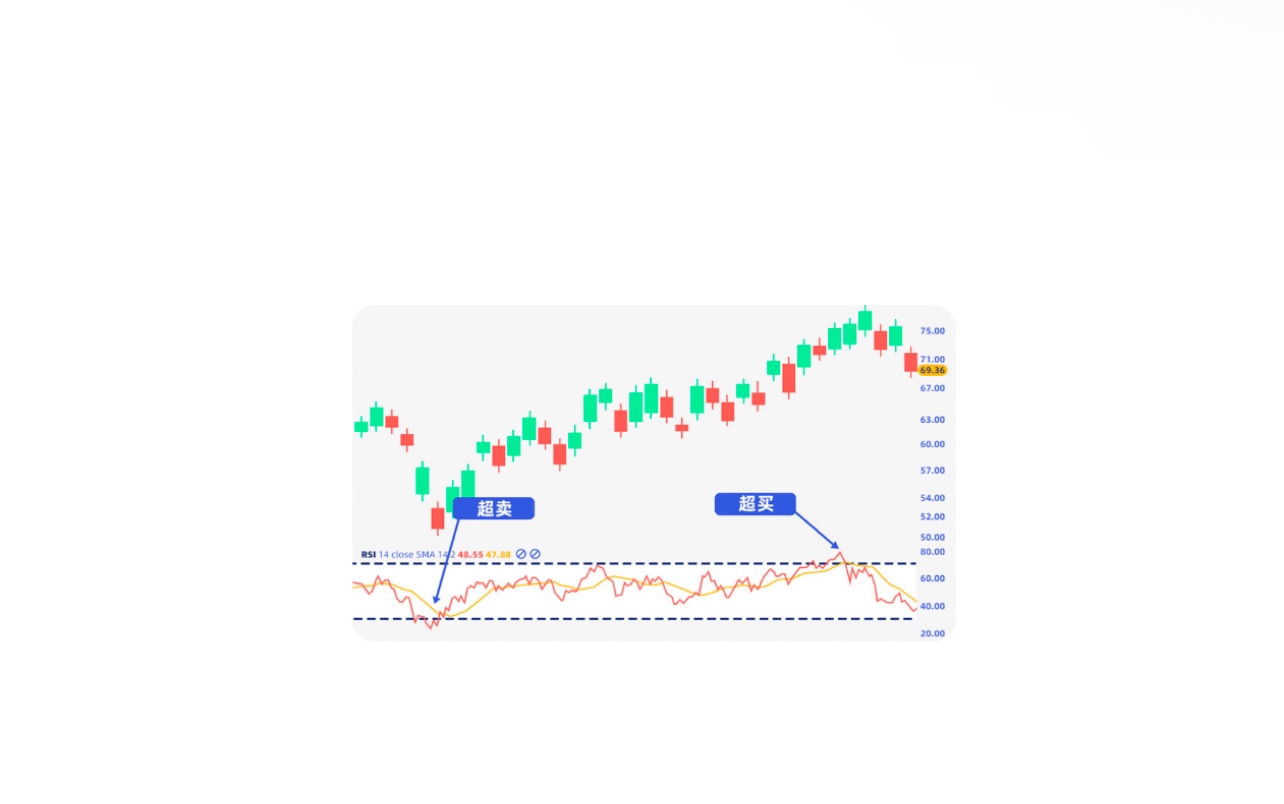
The Relative Strength Index (RSI) is also a commonly used indicator that standardizes the difference in magnitude between price increases and decreases through a series of mathematical calculations, resulting in a value range of 0 to 100. In a bullish market where price increases exceed price decreases, the RSI value will be higher, and conversely, it will be lower in a bearish market. Generally, an RSI above 70 is considered indicative of a strong buying market, while an RSI below 30 indicates a weak market with potential overselling.
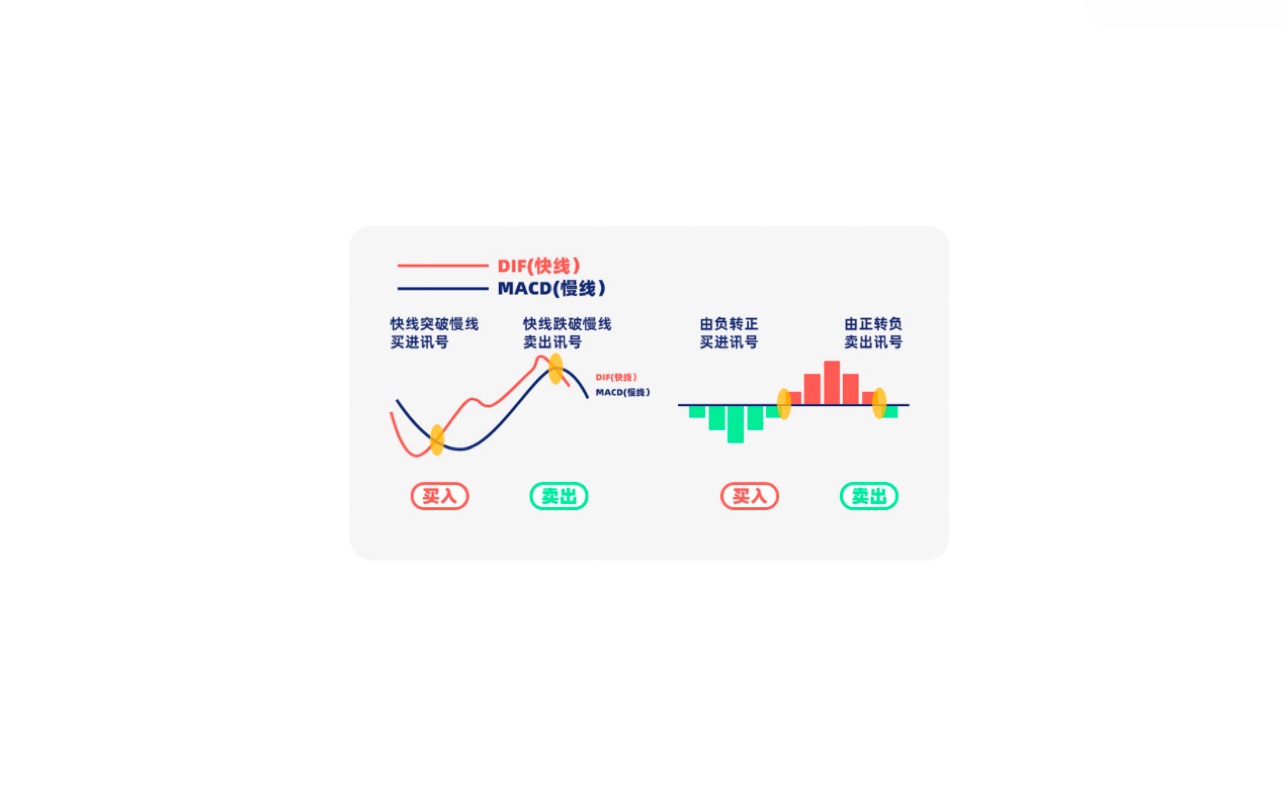
Some indicators are derived from calculations of other indicators, such as the Moving Average Convergence Divergence (MACD) indicator, which calculates the price difference between two different time period exponential moving averages to form the MACD line (fast line). The exponential moving average used to calculate the MACD line can show the trend of the MACD line's changes, also known as the signal line (slow line). By subtracting the value of the signal line from the MACD line, the MACD histogram can be obtained. When the MACD line crosses above the signal line, it indicates that the recent exponential moving average price difference is positive and greater than the average, signaling a bullish trend; when the MACD line crosses below the signal line, it indicates that the recent exponential moving average price difference is negative and less than the average, a common pattern in bearish markets.
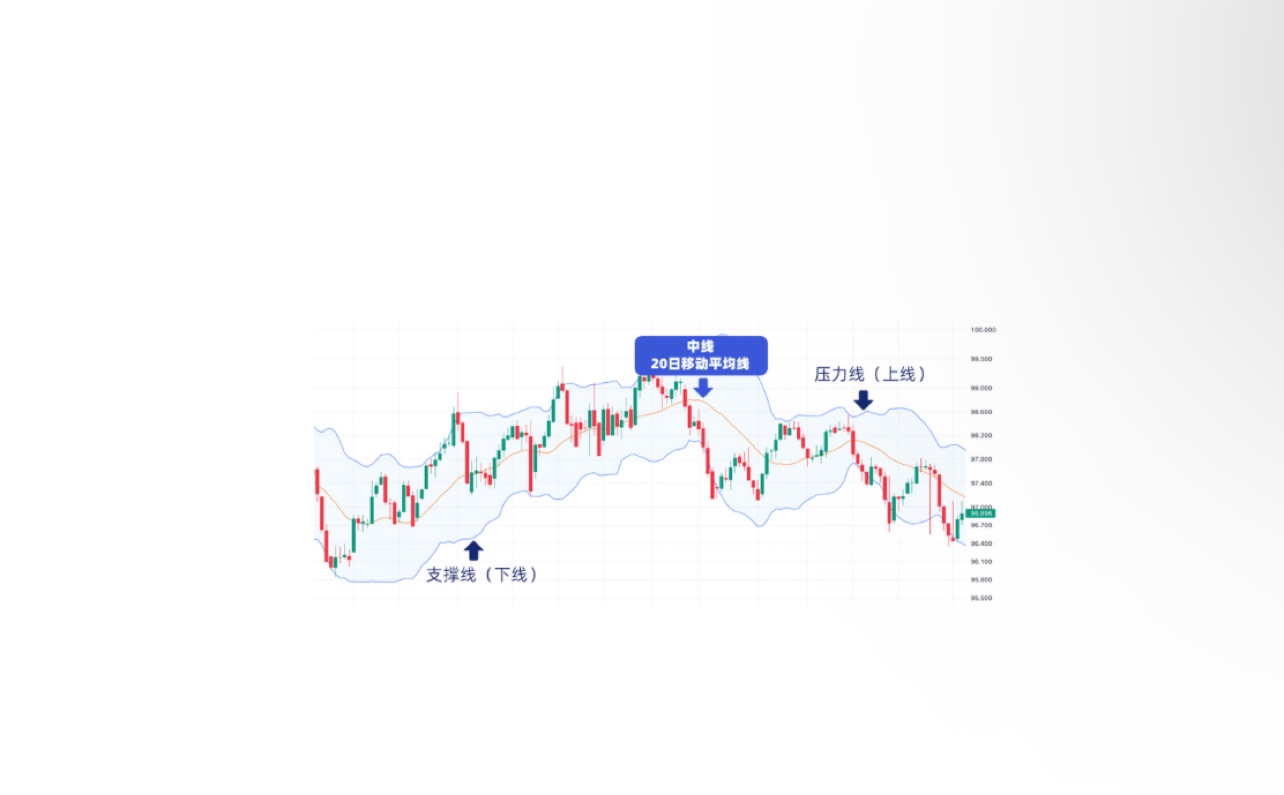
Bollinger Bands (BB) are also a popular technical indicator among many traders. It combines the concepts of moving averages and standard deviations to plot potential price ranges on the candlestick chart. The specific method is to use the simple moving average of the past n prices as the center, calculate the standard deviation of these n prices, and extend m standard deviations upward and downward as boundaries. The characteristic of Bollinger Bands is that when prices oscillate around the moving average, statistical methods can be used to calculate the probability of different prices occurring. Under normal distribution, about 95% of values will fall within two standard deviations from the mean. When prices approach the upper or lower edge of the Bollinger Bands, it usually indicates a significant deviation from the mean, potentially signaling a buying or selling opportunity.
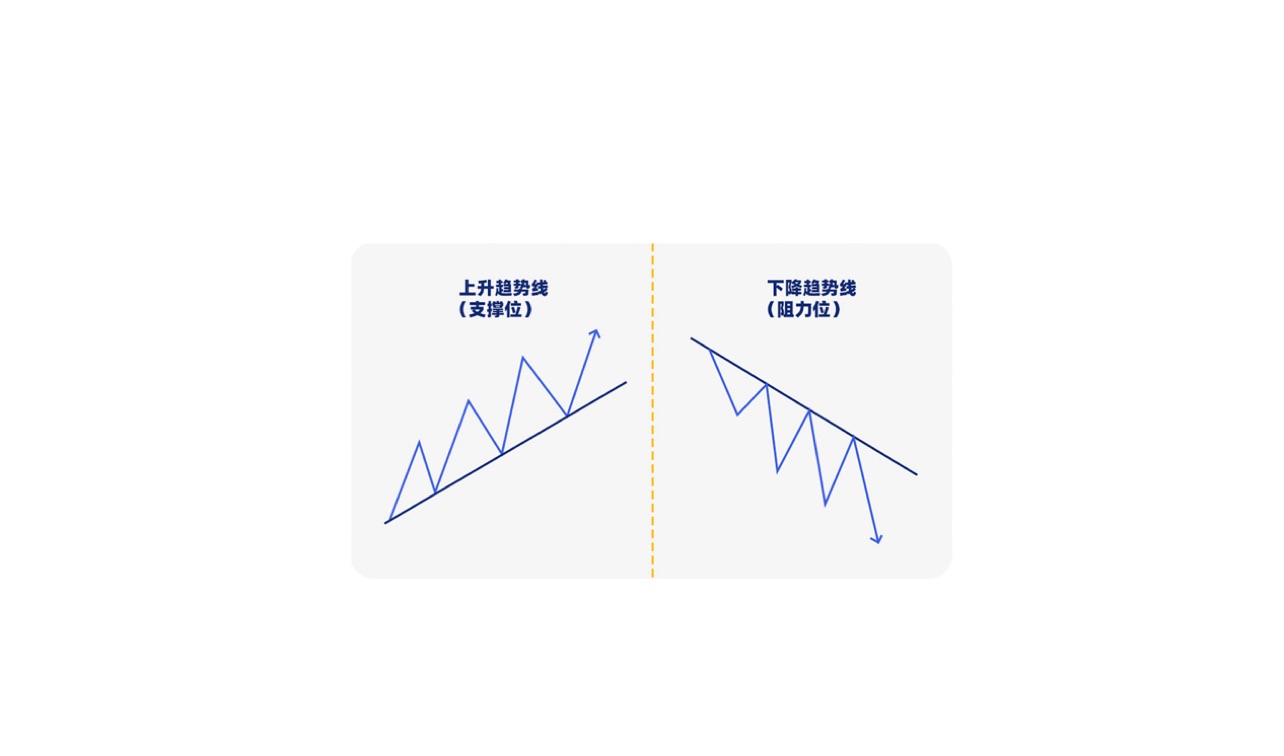
If one does not want to perform complex calculations, drawing trend lines is also a simple method for analyzing market trends. In an uptrend, there will be continuously rising local lows (Higher Lows); drawing a line connecting two or more local lows forms an ascending trend line, and prices may continue to rise until they break below this trend line. Conversely, in a downtrend, there will be continuously falling local highs (Lower Highs); connecting two or more local highs can draw a descending trend line, and prices may continue to fall until they break above this trend line.
Limitations of Technical Analysis
Despite the speed and convenience of using technical analysis, there are still some limitations that require attention. First, it is important to understand that technical analysis is merely a tool; the interpretation of market trends is still dependent on the user. Therefore, the results derived from technical analysis are often subjective, mixed with personal positions and biases. The same technical indicators analyzed by different individuals may yield two completely different views. Conversely, technical analysis can also create a self-fulfilling prophecy. When many market participants use the same methods for trading, it can cause prices to converge towards collective expectations, but this has no relation to the correctness of technical analysis theory. Additionally, technical analysis overlooks many elements of fundamental analysis, and its models are based solely on historical data statistics, unable to exclude the possibility of exceptional events occurring. Regardless of how thorough the analysis is, there will still be blind spots, and it cannot guarantee absolute certainty. When using technical analysis, one must understand its limitations to avoid being misled by the tool and incurring losses.
Conclusion
From traditional finance to cryptocurrency, from short-term speculation to long-term value investment, how to profit in the ever-changing financial market has always been a topic of concern. Although technical analysis is not as objective and comprehensive as fundamental analysis, and its arguments regarding strong market efficiency and the future being an extension of history have often been criticized, its cross-disciplinary versatility and convenience in information interpretation have kept this discipline relevant, and it is still used by many traders and investment institutions today. Viewing technical analysis as a supplementary tool alongside fundamental analysis is a more appropriate approach to enhancing asset management performance and financial results.
Follow the public account - Bit Bear

The content of this article is exclusively planned and published by Bit Bear (public account: Bit Bear). For more real-time investment strategies, solutions, spot trading, short, medium, and long-term contract trading techniques, operational skills, and knowledge about candlesticks, you can join Bit Bear for learning and communication. Fans can experience the group for free, with real-time strategy sharing throughout the day!
免责声明:本文章仅代表作者个人观点,不代表本平台的立场和观点。本文章仅供信息分享,不构成对任何人的任何投资建议。用户与作者之间的任何争议,与本平台无关。如网页中刊载的文章或图片涉及侵权,请提供相关的权利证明和身份证明发送邮件到support@aicoin.com,本平台相关工作人员将会进行核查。


