一、趋势线到底是啥?
原理一句话:趋势线就是价格走的“路线图”,帮你一眼看出价格是在爬坡(上涨)、下坡(下跌)还是平着走(横盘)。
上涨趋势线:价格每次跌到某个低点就反弹,把这些低点连成一条斜向上的线,就像楼梯的台阶,越走越高。
下跌趋势线:价格每次涨到某个高点就掉头,把这些高点连成一条斜向下的线,就像下坡路,越走越低。
横盘趋势线:价格在一个“框框”里来回晃,高点连成一条水平线(天花板),低点也连成一条水平线(地板)。
为啥有用?
找到价格可能的“支撑”(跌不动的地方)和“阻力”(涨不动的地方)。
提前看出趋势可能要变(比如跌破上涨线,可能涨不动了)。
二、怎么画趋势线?
口诀:两点成线,三点验证,破了就改。
步骤拆解:
找两个明显的“拐点”:
涨势:找两个价格跌下去又弹起来的低点(比如周一跌到100块反弹,周三跌到110块又反弹)。
跌势:找两个价格涨上去又掉下来的高点(比如周一涨到200块跌了,周四涨到180块又跌了)。
注意:选价格实体部分(K线的主体),别选上下影线(毛刺),那些可能是假动作。
连线:
用交易软件的画线工具,直接连这两个点,斜着向右延长(看未来价格会不会碰到这条线)。
例子:比特币从1万涨到1.2万,中间两次跌到1.05万和1.1万都反弹,连这两点就是上涨趋势线。
验证:
价格第三次碰到这条线又弹回去,说明这条线靠谱。
反面例子:如果画完线,价格直接穿过去不回头,说明画错了,得重新找点。
三、怎么用趋势线赚钱?
核心逻辑:线上买,线下卖,突破反向跟。
具体操作:
上涨趋势线做多:
买点:价格跌到趋势线附近,出现止跌信号(比如长下影线、阳线反弹)。
止损:跌破趋势线(比如收盘价在线下),马上止损。
止盈:等涨到前高压力位,或者趋势线变陡了(涨太快可能回调)。
下跌趋势线做空:
卖点:价格涨到趋势线附近,出现滞涨信号(比如长上影线、阴线下跌)。
止损:涨破趋势线(收盘价在线以上),立刻平仓。
止盈:等跌到前低支撑位,或者趋势线加速下跌(可能反弹)。
突破趋势线反向操作:
例子:如果比特币一直沿着上涨趋势线走,某天突然跌破这条线且没弹回去,可能趋势反转,可以考虑做空。
注意:假突破很多!一定要等收盘价确认,或者回踩趋势线再行动(比如跌破后反弹到趋势线又跌下去)。
四、合约交易特别注意!
杠杆别开满:
趋势线不是100%准,尤其合约市场波动大,根据保证金选择合适的杠杆就行,避免一次假突破就爆仓。
看大周期更稳:
1小时图、4小时图的趋势线比5分钟图靠谱(短周期容易被主力画线骗人)。
结合简单指标:
MACD:趋势线附近如果MACD金叉(上涨)或死叉(下跌),信号更可靠。
成交量:突破趋势线时放量,可能是真突破;缩量突破,大概率是假动作。
别死扛:
如果趋势线被跌破/涨破,别幻想“一定会回来”,先止损,等市场明朗再说。
五、举个实际例子
场景:ETH/USDT 4小时图,上涨趋势。
画线:连接两个低点(2000和2100),画一条斜向上的线。
买点:第三次跌到2200附近(趋势线位置),出现阳线反弹,买入。
止损:设在趋势线下方的2180。
止盈:前高2500,或者趋势线加速上冲时分批卖。
结果:如果ETH涨到2500后跌破趋势线,平仓获利;如果跌破2200止损,亏2%。
总结
趋势线就是价格的“马路牙子”,涨跌顺着这条线走,破了就可能转向。
画线要简单:两点连线,三点验证,别搞复杂。
操作要果断:线上买,线下跑,别和趋势对着干。
合约要小心:杠杆低一点,多看大周期,别贪心。
练个几天,你也能一眼看出价格的“路线图”!
【4.15价格趋势分析】
大饼小时级别K线显示价格在84000至86000区间内波动,在布林带上下轨内形成了一个相对稳定的震荡区域,表明市场存在一定的抛压和买盘支撑,短期趋势明朗震荡为主,高抛低吸。以太操作可以同步大饼。
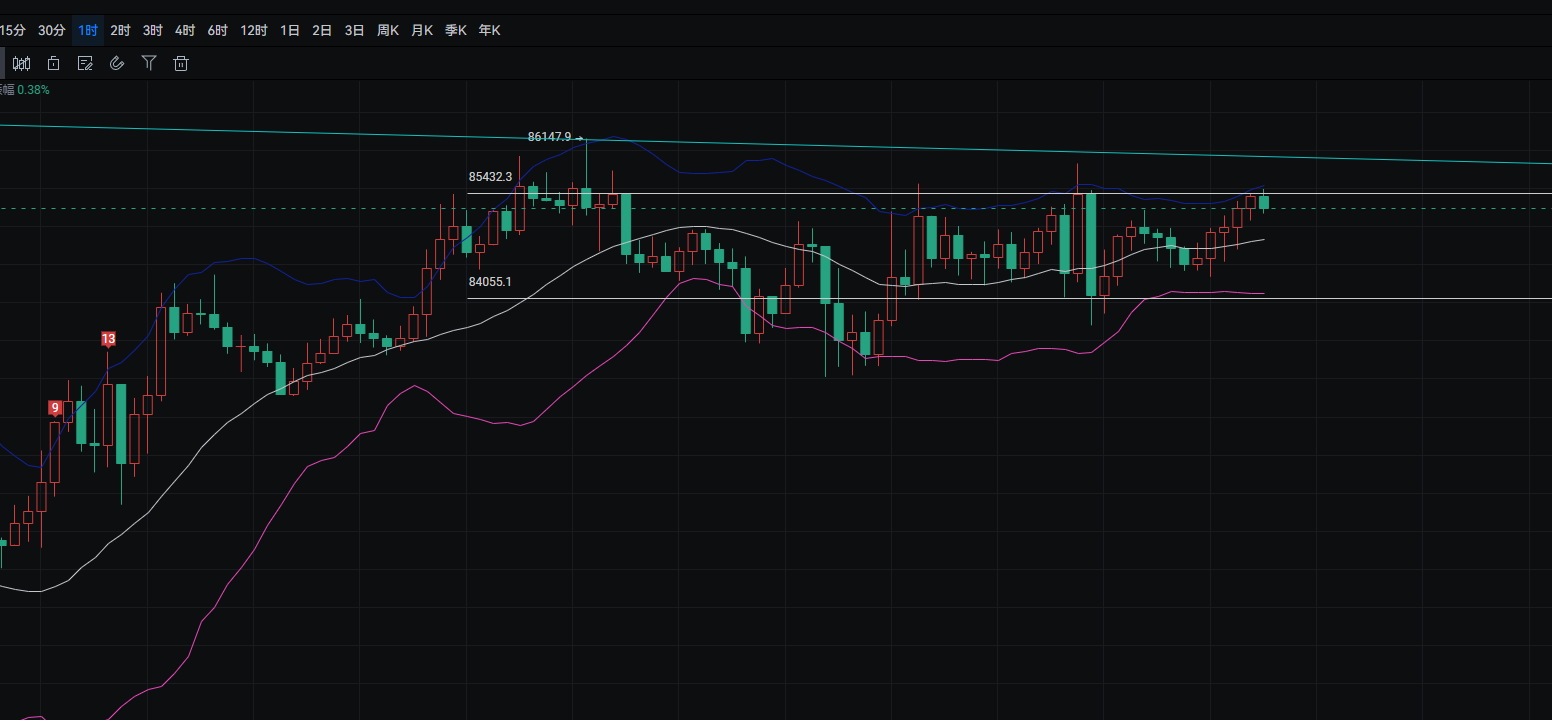
大饼操作策略
8.5-8.6分批空,止损8.65,目标8.35-8.28;
8.25-8.35分批多,止损8.2,目标8.5-8.65。
以太操作策略
1635-1670分批空,止损1690,目标1580-1530
1540-1575分批多,止损1520,目标1630-1660
【以上分析及策略仅供参考 风险请自担,文章审核发布或有滞后策略不具备及时性,具体操作以比特大熊实时策略为准】

(注:📣 由于公开平台的信息时效性和深度有限,市场瞬息万变,关键拐点、精准操作策略、突发风险提示,等内容需在(公众号——比特大熊)第一时间同步。在这里,你能获得: 实时策略推送,深度分析支持、互动答疑,针对个人持仓提供风险预警和优化建议。 🚨 谨记:市场永远奖励行动更快、信息更准的人!做少数派的赢家。)
免责声明:本文章仅代表作者个人观点,不代表本平台的立场和观点。本文章仅供信息分享,不构成对任何人的任何投资建议。用户与作者之间的任何争议,与本平台无关。如网页中刊载的文章或图片涉及侵权,请提供相关的权利证明和身份证明发送邮件到support@aicoin.com,本平台相关工作人员将会进行核查。


