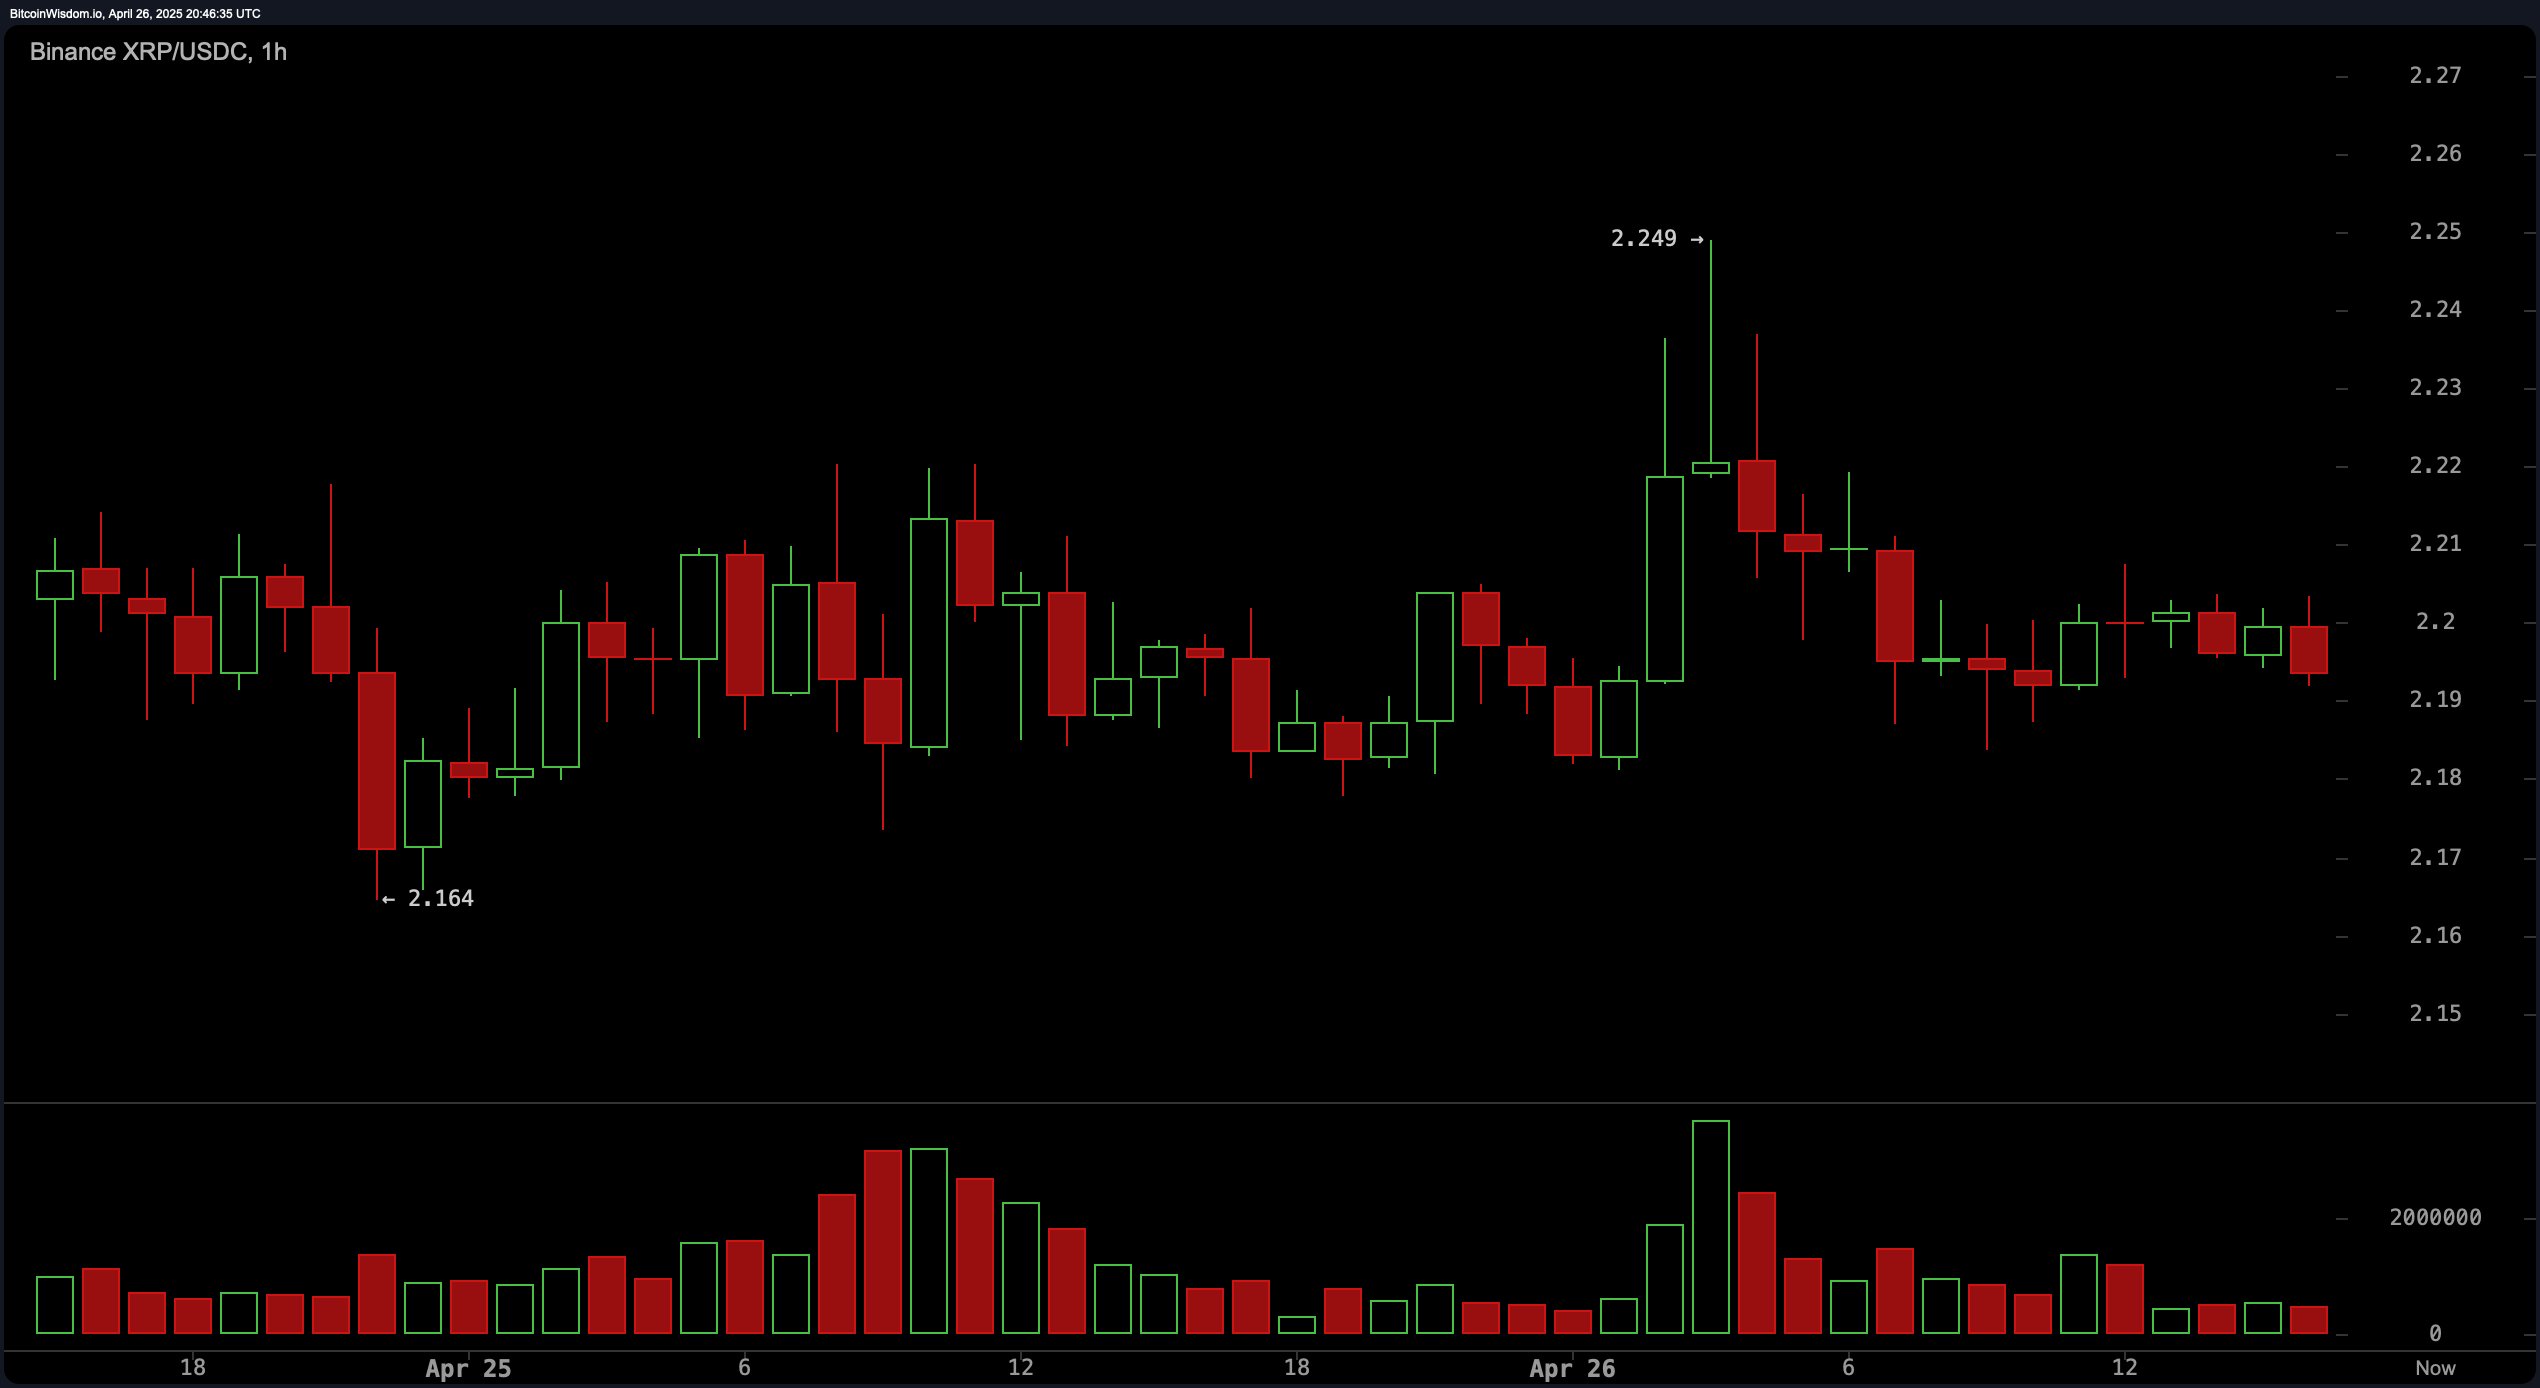
The one-hour chart for XRP on April 26, 2025, reveals a range-bound trend with slight tightening, indicating a brewing setup for a potential breakout. Key short-term support lies at the $2.16 to $2.17 level, where buying interest has consistently emerged. Volume is showing modest increases as price action gravitates toward the upper and lower extremes of the range, suggesting accumulating pressure.

XRP/USDC via Binance 1H chart on April 26, 2025.
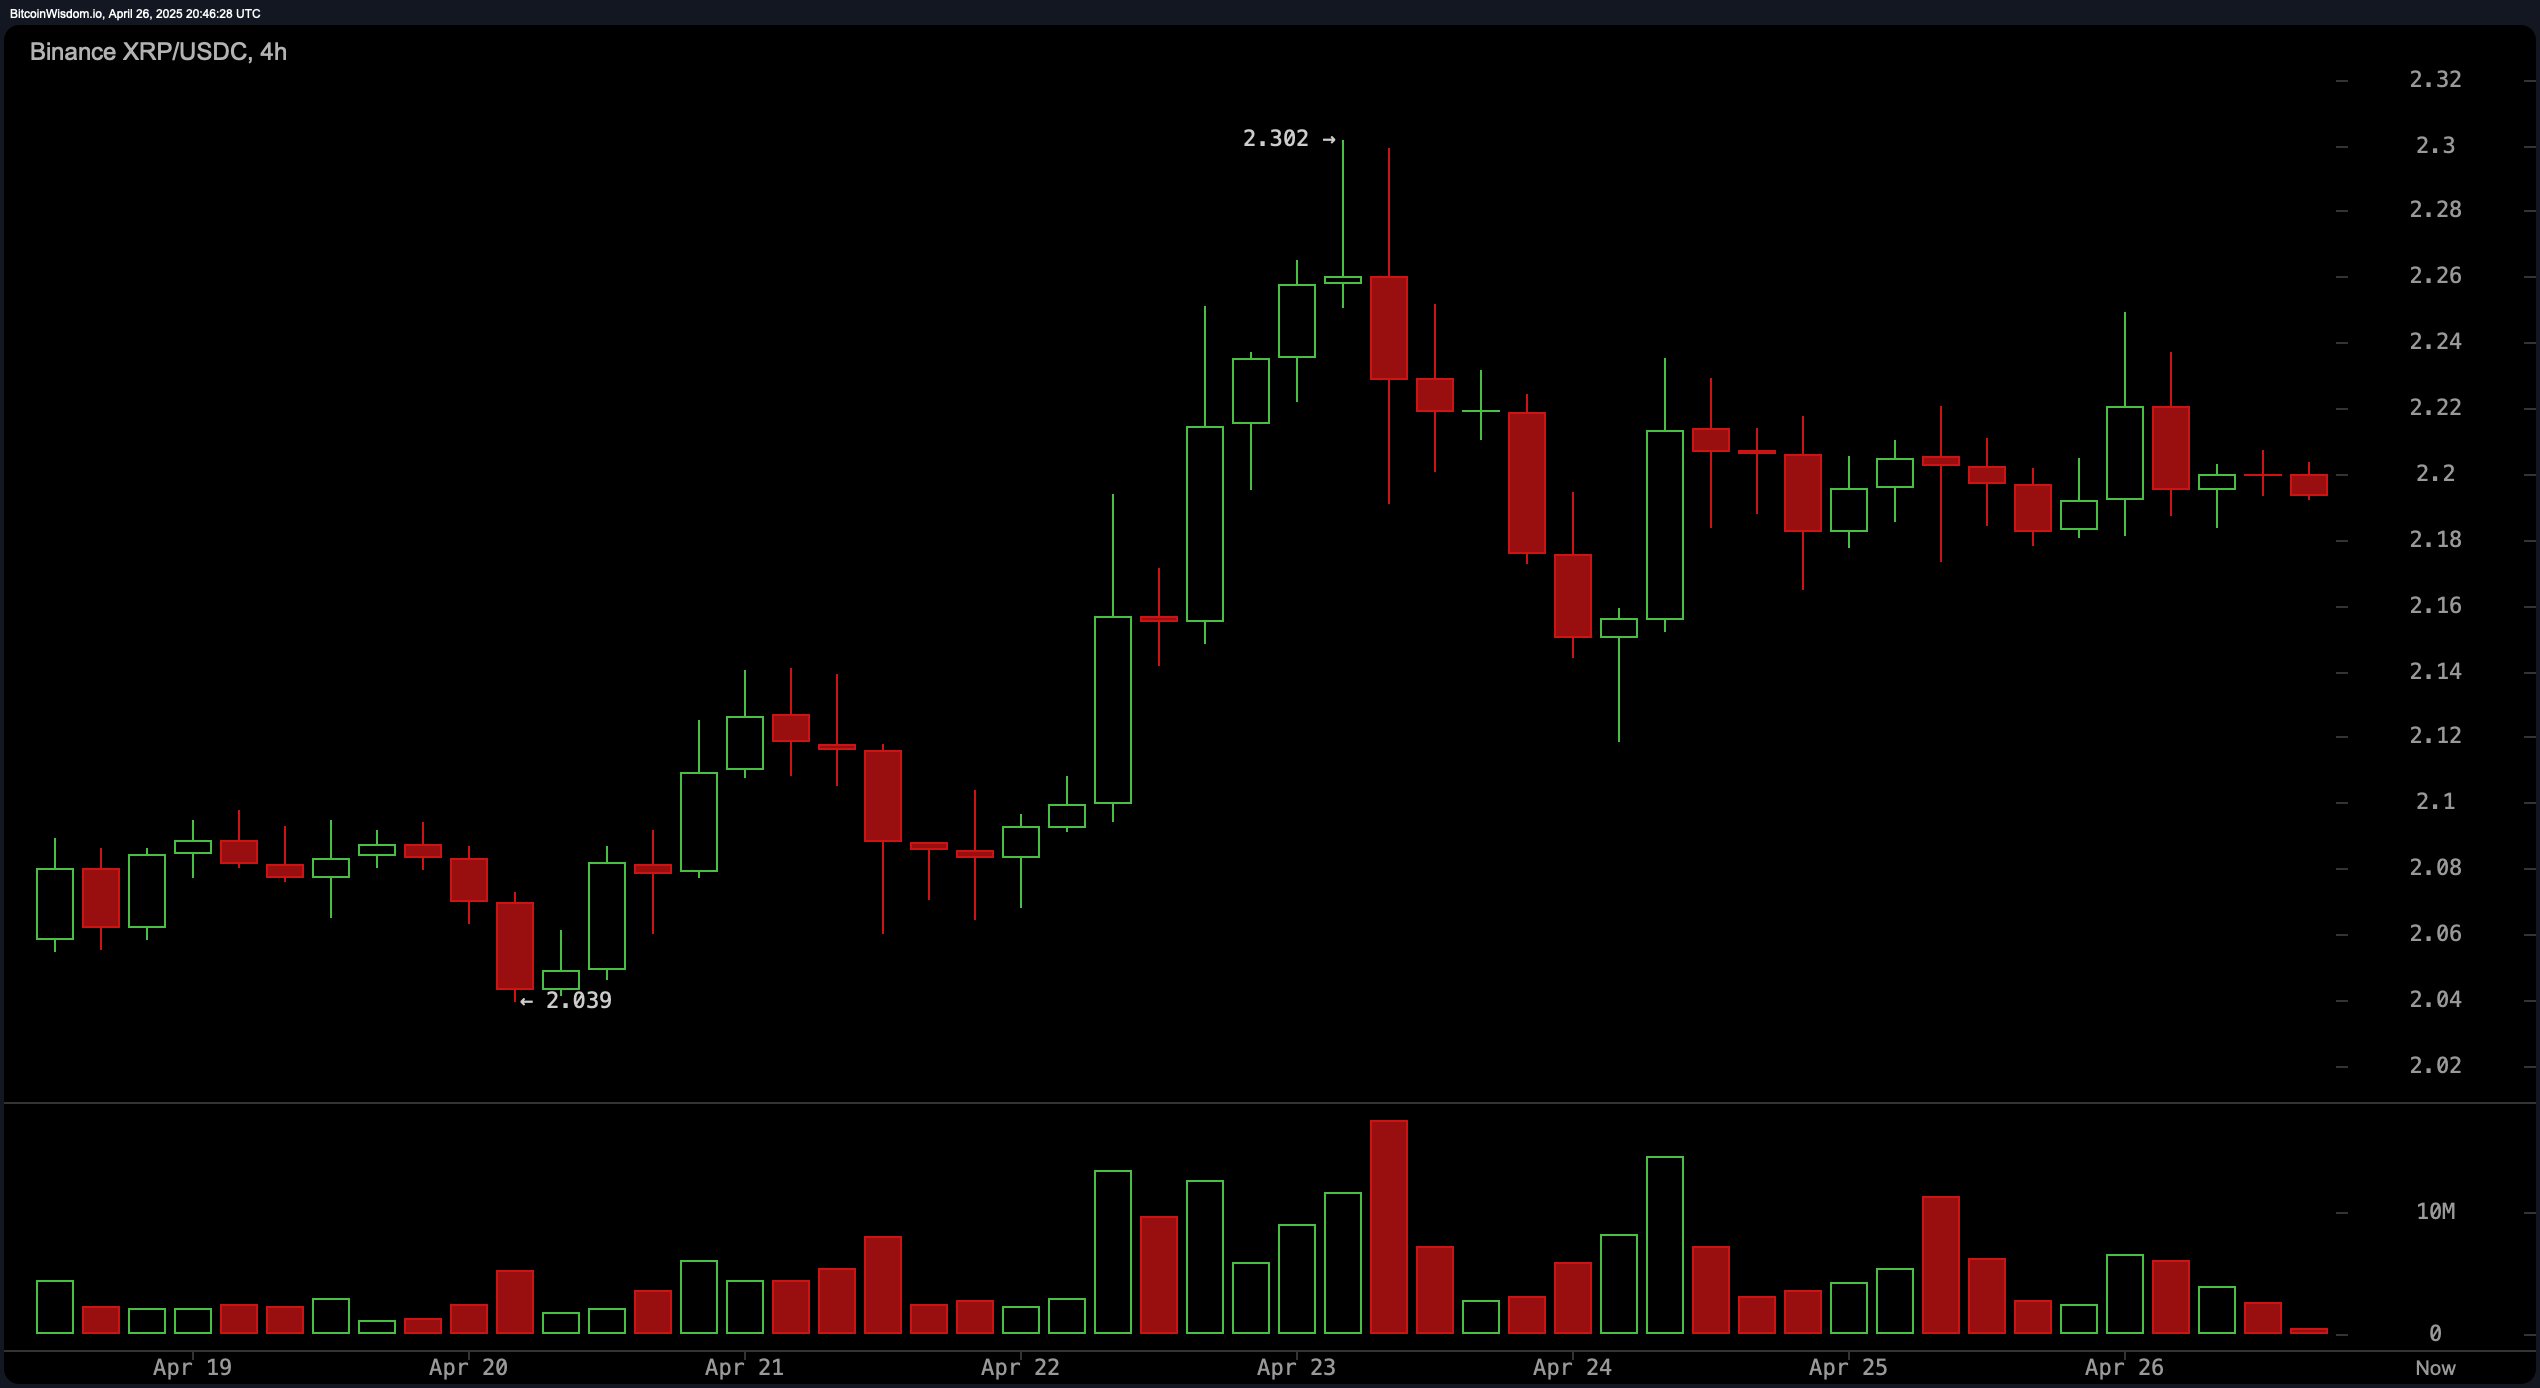
Turning to the four-hour chart, XRP continues to consolidate within a well-defined range, presenting a clearer picture of the prevailing indecision. Resistance at $2.30 remains firm, marked by a previous wick rejection, while support is solidly established near $2.08 to $2.10. Volume analysis shows notable spikes during attempts to breach $2.30, indicating significant seller presence. Ideal long entries could be considered following pullbacks to the $2.10 region, accompanied by bullish candlestick confirmations. Should XRP successfully close above $2.30 on strong volume, a momentum-driven advance toward the $2.40 to $2.50 resistance zone could quickly materialize.

XRP/USDC via Binance 4H chart on April 26, 2025.
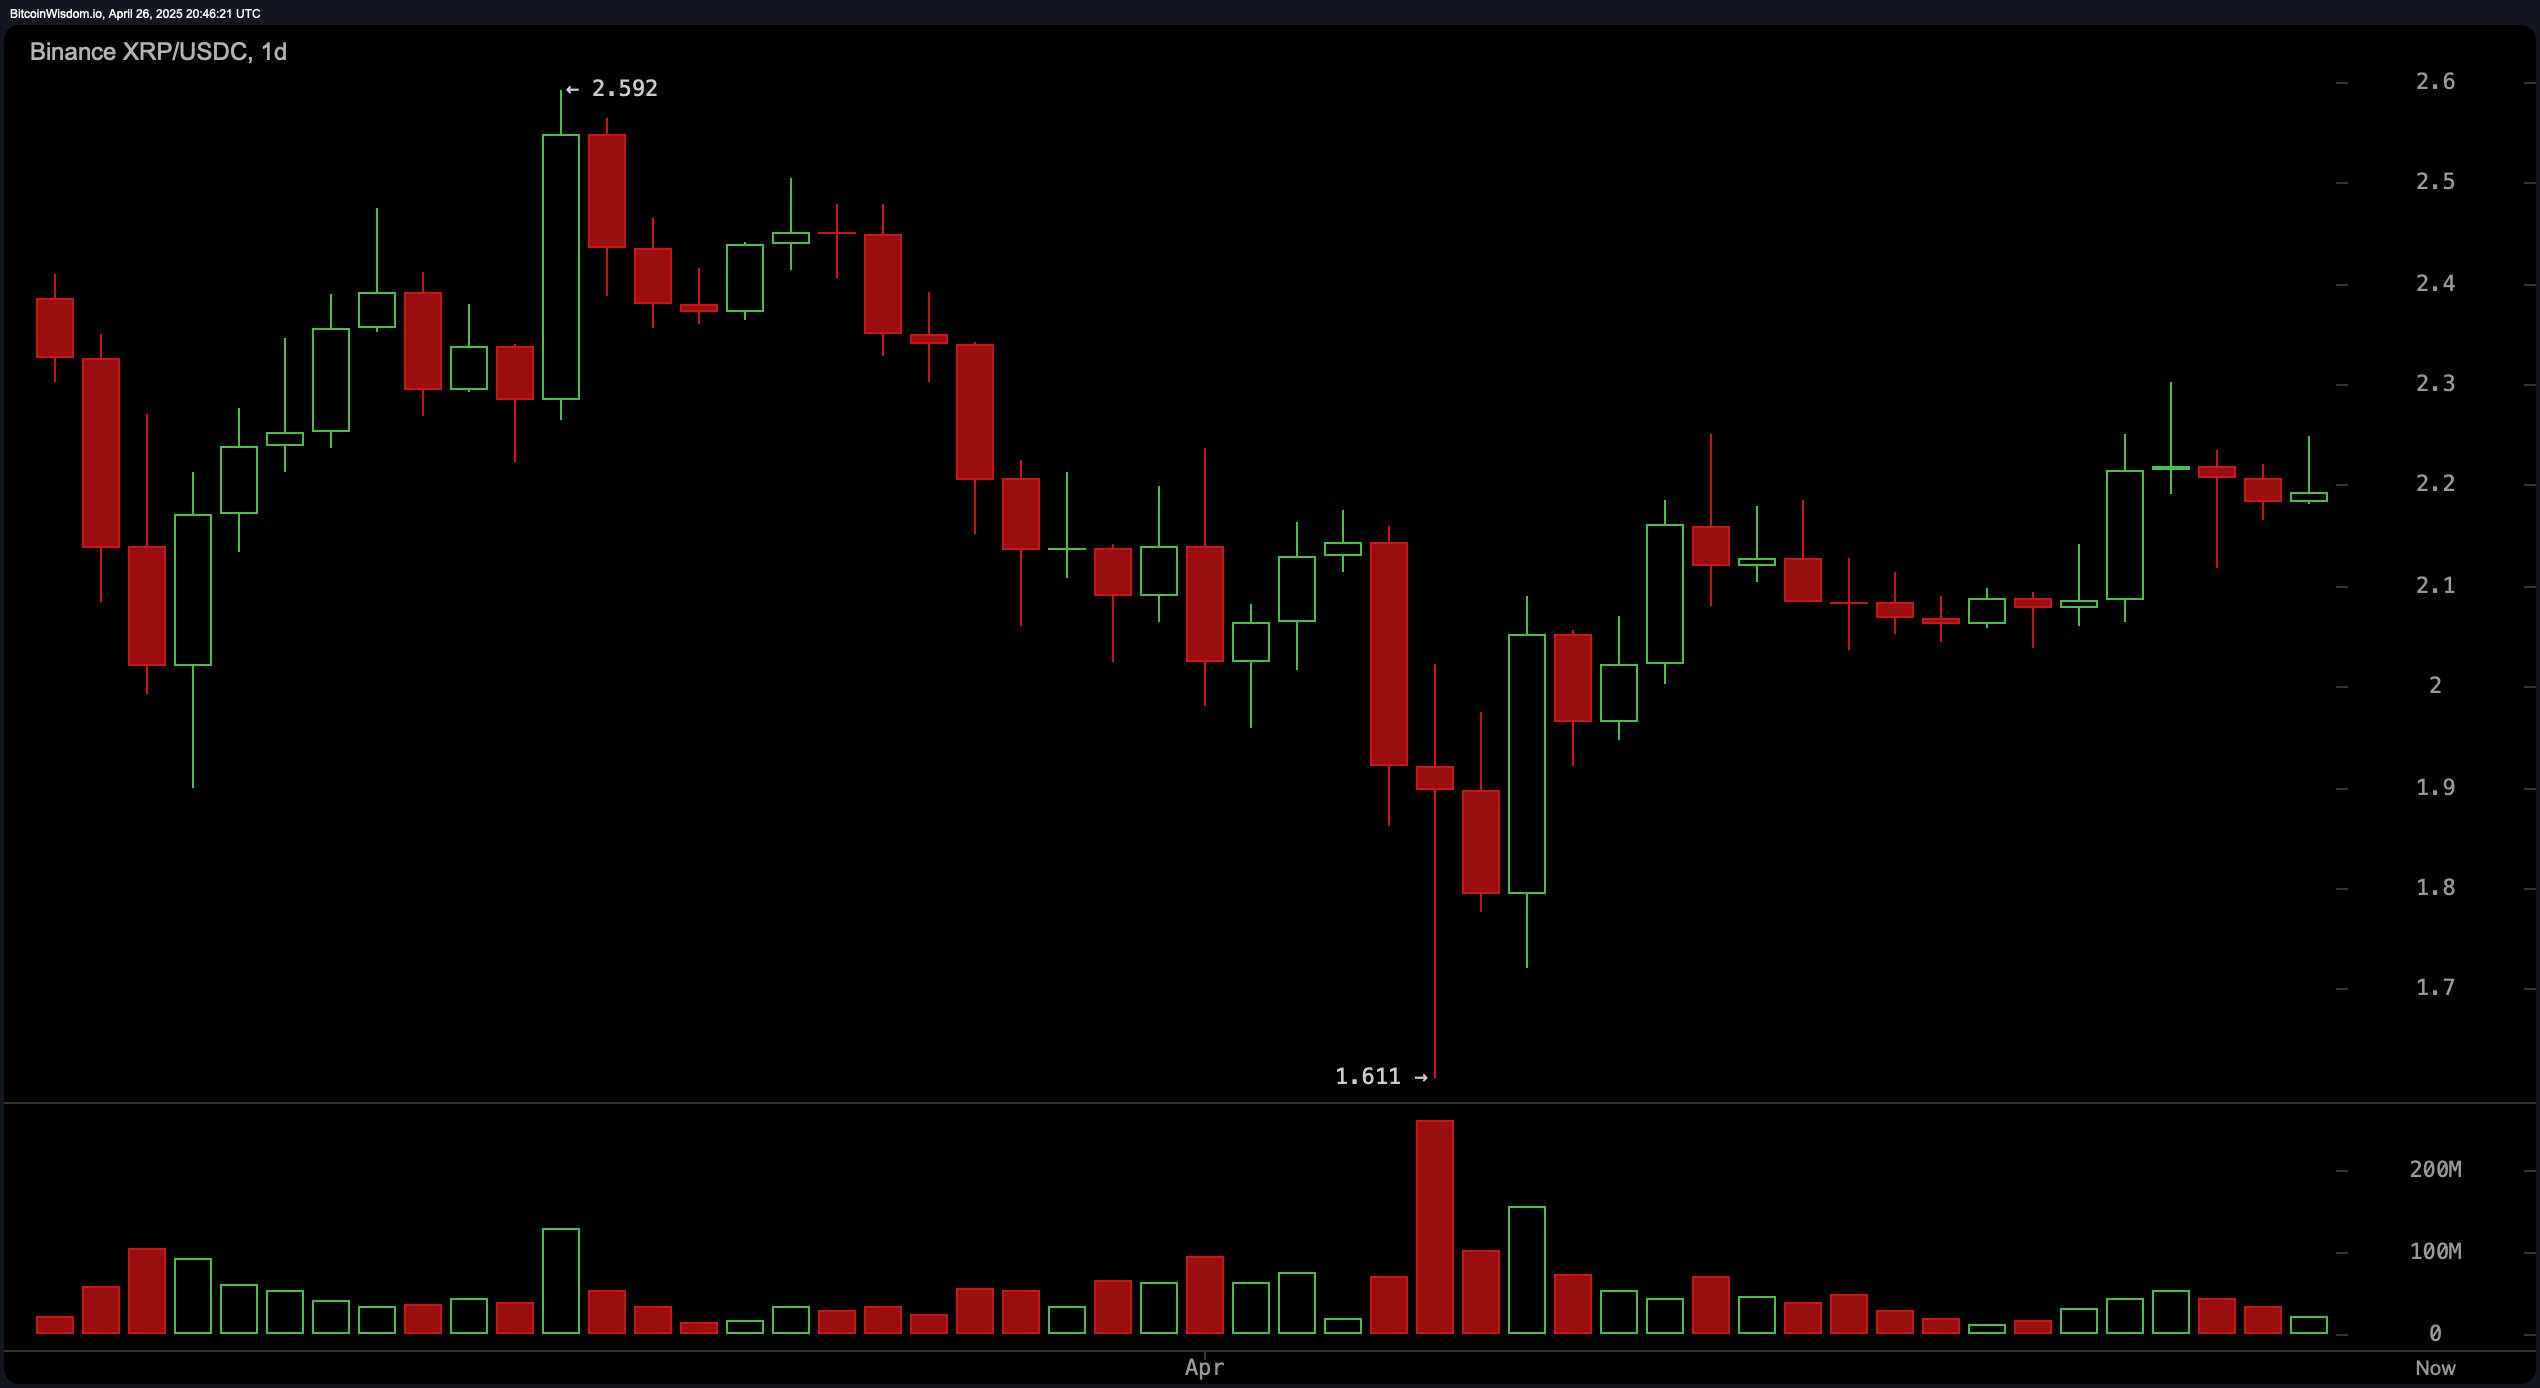
The daily chart reflects the broader market sentiment, with XRP recovering from a sharp decline that saw it fall from $2.59 to a low of $1.61 before stabilizing. The price has now entered a consolidation phase between $2.10 and $2.30, underscored by significantly lower trading volume compared to the selling climax. This phase of low volatility and reduced participation often precedes major moves, either bullish or bearish.

XRP/USDC via Binance 1D chart on April 26, 2025.
Oscillator readings as of April 26, offer a neutral to slightly bullish bias. The relative strength index (RSI) registers at 54.02904, indicating a balanced state between buying and selling pressures. The Stochastic shows a reading of 64.39813, and the commodity channel index (CCI) (20) measures 105.52312, both signaling neutral momentum. Likewise, the average directional index (ADX) stands at 15.09827, suggesting a weak trend environment, while the Awesome oscillator posts a marginally positive value of 0.06920, further confirming a lack of clear directional bias. Notably, the momentum oscillator and the moving average convergence divergence (MACD) both deliver buy signals, hinting at an underlying bullish inclination despite the general consolidation.
Moving averages present a mixed but cautiously optimistic outlook. The exponential moving average (EMA-10) at $2.15483 and the simple moving average (SMA-10) at $2.13952 both support a buy signal, along with the exponential moving average (EMA-20) and simple moving average (SMA-20) at $2.13589 and 2.08483, respectively. Further support comes from the exponential moving average (EMA-30) and simple moving average (SMA-30), suggesting continued bullish alignment. However, the exponential moving average (EMA-50) at $2.19775 and the exponential moving average (EMA-100) at $2.21731 issue sell signals, highlighting the challenges XRP faces in overcoming medium-term resistance. Long-term sentiment remains positive, as the exponential moving average (EMA-200) at $1.97460 and simple moving average (SMA-200) at $1.99060 maintain a firm buy outlook, bolstering expectations for future price recovery.
Bull Verdict:
XRP’s consolidation at higher support levels, combined with buy signals from short-term moving averages and positive momentum indicators, suggests a bullish breakout could be imminent. A confirmed push above $2.30 with strong volume would likely propel XRP toward the $2.40 to $2.50 resistance zone, reinforcing the potential for continued upside momentum.
Bear Verdict:
Despite signs of recovery, XRP’s failure to decisively break resistance levels and mixed signals from mid-term moving averages warn of vulnerability. A breakdown below $2.16 could trigger accelerated selling pressure, potentially dragging the price back toward the $2.05 to $2.00 support zone, and putting the recent recovery at risk.
免责声明:本文章仅代表作者个人观点,不代表本平台的立场和观点。本文章仅供信息分享,不构成对任何人的任何投资建议。用户与作者之间的任何争议,与本平台无关。如网页中刊载的文章或图片涉及侵权,请提供相关的权利证明和身份证明发送邮件到support@aicoin.com,本平台相关工作人员将会进行核查。


