Given that price action and technical indicators are lining up for a possible explosive move, Bitcoin appears to be getting ready for a second significant rally. Bitcoin is now consolidating above $94,000 a level not seen in weeks, after recently breaking through several significant resistance levels such as the 50-day and 100-day exponential moving averages.
The momentum that underpins this move is its most remarkable feature. Strong market interest and institutional participation were indicated by the breakout's clear increase in trading volume. Above all major moving averages, Bitcoin was able to maintain this momentum, turning previous resistance levels into possible support areas. There is still potential for upward movement, as indicated by the current RSI (Relative Strength Index), which is high but not yet in the overbought zone.
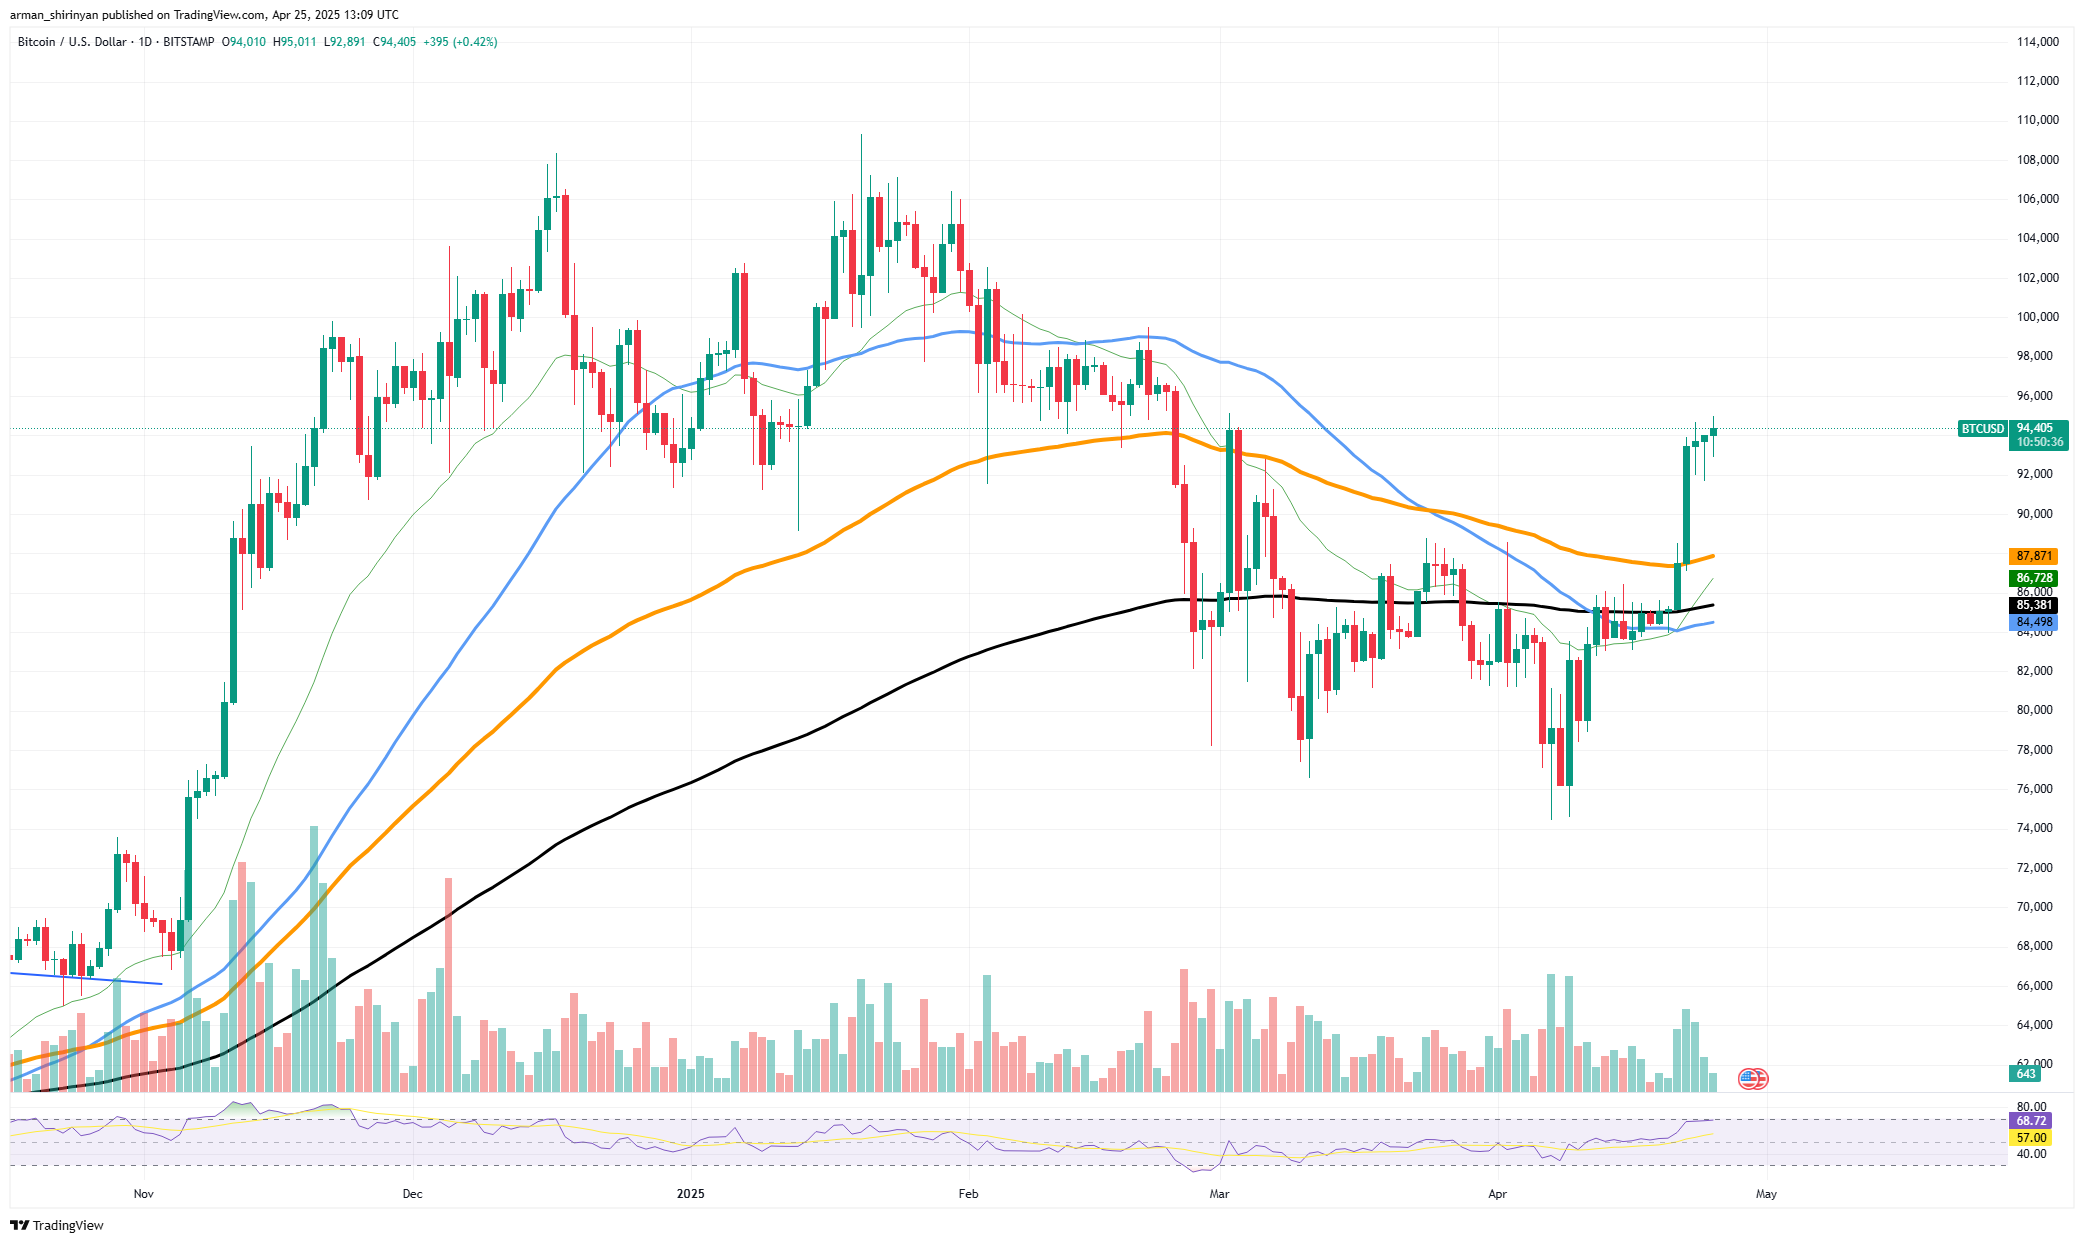
BTC/USDT Chart by TradingView
Given the cleared technical environment and low short-term overhead resistance, Bitcoin may soon begin its second wave, a continuation rally that frequently follows such powerful breakouts. In the past, a secondary bullish surge usually occurred days or weeks after Bitcoin broke above consolidation ranges with volume.
HOT Stories Bitcoin's (BTC) Second Skyrocketing Incoming? Solana (SOL) to Finally Break Bear Trend, XRP Struggling Too Much New SEC Chair Says Crypto Deserves Clear Rules 'Gold Is Dead, Bitcoin Moves,' Billionaire Tim Draper Says 76 Million RLUSD Tokens Supplied in Just Days on Aave
This narrative is also supported by market sentiment. Conditions are ideal for Bitcoin to continue its gains now that the majority of the fear has subsided and optimism is growing in the larger cryptocurrency space. The next target could be anywhere from $97,000 to $100,000 if Bitcoin keeps support above $94,000. If bullish momentum picks up speed it might even move toward all-time highs earlier than anticipated.
Solana trend nearing end
The long-term bearish trend of Solana may be coming to an end as it approaches a possible breakout. SOL is now just short of the 200-day Exponential Moving Average (EMA), a significant technical milestone that could turn the market sentiment in its favor following weeks of a steady recovery.
SOL has risen past several significant resistance levels. It is currently trading at about $153, battling the important 200 EMA level at $162. Historically, this resistance line has been a barrier that defines a trend. Officially, Solana would leave bear territory and enter a confirmed uptrend if it were to close above it. Additionally, the price structure exhibits a distinct upward trend, signifying steady demand and rising market confidence. It is clear that momentum is increasing.
Related

Fri, 04/25/2025 - 13:34 537,000,000,000,000 Shiba Inu (SHIB) Resistance Approaches
Arman Shirinyan
This rally has seen a steady increase in volume, which has strengthened the upward trend. The fact that the RSI is still high but not yet in overbought territory suggests that more gains could be made without a correction.
Previous consolidation zones may provide slight resistance in the $170-$185 range, which is the next price target if SOL is able to decisively break through the 200 EMA and hold above it. If, on the other hand, this critical level is not broken, there may be a brief retreat back to the $140-$135 range, where the 50 EMA may serve as support.
XRP needs fuel
XRP seems to be in a rut, while the majority of the major cryptocurrencies are riding the wave of a larger market rally. Currently trading at about $2.18, the asset is struggling with the 100-day Exponential Moving Average (EMA) and is clearly displaying signs of weakness at this crucial level. A few hours after briefly rising above the 100 EMA, XRP was unable to sustain its upward momentum and fell back below it.
Related

Fri, 04/25/2025 - 12:14 Bitcoin Trading at 40% Discount per This BTC Indicator: Details
Tomiwabold Olajide
Given the remarkable gains made by assets like Bitcoin Ethereum and Solana — all of which have decisively broken important resistance levels and entered robust recovery phases — this type of price action is concerning. The fact that XRP could not stay above the 100 EMA indicates that there is not any consistent bullish pressure.
Compared to its peers, the asset is not moving with the same conviction. Despite efforts at recovery, volume is still weak and the RSI has flattened, suggesting a stall in momentum rather than a continuation. Technically speaking XRP is still trading in a broad downward channel and has not yet broken out of it. Recurrent failures at the 100 EMA imply that XRP may not be ready to join the bull party just yet despite maintaining support above the 50 EMA.
There is still a high chance of a retracement back toward the $2.00 or even $1.97 level unless there is a significant volume-backed breakout shortly. In the near future, XRP bulls must make a major move. XRP will remain behind in a market that is otherwise flashing green unless there is a clear break above the 100 EMA and consistent price action above that area. It is advisable to exercise caution until then, particularly for traders anticipating rapid catch-up gains.
免责声明:本文章仅代表作者个人观点,不代表本平台的立场和观点。本文章仅供信息分享,不构成对任何人的任何投资建议。用户与作者之间的任何争议,与本平台无关。如网页中刊载的文章或图片涉及侵权,请提供相关的权利证明和身份证明发送邮件到support@aicoin.com,本平台相关工作人员将会进行核查。


