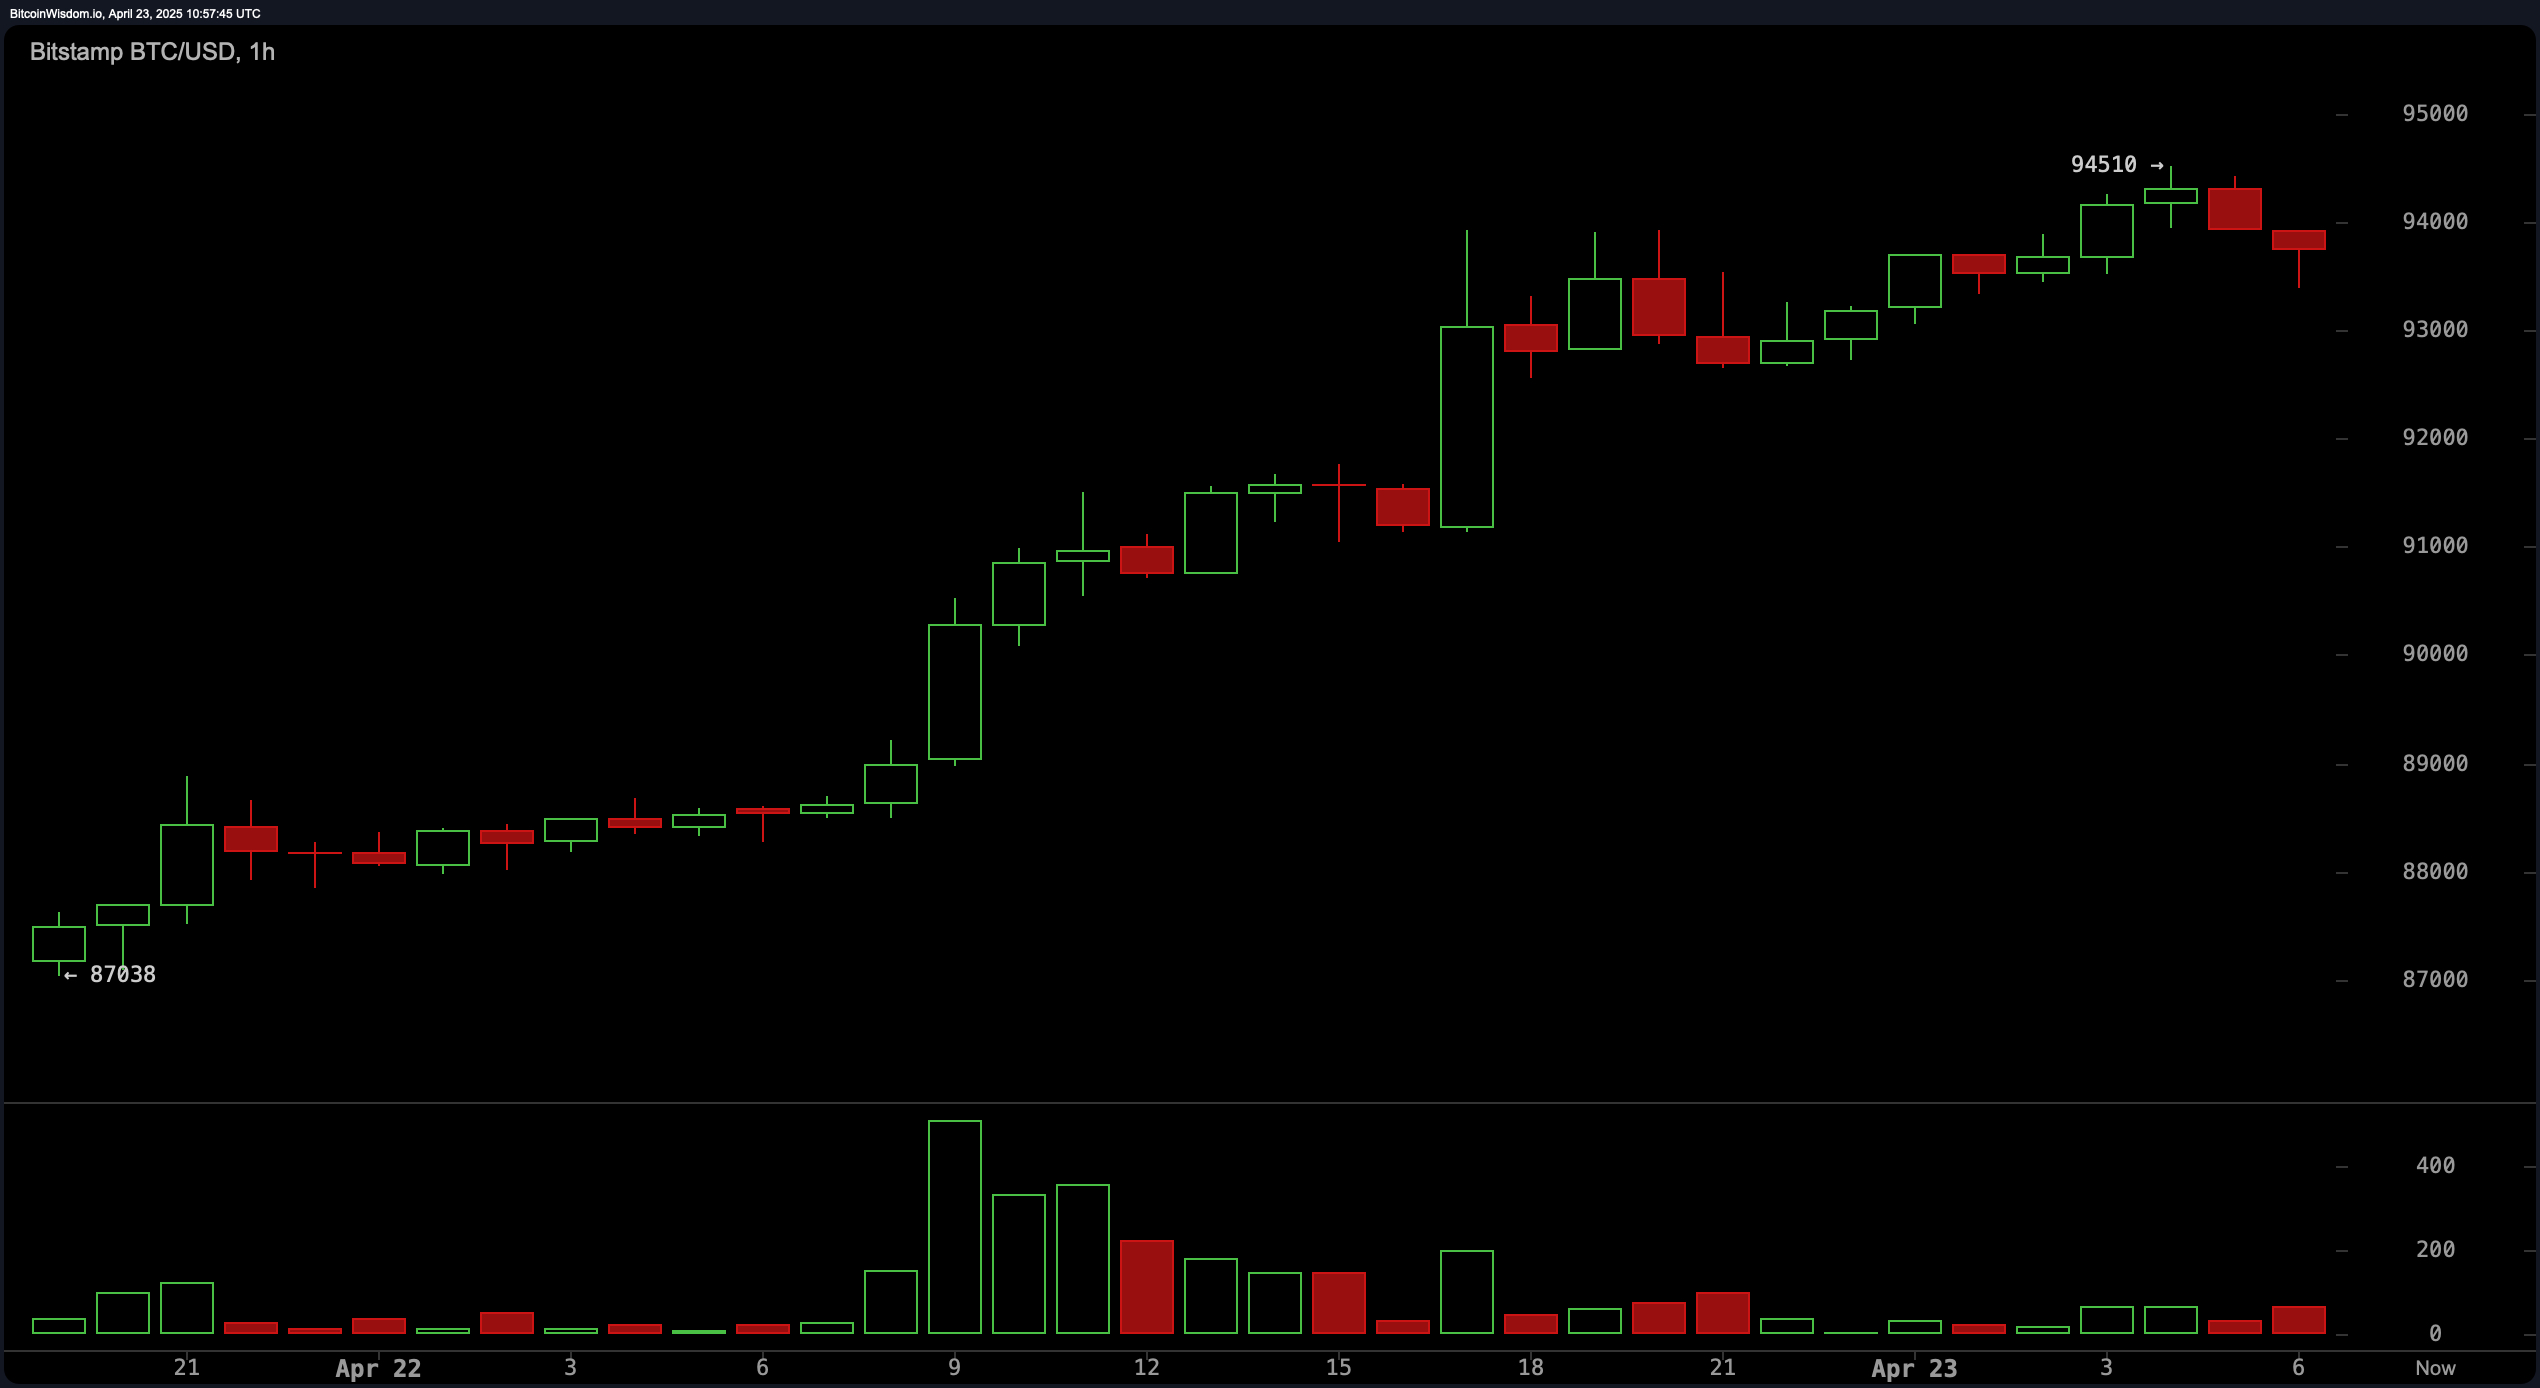
Bitcoin‘s technical indicators from the 1-hour chart suggest a neutral stance, with momentum slightly favoring the bulls. The price has encountered resistance just below $95,000, where doji and small red candles reflect market indecision. A decrease in volume at this level indicates buyer fatigue, suggesting that any upward move may face short-term challenges. Traders might consider entering long positions on retracements toward the $92,500–$93,000 range, though a breakdown below $93,000 could shift the bias to bearish, warranting caution.

BTC/USD 1 hour chart via Bitstamp on April 23, 2025.
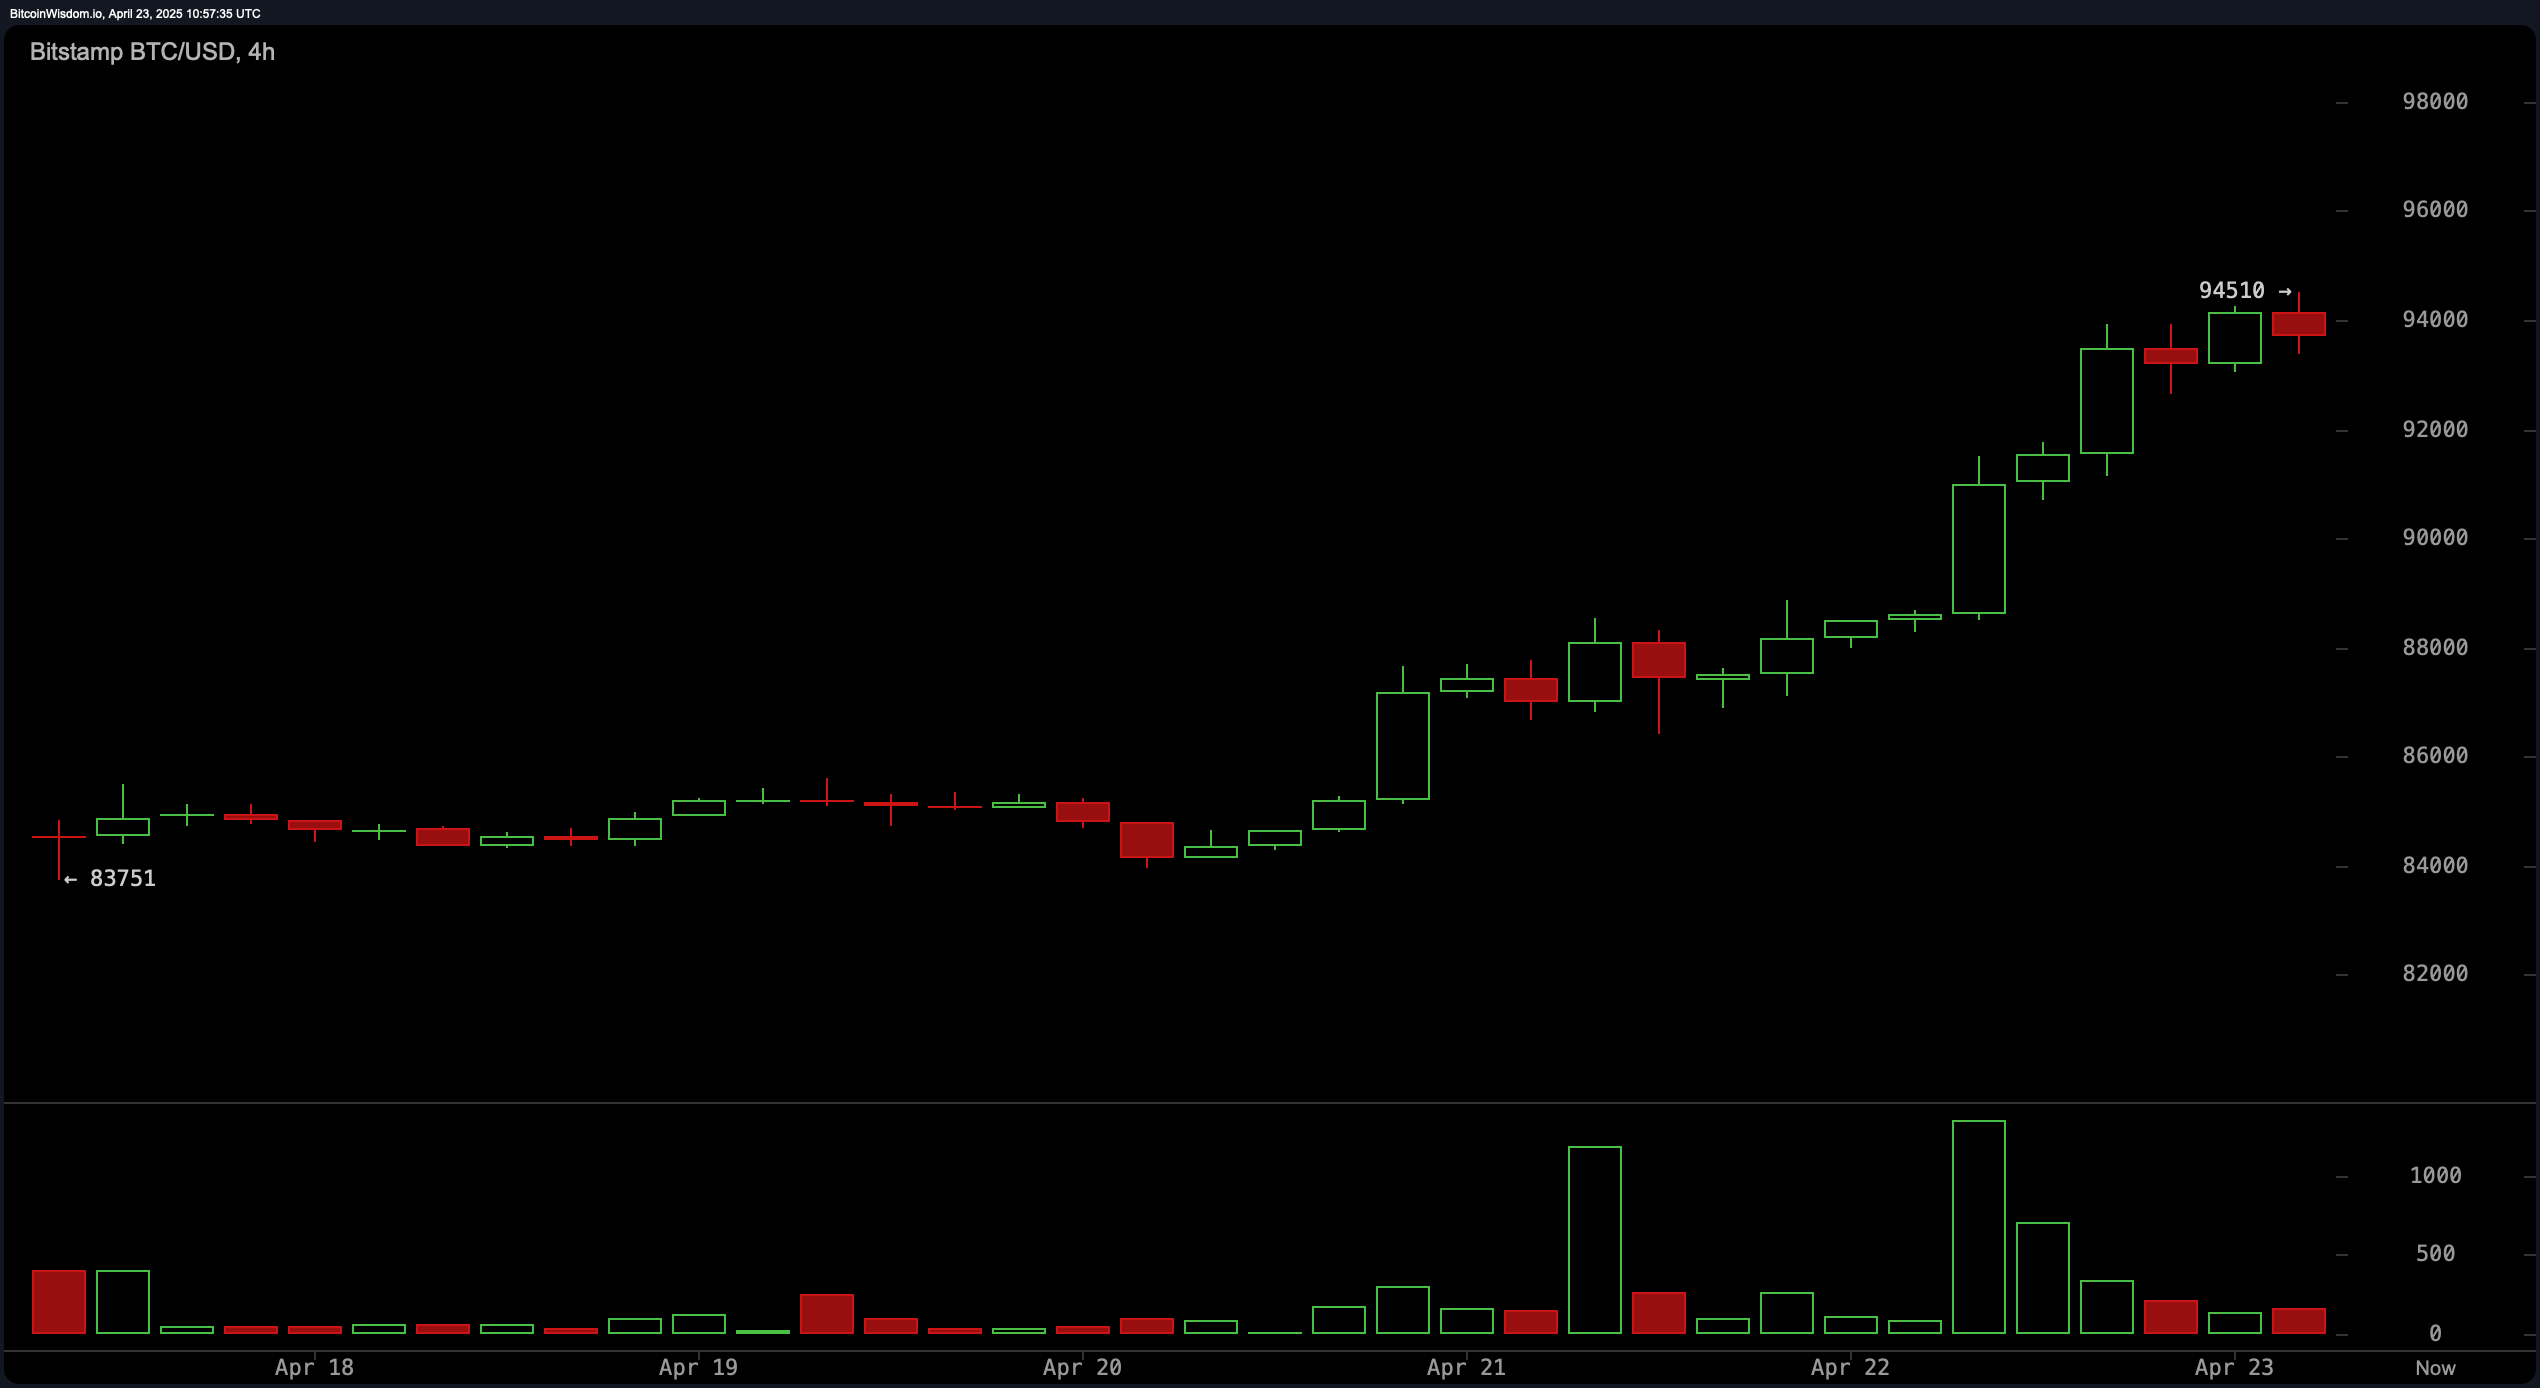
The 4-hour chart presents a more optimistic picture, characterized by a consistent pattern of higher highs and higher lows. This stair-step rally structure is a hallmark of a healthy uptrend. However, a volume climax near $94,000 signals potential profit-taking by institutional players, potentially paving the way for a short-term consolidation. Strategic entries around $91,000–$92,000 are favorable, with exit targets set at $96,000 and $98,000. Caution is advised due to emerging bearish engulfing patterns that may indicate a near-term dip.

BTC/USD 4 hour chart via Bitstamp on April 23, 2025.
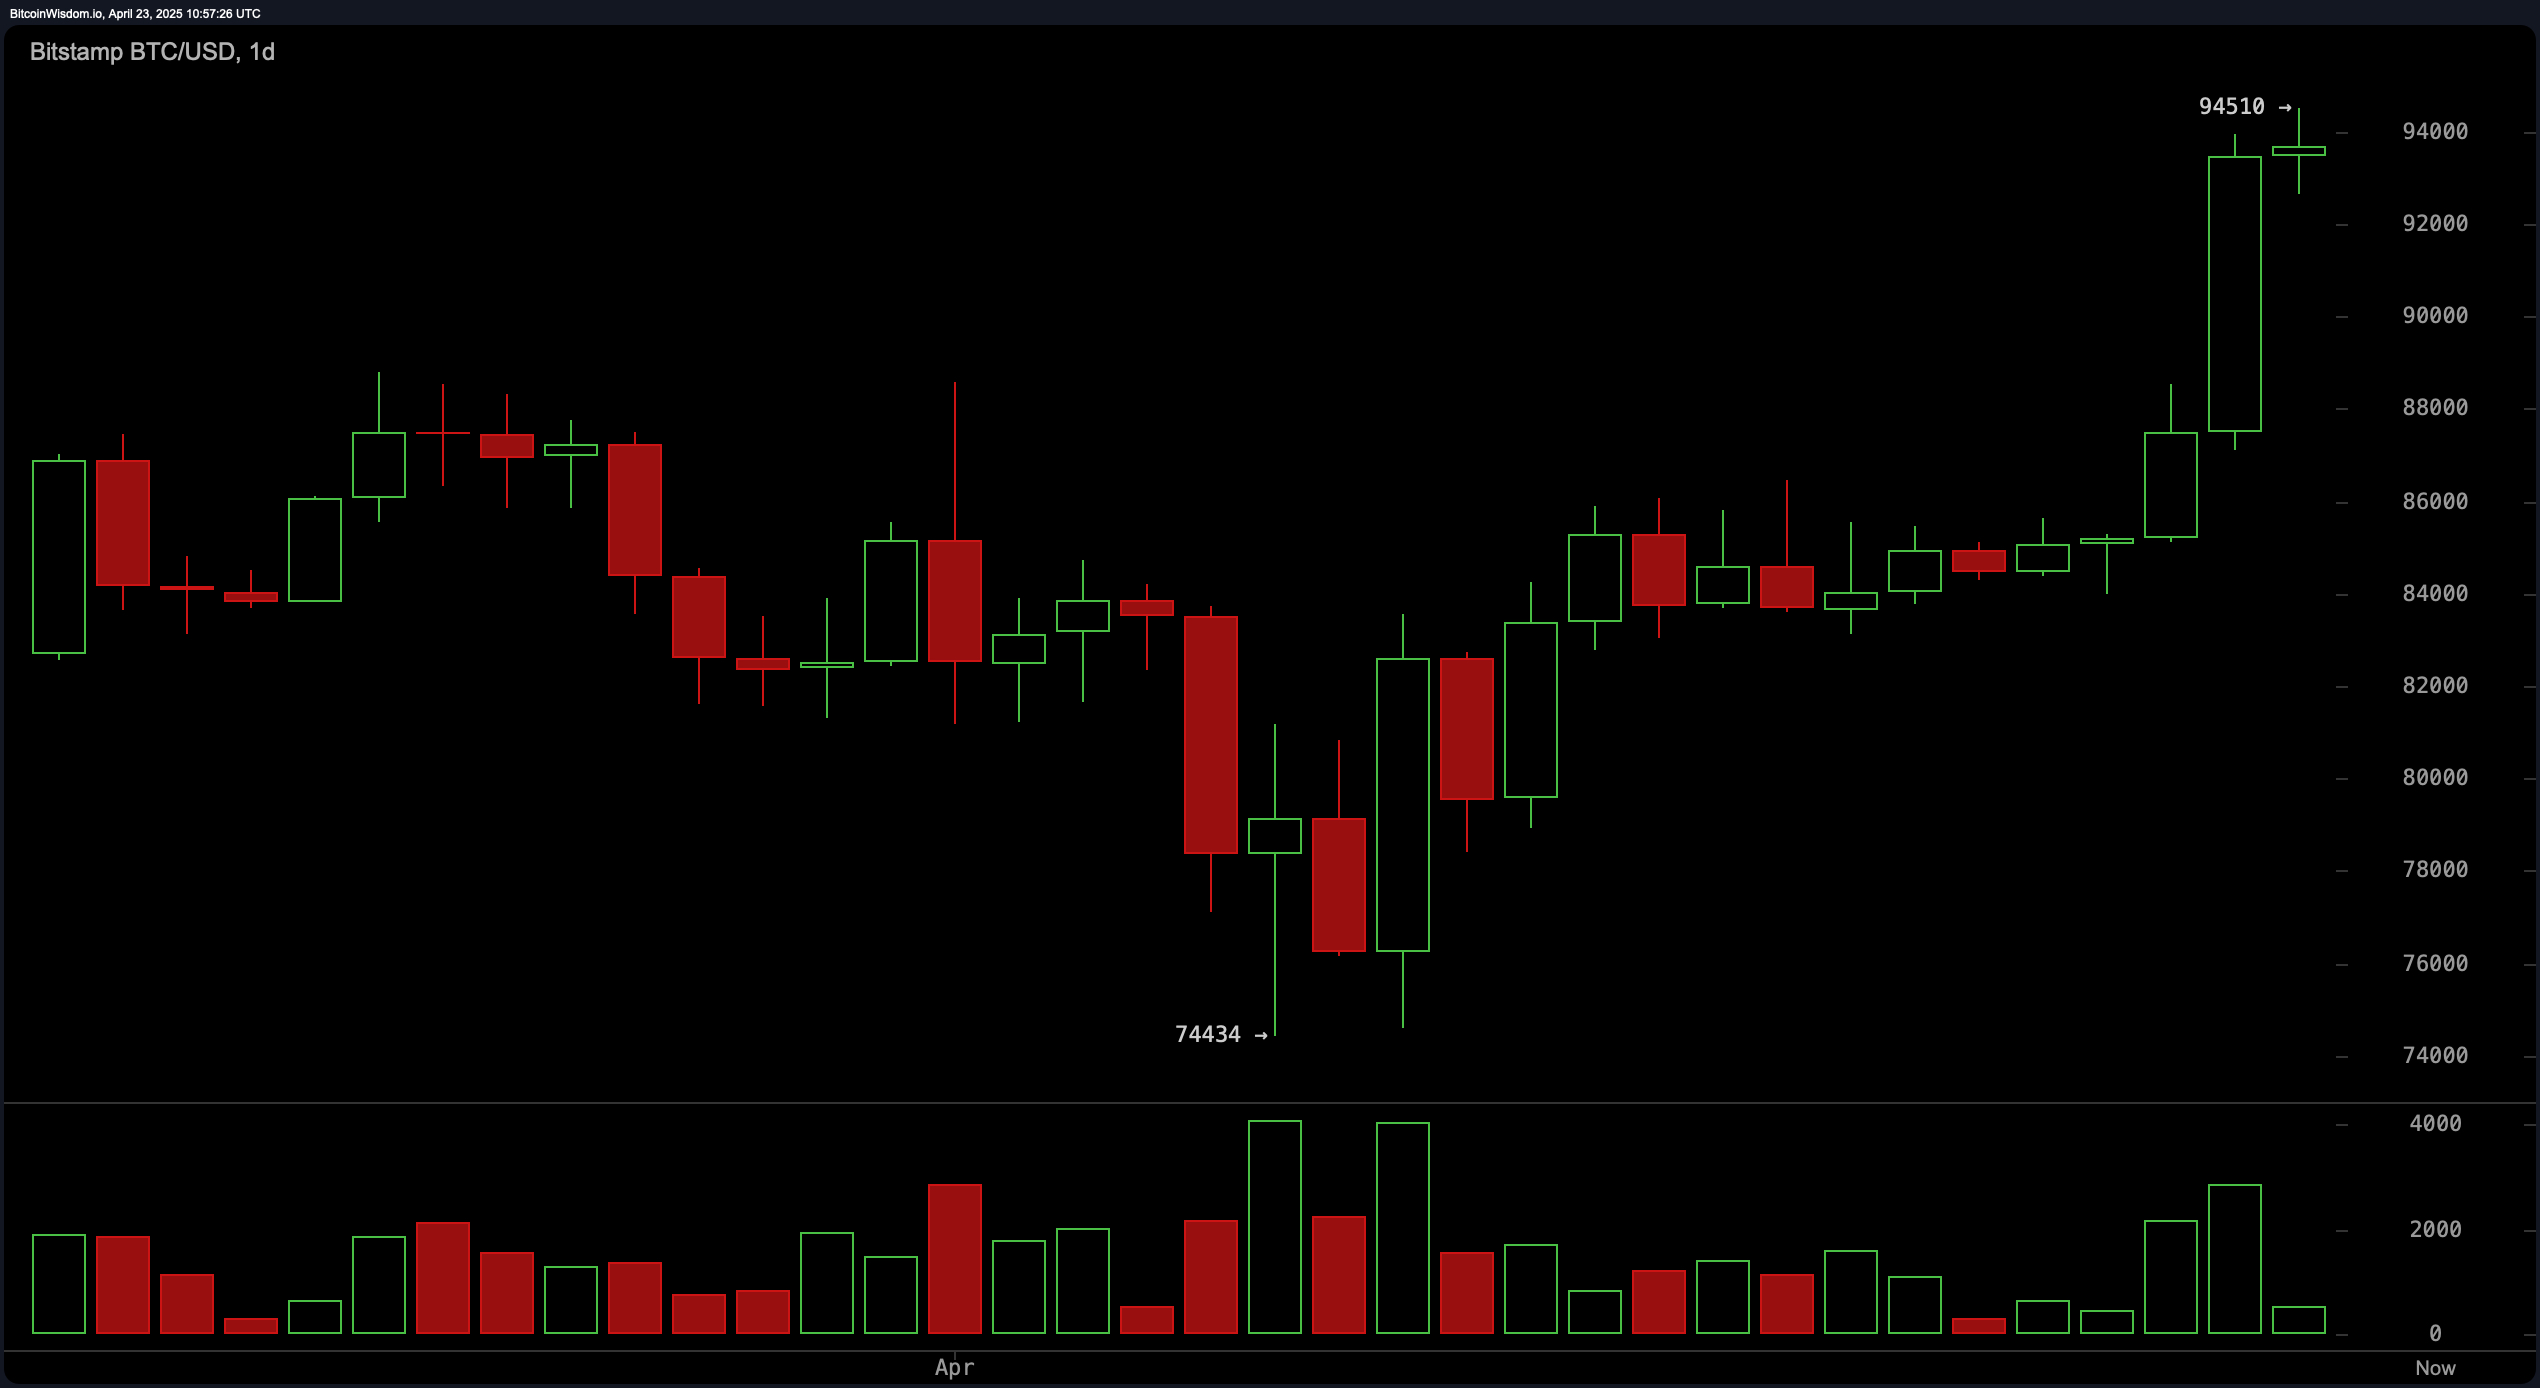
From the daily chart perspective, bitcoin has confirmed a bullish breakout after bottoming out at approximately $74,434. A significant green candle above $90,000, accompanied by a surge in volume, validates this bullish momentum. The ideal entry points near $85,000–$86,000 have passed, positioning the $95,000 level as the next critical resistance. Traders are advised to consider partial profit-taking at this psychological threshold while maintaining a stop-loss around $88,000 to safeguard gains from volatility.

BTC/USD 1 day chart via Bitstamp on April 23, 2025.
Oscillators collectively indicate a neutral market sentiment, with the relative strength index (RSI) at 68, Stochastic at 95, commodity channel index (CCI) at 244, average directional index (ADX) at 19, and the awesome oscillator reading 3,878. Despite this neutrality, the momentum oscillator at 9,978 and the moving average convergence divergence (MACD) at 1,629 flash bullish signals. These mixed cues suggest that while upward momentum exists, it lacks overwhelming conviction, necessitating strategic trade positioning.
All major moving averages affirm a bullish trend, reinforcing a strong support base for bitcoin. The exponential moving average (EMA) and simple moving average (SMA) values across 10, 20, 30, 50, 100, and 200 periods consistently signal positivity. These indicators provide technical support well below the current market price, indicating that any price pullbacks may be temporary and potentially favorable for long-term positions. This alignment of moving averages underlines sustained buyer interest and a potentially extended bullish phase.
Bull Verdict:
Bitcoin is firmly positioned in a bullish structure across all major timeframes, supported by consistent buy signals from exponential and simple moving averages. The recent breakout past $90,000, coupled with a strong volume surge and upward momentum in key indicators such as the momentum oscillator and moving average convergence divergence (MACD), underscores sustained buyer interest. Unless critical support levels are breached, the current trend favors further upside, with near-term targets at $95,000 and $100,000.
Bear Verdict:
Despite prevailing bullish signals, the market shows early signs of exhaustion, particularly on the 1-hour chart, where momentum is waning and volume has tapered off near resistance. Oscillators remain largely neutral, indicating a lack of conviction. If bitcoin fails to hold above the $93,000 level and breaks below the $91,800 support zone, a corrective phase could ensue, challenging the prevailing bullish narrative and potentially dragging the price back toward the $88,000 level.
免责声明:本文章仅代表作者个人观点,不代表本平台的立场和观点。本文章仅供信息分享,不构成对任何人的任何投资建议。用户与作者之间的任何争议,与本平台无关。如网页中刊载的文章或图片涉及侵权,请提供相关的权利证明和身份证明发送邮件到support@aicoin.com,本平台相关工作人员将会进行核查。


