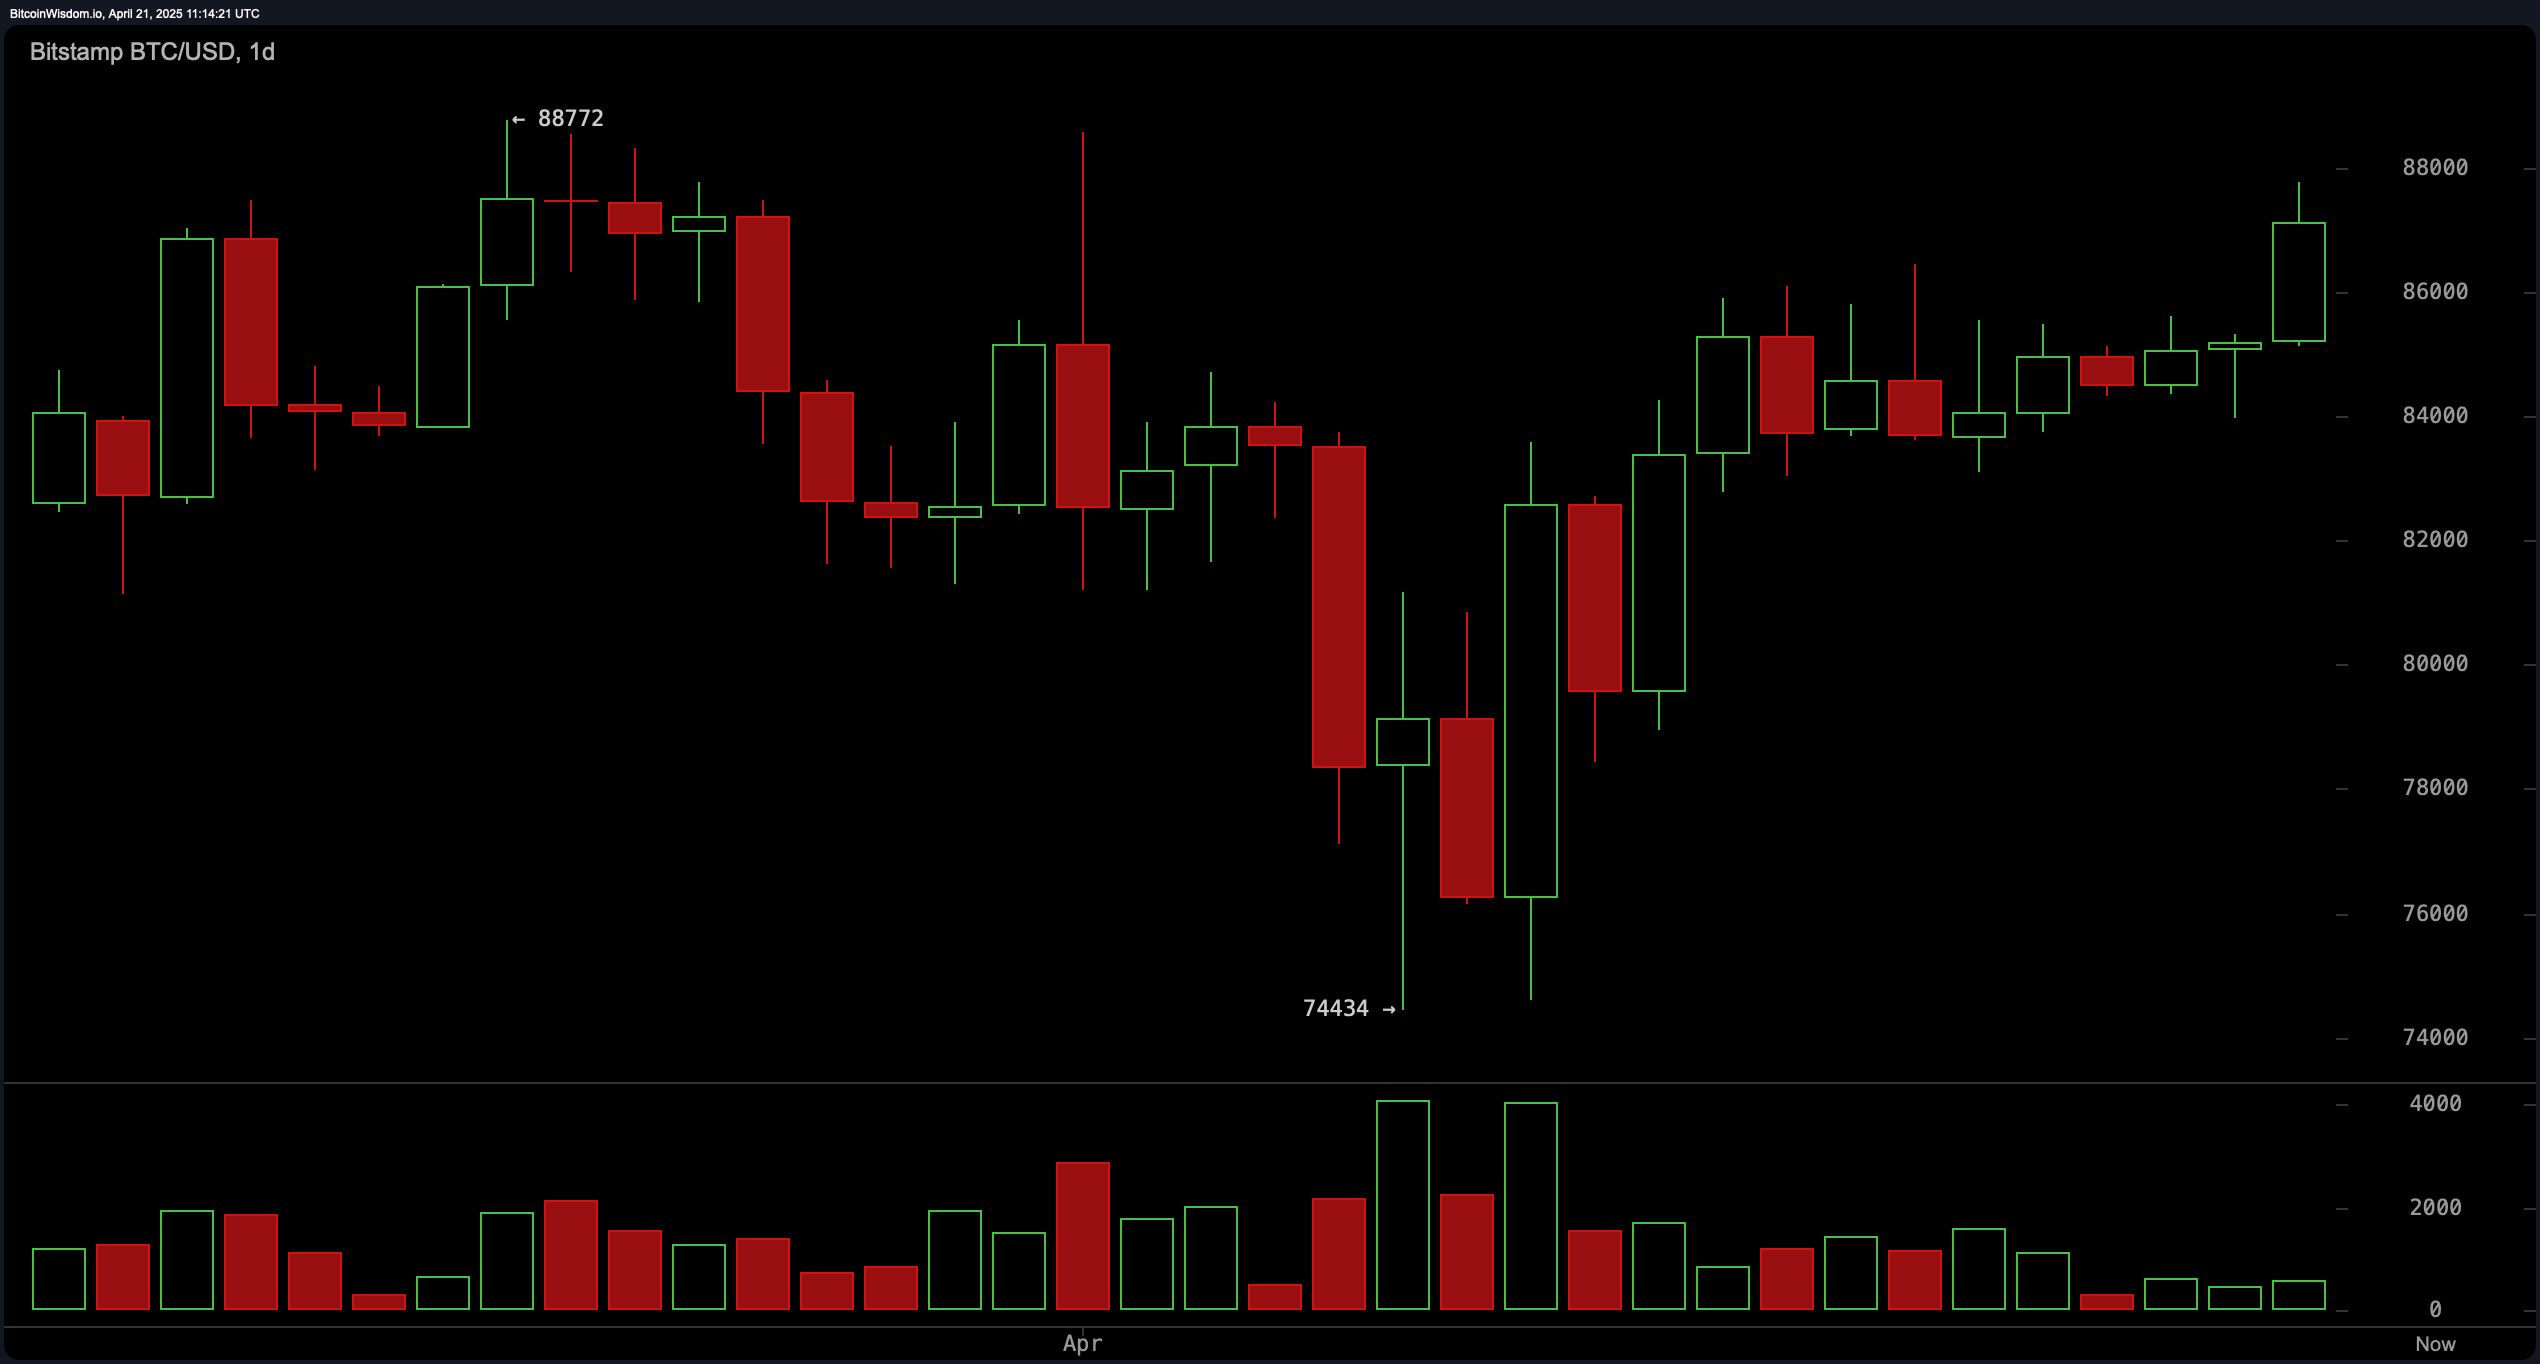
On the daily chart, bitcoin has staged a significant rebound after bottoming near $74,434, with price action pushing up to a high of $88,772. The bullish reversal is underscored by a surge in volume, confirming strong buyer interest. This reinforces the support zone near $74,400 as a technically significant level. With daily momentum favoring bulls, the uptrend appears robust, though recent price extension warrants cautious optimism as conditions approach short-term overbought territory.

BTC/USD 1 day chart via Bitstamp on April 21, 2025.
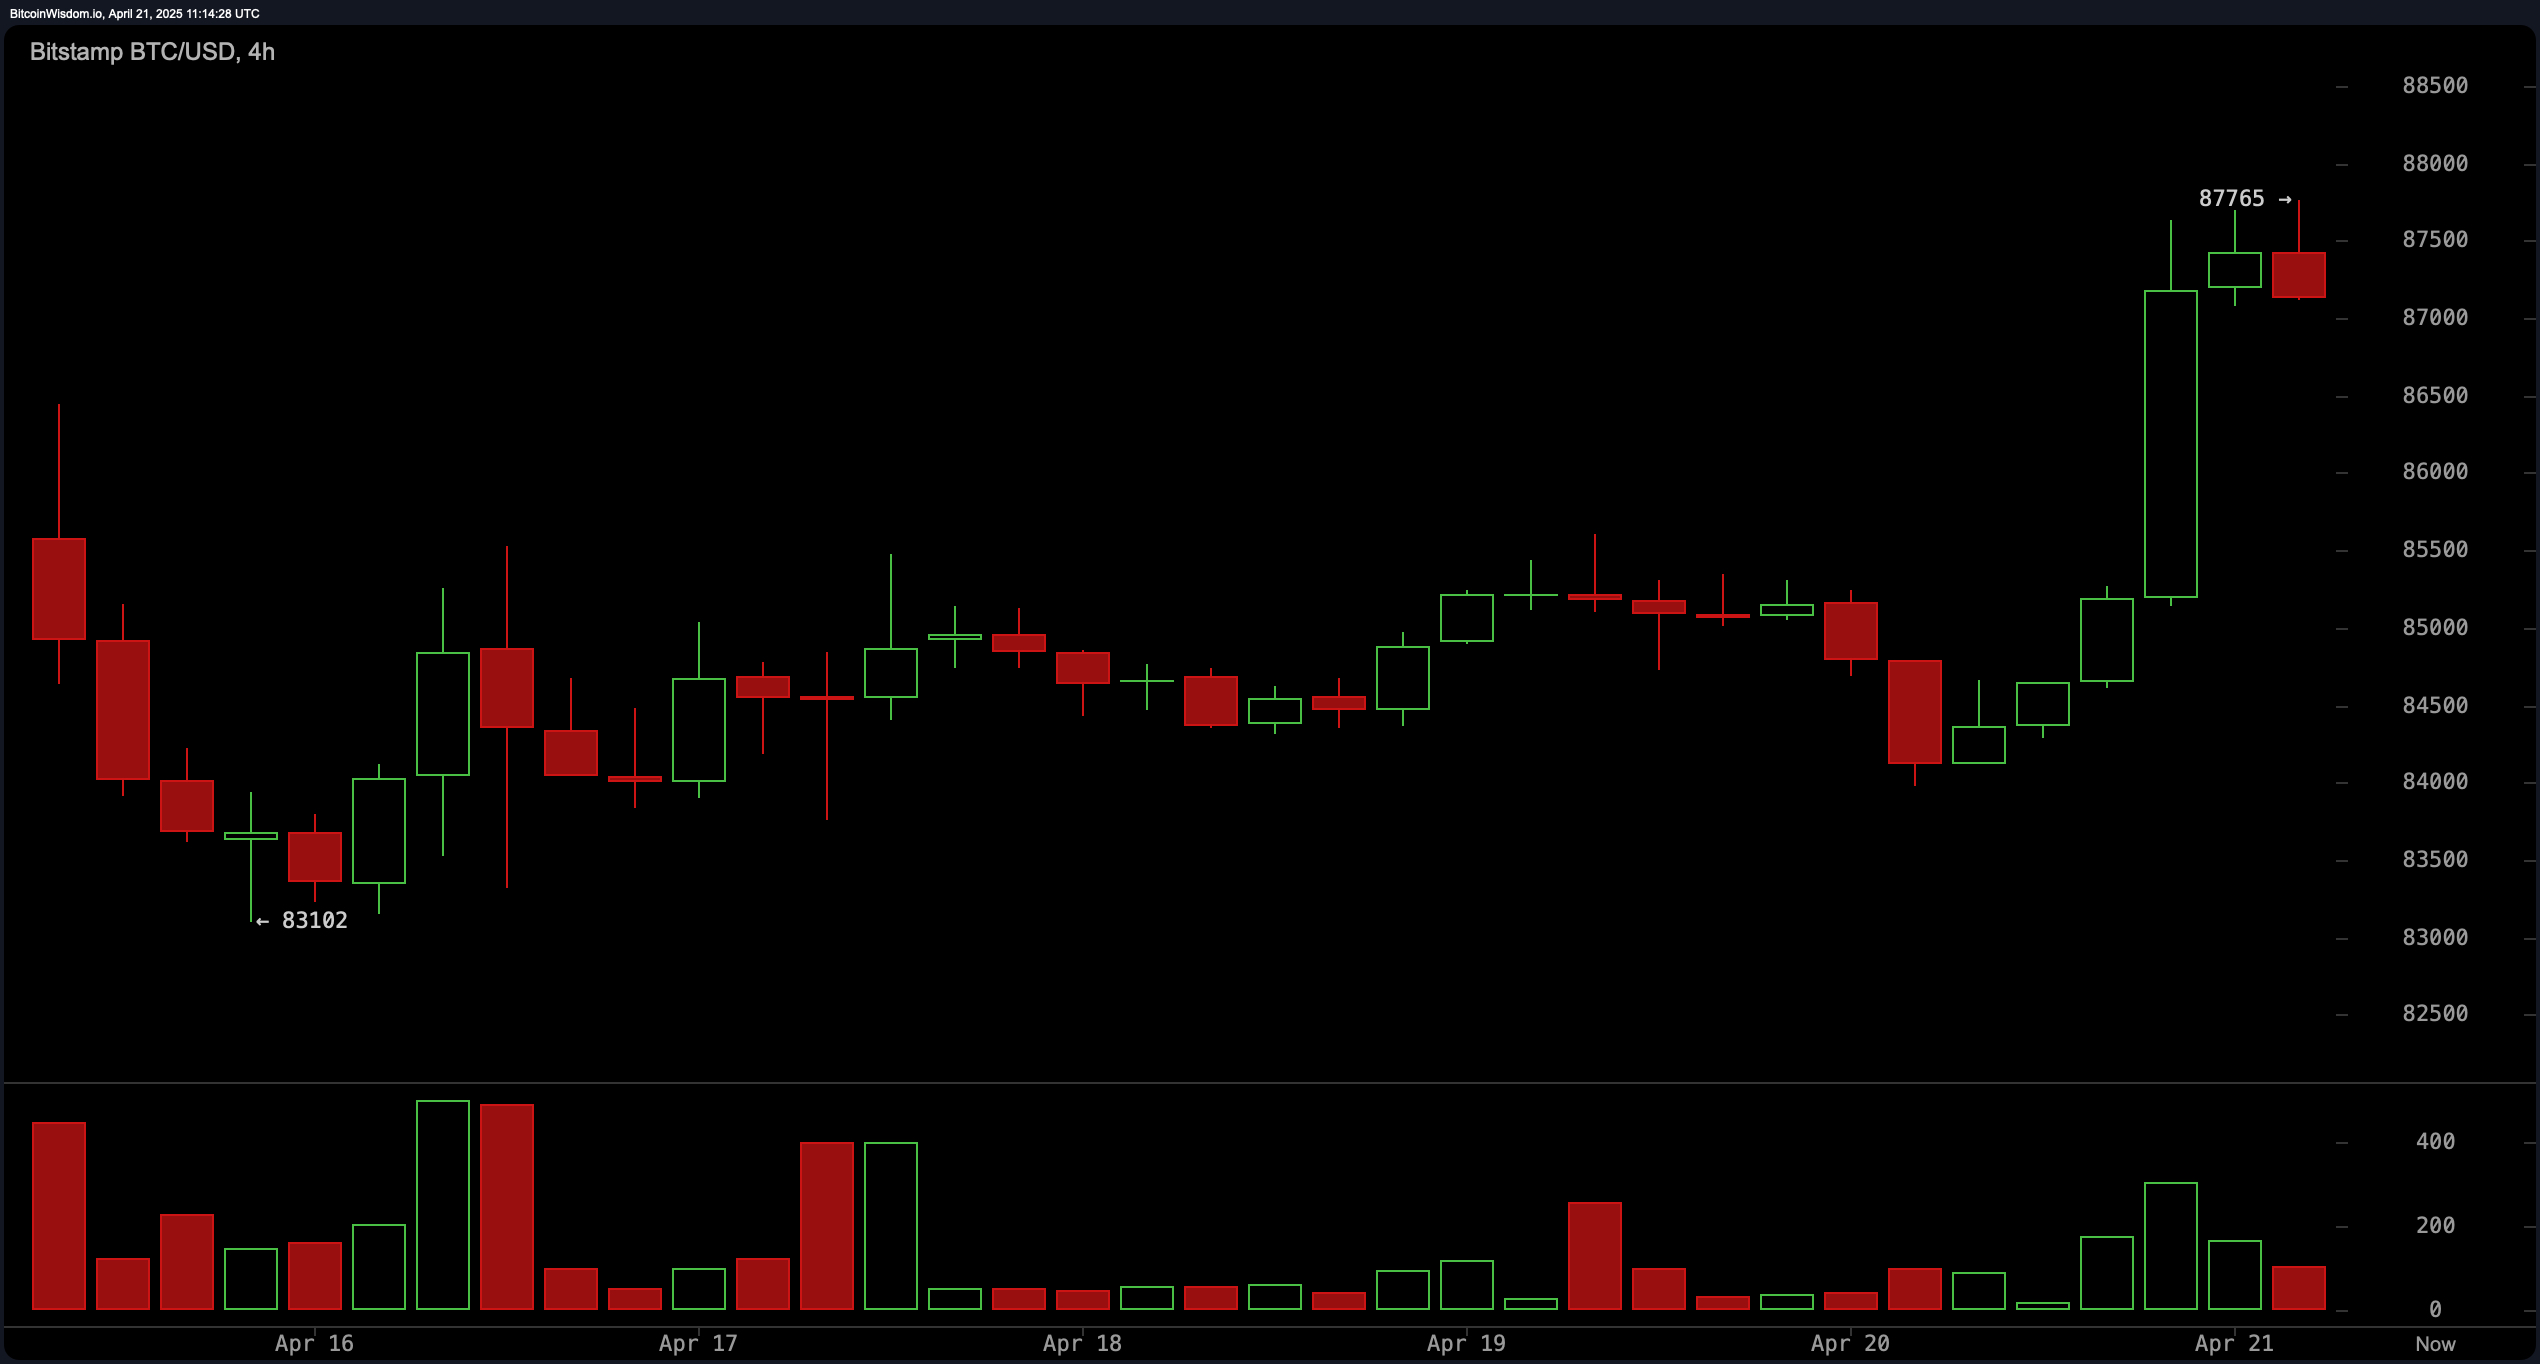
The four-hour chart shows bitcoin breaking out above resistance at $87,765 following a bounce from support at $83,100. The move was backed by a clear volume spike, confirming strength. However, the price has since pulled back modestly, signaling a possible consolidation phase before the next leg upward. Traders should monitor the $86,000–$86,300 region for potential long entries if downside volume remains weak. A drop below $85,500, accompanied by increasing volume, could lead to a retracement toward the $84,000 level.

BTC/USD 4 hour chart via Bitstamp on April 21, 2025.
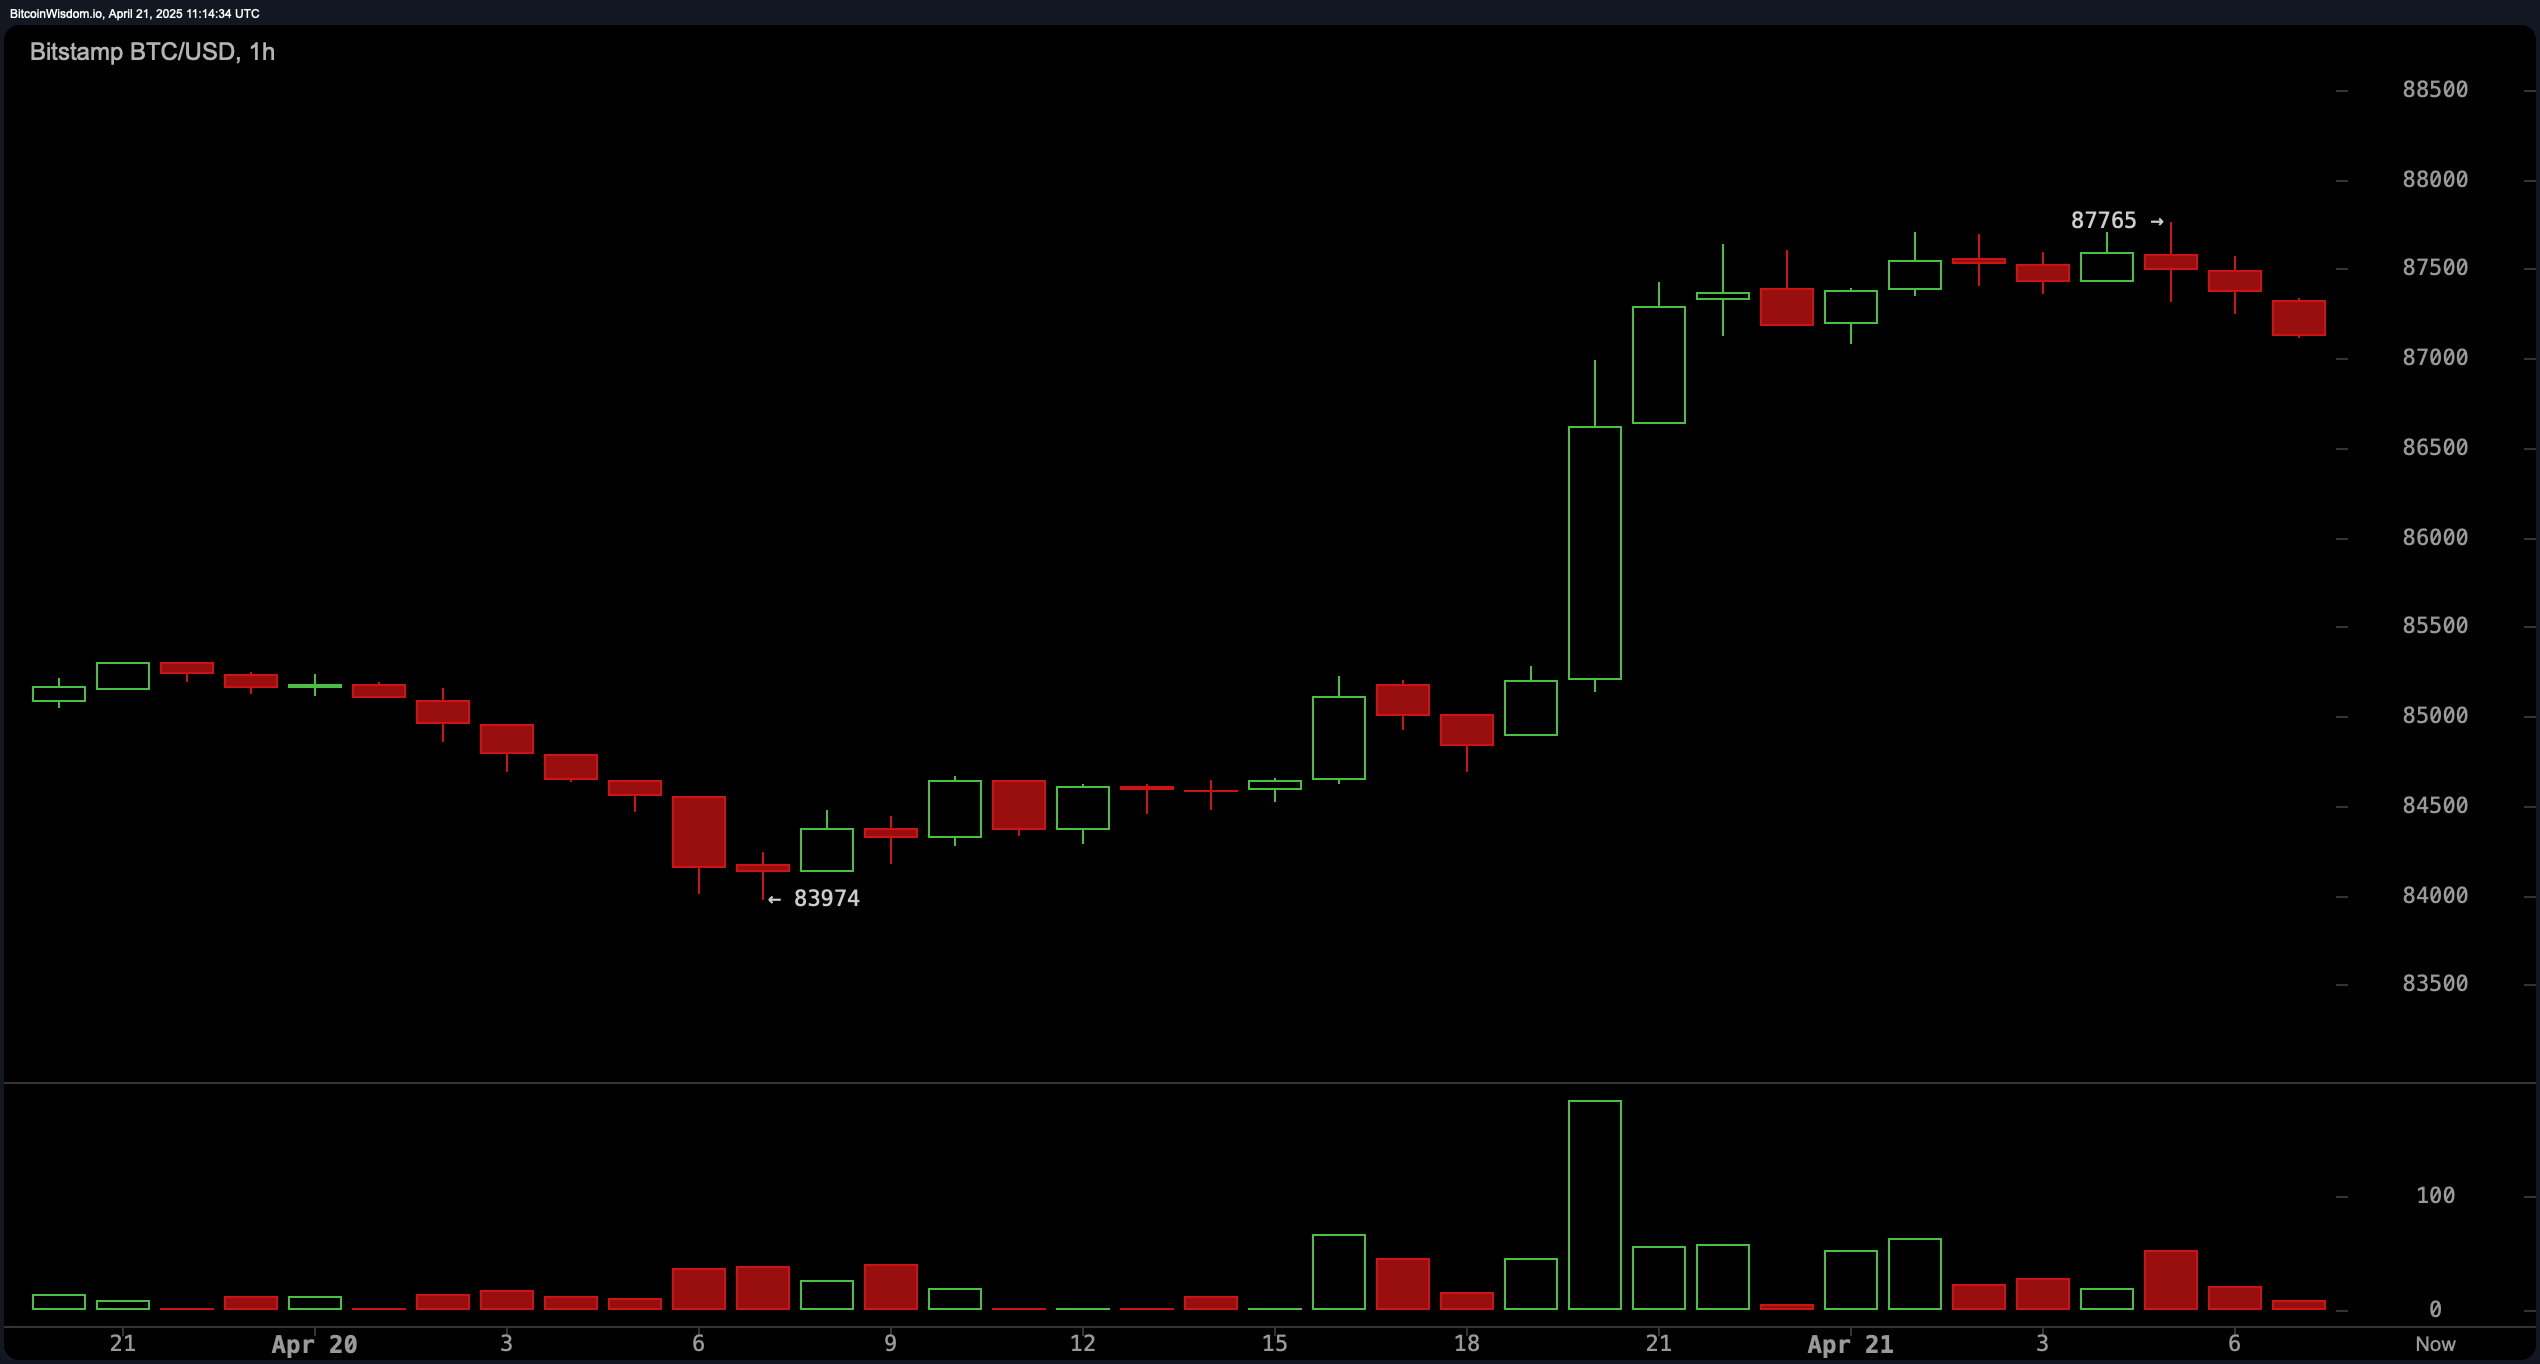
On the one-hour chart, bitcoin’s recent rally to $87,765 occurred with strong upward momentum and large bullish candles. However, immediate profit-taking has introduced a pullback, with the price now testing short-term support zones. A bullish flag or pennant appears to be forming, which, if confirmed, could facilitate a breakout continuation. A break above $87,800 would favor scalpers, while a failure to hold $86,000 could trigger a brief selloff.

BTC/USD 1 hour chart via Bitstamp on April 21, 2025.
Oscillators reflect mixed sentiment. The relative strength index (RSI) at 57, Stochastic at 91, commodity channel index (CCI) at 123, and average directional index (ADX) at 14 all signal neutrality. The Awesome oscillator and the moving average convergence divergence (MACD) level suggest buying pressure, while the momentum indicator presents a bearish signal. This divergence indicates a market in flux, where traders should rely more heavily on price structure and volume signals than oscillator consensus alone.
Moving averages continue to support the bullish outlook. Both the exponential moving average (EMA) and simple moving average (SMA) across the 10, 20, 30, and 50-periods are in positive territory. However, mixed signals emerge on longer-term averages. The exponential moving average (100) and simple moving average (100) both suggest bearish sentiment, and the simple moving average (200) does the same. The exponential moving average (200), however, maintains a bullish signal, implying that while the short-to-medium trend remains positive, traders should be aware of potential resistance in higher timeframes.
Bull Verdict:
Bitcoin continues to display strong upward momentum supported by bullish price structure, high-volume breakouts, and buy signals from the majority of short- to medium-term moving averages. If the asset maintains support above the $85,500–$86,000 range and reclaims $87,800 with volume, further upside toward and beyond $88,000 appears likely, reinforcing the trend continuation narrative.
Bear Verdict:
Despite recent gains, bitcoin’s overextension and mixed oscillator signals introduce caution. Failure to hold above key levels like $85,500, particularly if accompanied by rising sell volume, may trigger a short-term correction toward $84,000 or lower. Longer-term moving average sell signals also suggest that upside could be limited without a broader consolidation.
免责声明:本文章仅代表作者个人观点,不代表本平台的立场和观点。本文章仅供信息分享,不构成对任何人的任何投资建议。用户与作者之间的任何争议,与本平台无关。如网页中刊载的文章或图片涉及侵权,请提供相关的权利证明和身份证明发送邮件到support@aicoin.com,本平台相关工作人员将会进行核查。


