As it is firmly compressed between two important exponential moving averages, Bitcoin is currently experiencing a crucial technical moment that resembles a traditional price squeeze. Although bulls may just be in the lead, this tension in the charts is preparing for a possible volatility-driven breakout in either direction.
Bitcoin is currently trading at about $84,000 just above the 100-day EMA and encountering resistance from the 200-day EMA at about $87,350. A resolution appears imminent as a result of the pressure created by this small trading range. A break above the 200 EMA would invalidate the long-standing death cross that has hampered Bitcoins midterm performance in addition to indicating bullish momentum.
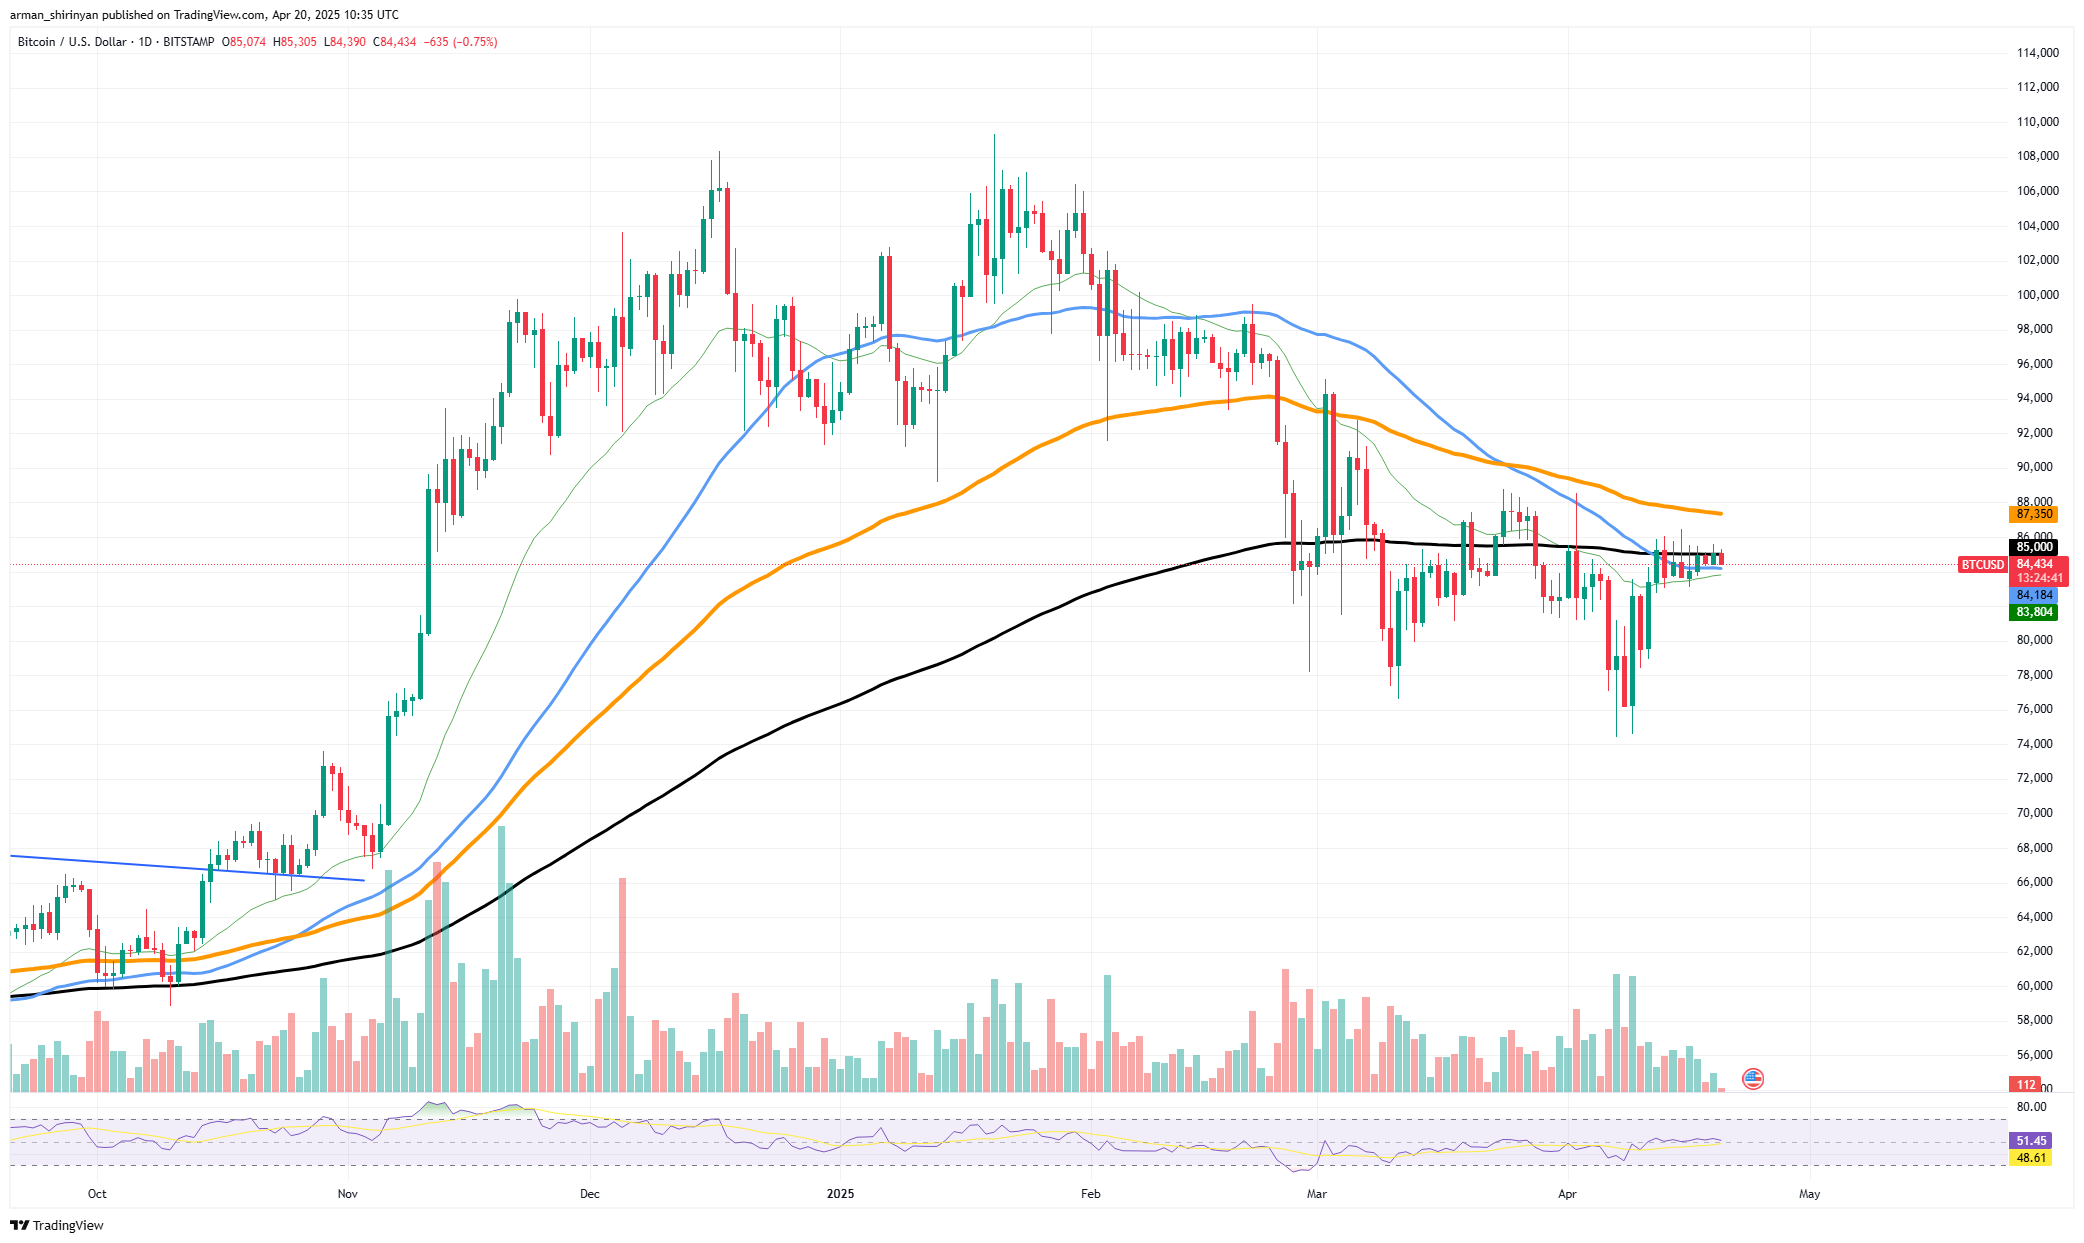
BTC/USDT Chart by TradingView
The chart's slightly declining volume is frequently a sign of a coiling move, which is a prelude to explosive price action. When a clear move occurs, traders will have room to influence price action because the RSI is neutral at about 51.5, indicating that Bitcoin is neither overbought nor oversold.
HOT Stories 25,696,960 SHIB In Merely Hours – What’s Happening? XRP Witnessing Bollinger Band Squeeze Bitcoin (BTC) Absolutely Getting Squeezed, Shiba Inu (SHIB) Volume Nears Zero, Dogecoin (DOGE) Investors Melting Away Bitcoin to Hit at Least $180,000 This Year, "Rich Dad Poor Dad" Author Predicts
A short squeeze could force prices back toward the psychological $90,000 level and higher if Bitcoin is able to break above the 200 EMA. A move like that would turn around pessimistic sentiment and possibly usher in a new bullish market phase. However, if resistance is not overcome, there may be a rejection down toward the $82,000–$83,000 support zone where the 100 EMA currently provides a safety net. Below that, there is a chance that Bitcoin will lose steam and enter another period of consolidation or correction.
Shiba Inu crawls up
As Shiba Inu gets closer to the 50-day exponential moving average (EMA), which is serving as a crucial technical ceiling, it is encountering a crucial resistance level and finding it difficult to gain traction. Currently, SHIB is circling the $0.0000122 level where it has encountered significant resistance at the 50 EMA. In recent trading sessions, it has been unable to break above this level with conviction. A prominent indication of waning market activity is the steep drop in volume.
Related

Sun, 04/20/2025 - 10:10 XRP Funding Rate Surges Amid Crypto Market Sell-Off: What’s Happening?
Tomiwabold Olajide
According to the chart, SHIB's trading volume has been declining over the last few weeks, with recent daily bars indicating participation that is almost flat. This declining volume shows that market participants are either sidelined or losing interest in the asset, which suggests a lack of conviction from both bulls and bears.
Any attempt at a breakout, particularly above the 50 EMA, may not have the strength necessary to maintain upward momentum due to the declining volume. In the past, technical breakout validation has required volume confirmation.
Without it, moves have a tendency to quickly wane or completely reverse. Lower highs and lower lows continue to define Shiba Inu's medium-term structure, and the breed is still in a wider downward trend. The asset has not been able to establish a steady base or draw in fresh capital in order to buck the trend even with sporadic recoveries from the support in the $0.0000110-$0.0000115 range.
There isn't any obvious bullish or bearish divergence to offer a directional cue as the RSI is in a neutral zone just below the 50 mark. Unless volume is restored and SHIB can confirm a close above the 50 EMA, the path of least resistance stays sideways or bottom.
Dogecoin moves forward
Dogecoin, which was once a favorite among retail cryptocurrency users, is beginning to lose investor fervor as its price performance keeps getting worse. At around $0.155 right now, DOGE is still firmly stuck in a bearish trend. Since its last significant spike in late 2024 it has been unable to regain important moving averages and has been posting consistently lower highs.
Technically, DOGE has not been able to surpass the 50-day exponential moving average (EMA), which is frequently used as a gauge of short-term momentum. With declining volume and deteriorating investor sentiment, the 50 EMA and 100 EMA resistance is proving to be too strong. The price has been consolidating at $0.145, just above the critical support level, but this support might not last long if there isn't any significant volume behind it. The picture painted by the volume profile is alarming.
Related

Sun, 04/20/2025 - 09:52 Charles Schwab to Introduce Spot Crypto Trading; Here's When
Alex Dovbnya
As market conditions remain uncertain, investors are turning away from the meme coin as evidenced by the steady decline in trading activity. Dogecoin may continue to decline or stagnate in a narrow low-volatility range in the absence of fresh buying interest or a motivating event. The relative strength index (RSI) values are currently hovering just above the 40 mark, which is significantly below the neutral 50 threshold. This indicates that DOGE is still in bearish territory and lacks momentum.
This strengthens the case that at least temporarily, investors are becoming less confident. DOGE would need to break and hold above the $0.165-$0.18 range in order to reenter bullish territory, ideally accompanied by a sizable increase in trading volume. Investors will probably keep melting away from one of the most recognizable meme coins of the previous cycle until that time, during which the asset is expected to continue its gradual decline.
免责声明:本文章仅代表作者个人观点,不代表本平台的立场和观点。本文章仅供信息分享,不构成对任何人的任何投资建议。用户与作者之间的任何争议,与本平台无关。如网页中刊载的文章或图片涉及侵权,请提供相关的权利证明和身份证明发送邮件到support@aicoin.com,本平台相关工作人员将会进行核查。


