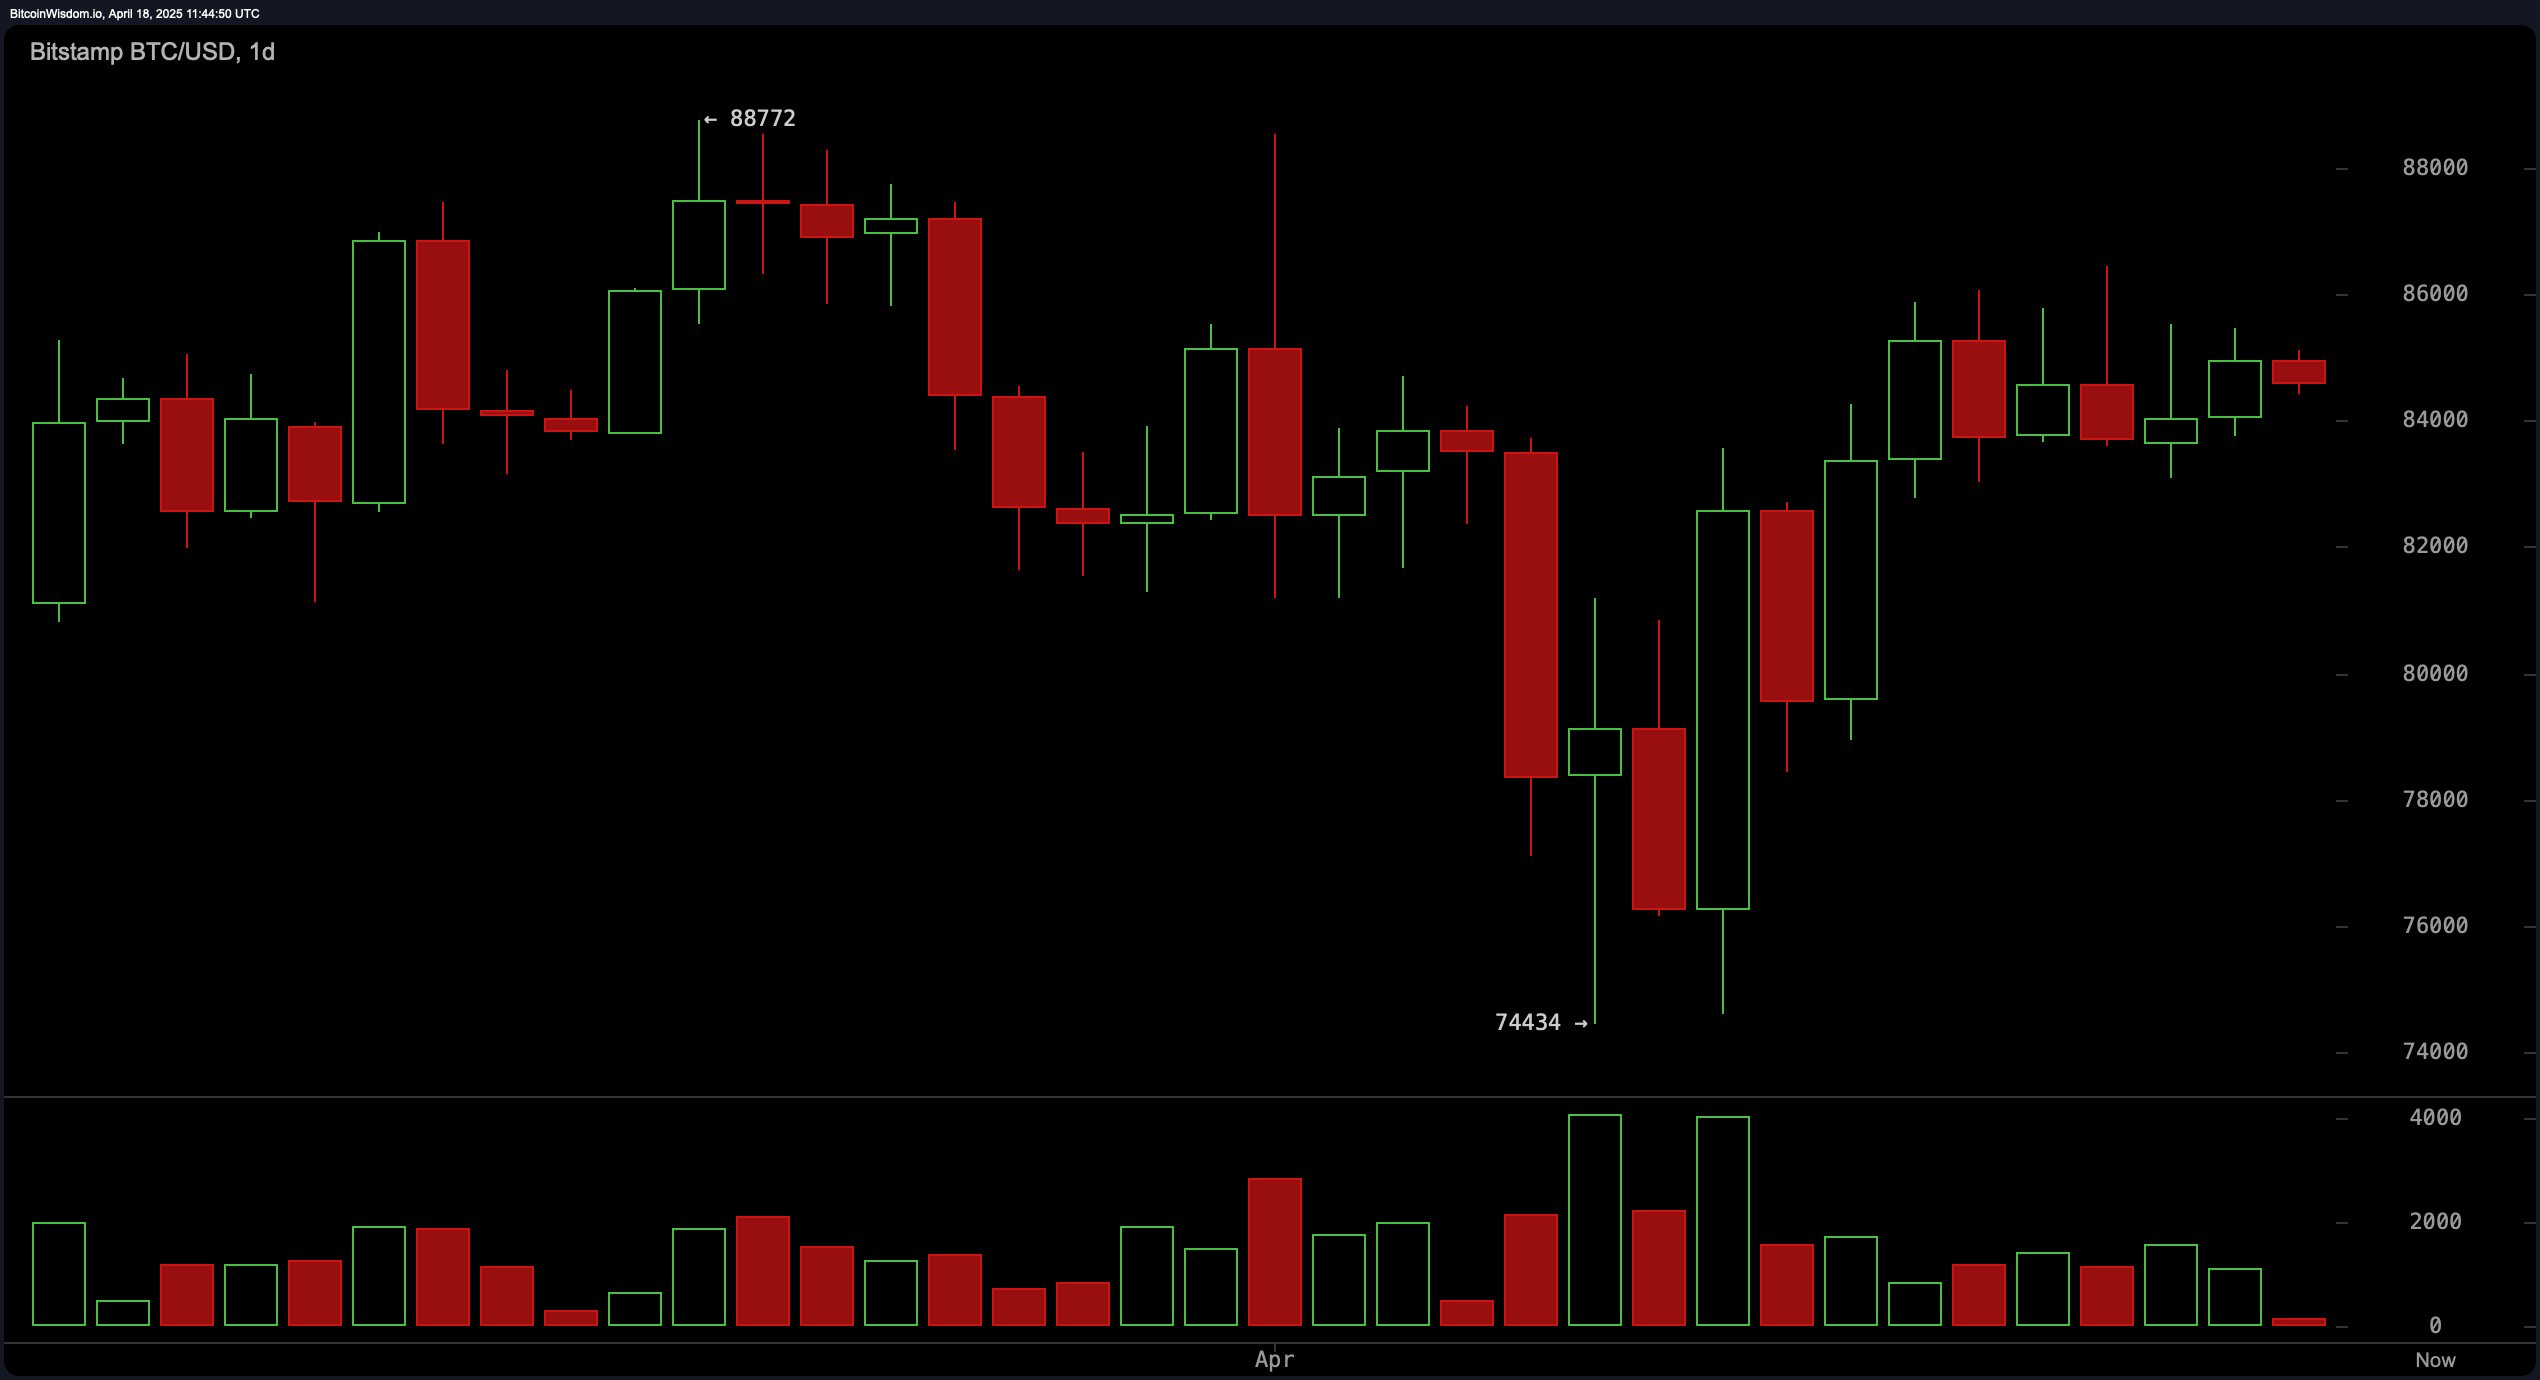
On the daily chart, bitcoin ( BTC) has traded in a defined range since forming a lower high near $88,772 and finding support around $74,434. The rebound from that level produced a V‑shaped recovery to the current price near $84,549, where sideways consolidation has taken hold. Key thresholds are $86,000 to the upside and $82,000 to the downside. A decisive close above $86,000 would signal renewed upward momentum, while a break below $82,000 could prompt a retest of mid‑$70,000s support.

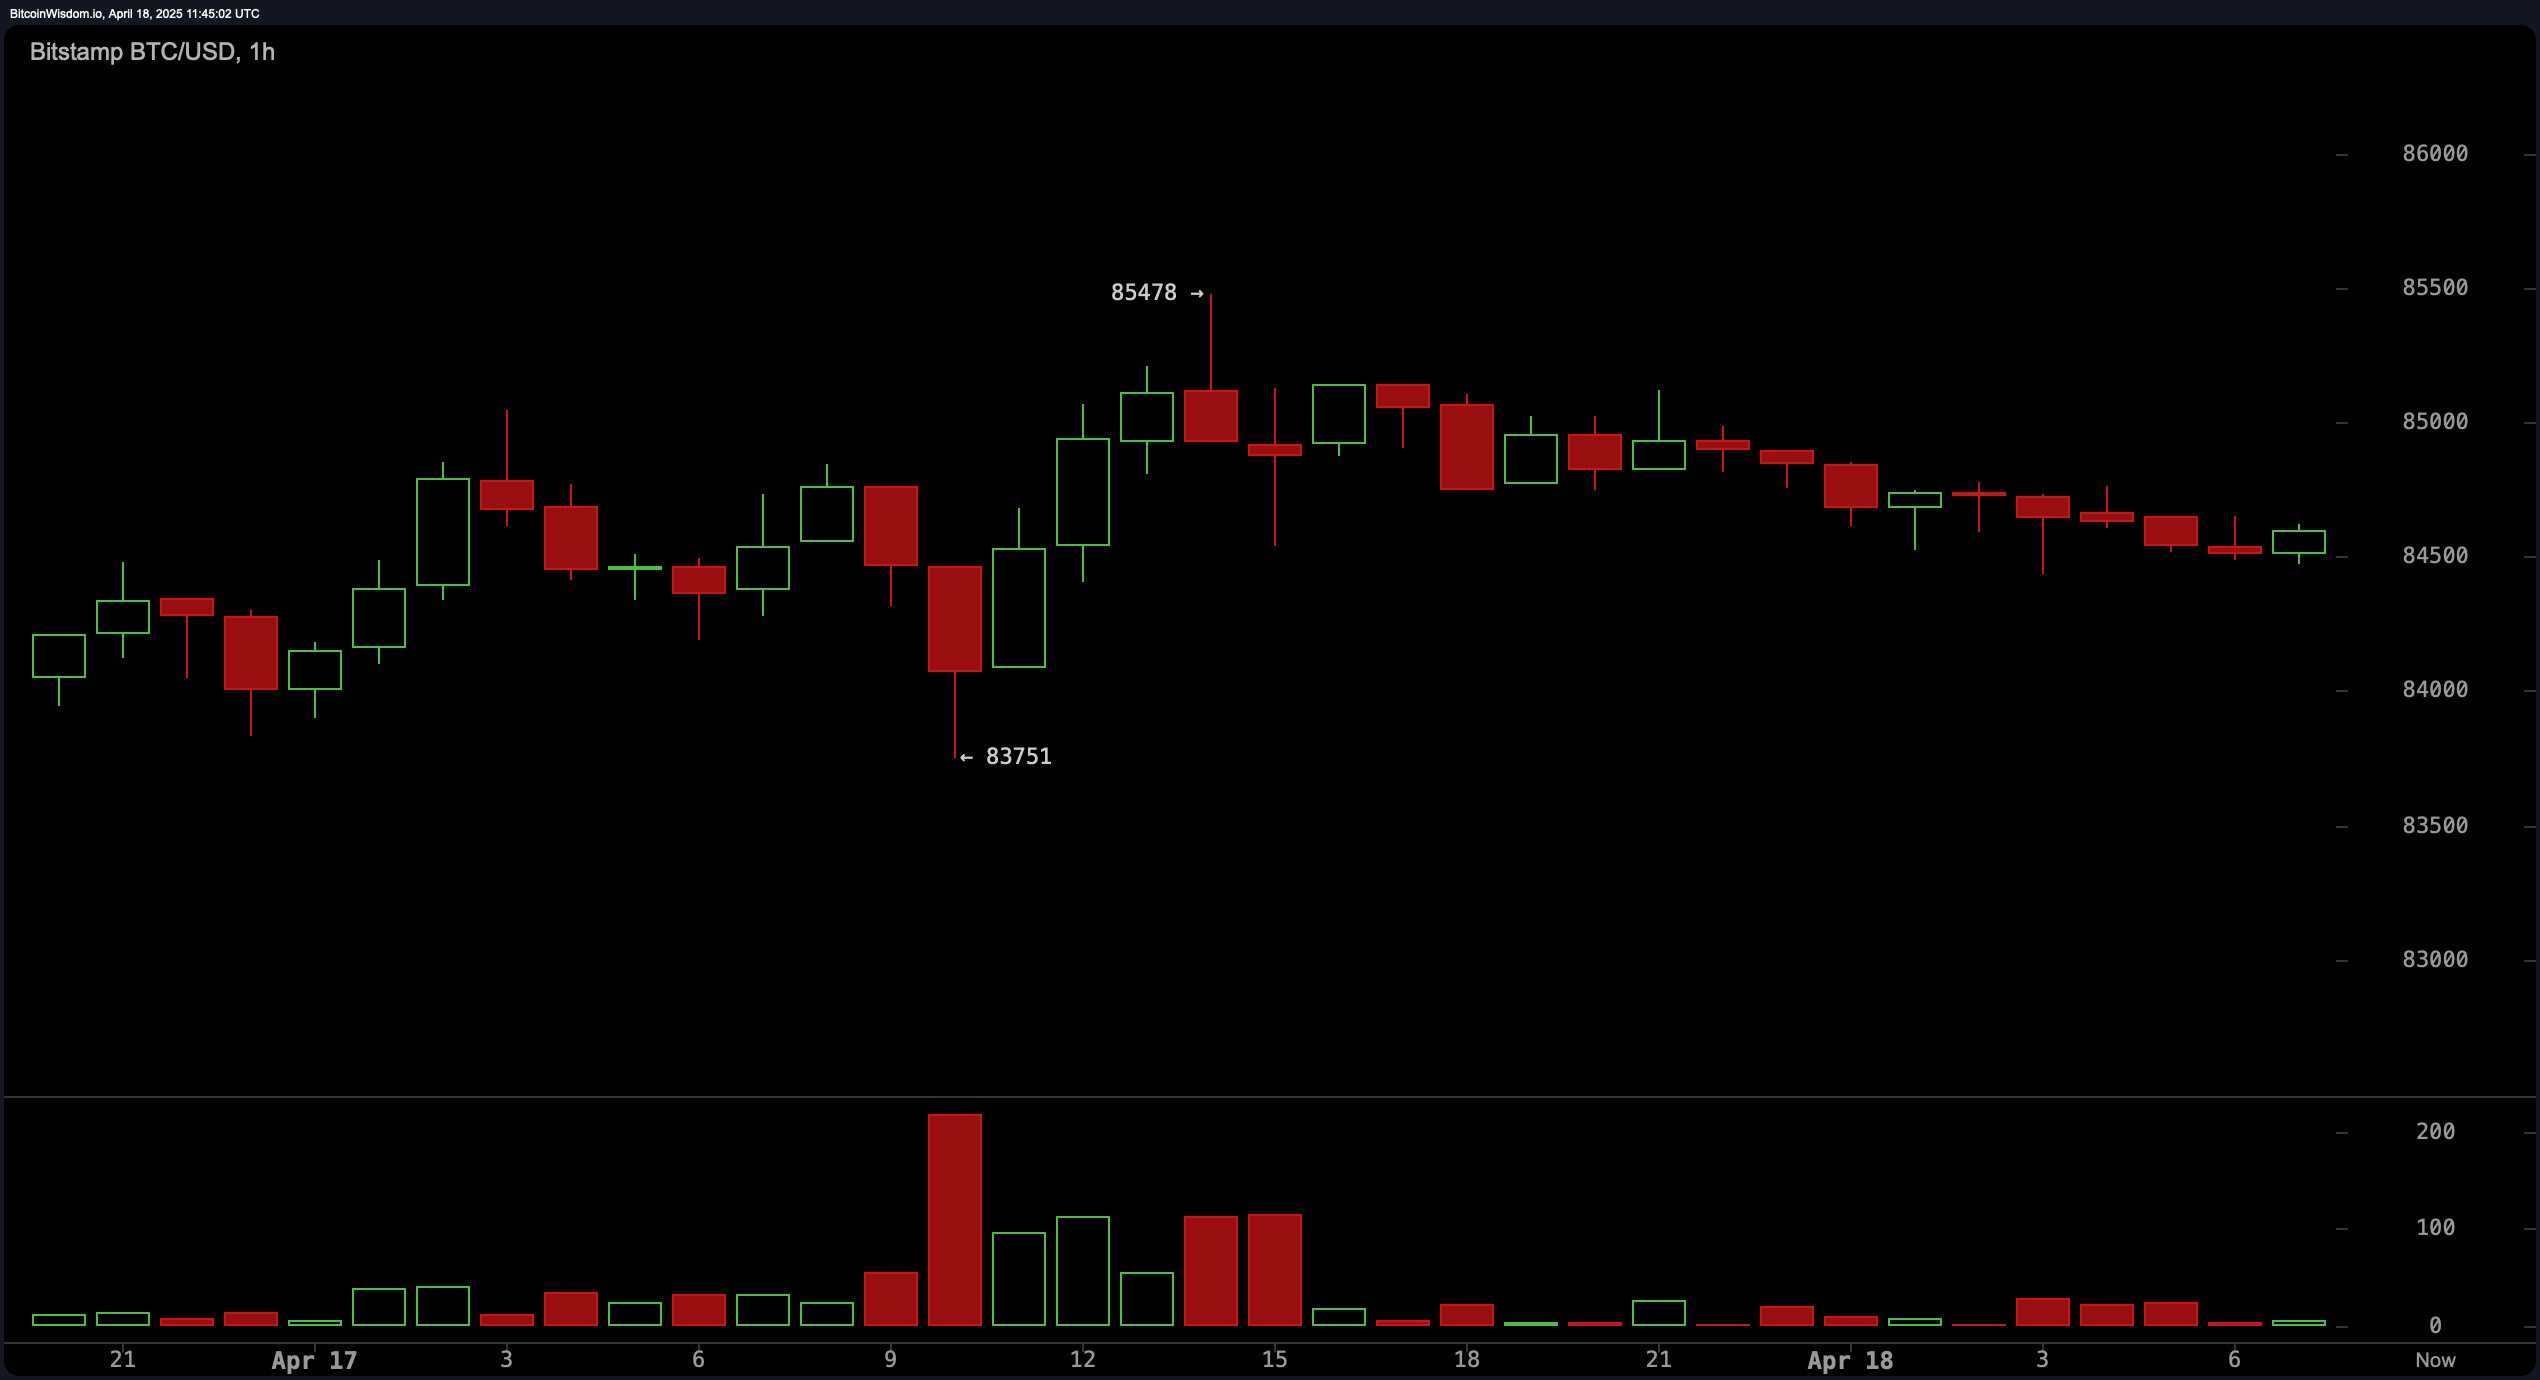
BTC/USD 1H chart via Bitstamp on April 18, 2025.
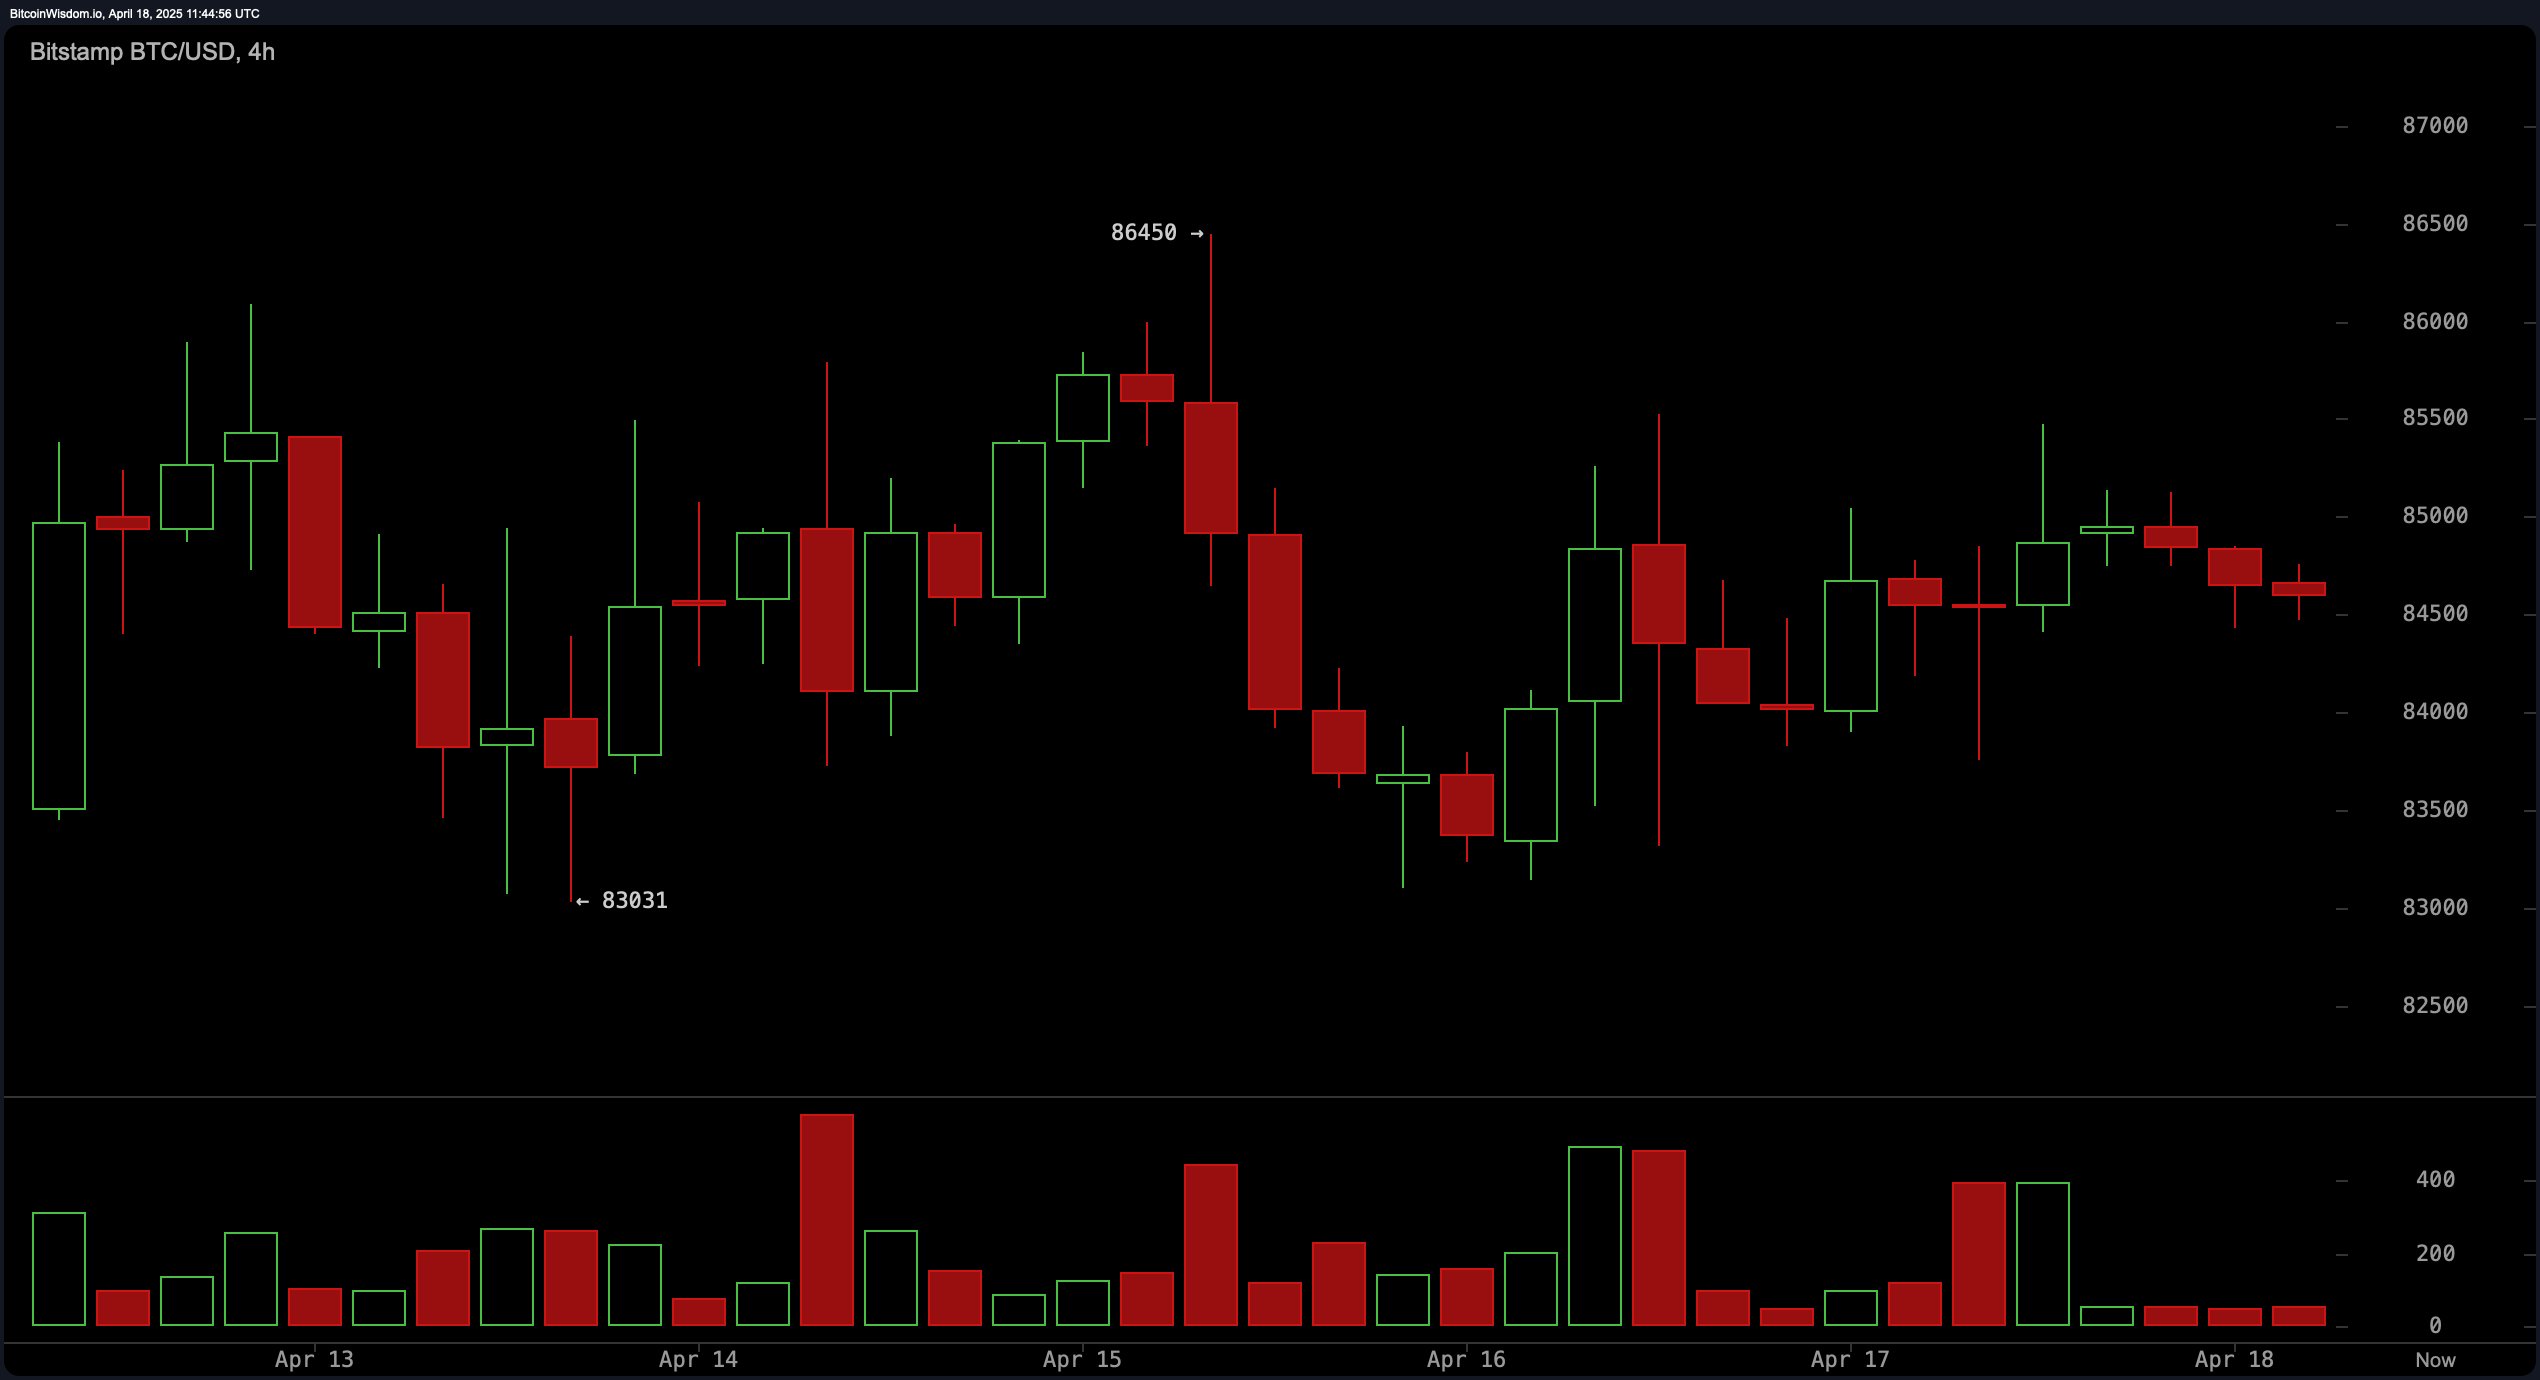
On the 4‑hour chart, price action has settled into a corridor between $83,031 and $86,450, characterized by mixed candlesticks and reduced volatility. A clear break above $86,450 accompanied by elevated volume would validate bullish conviction, while a decisive drop below the lower boundary at $83,031 could intensify selling pressure. Given the potential for rapid swings, traders should employ tight stop orders and adjust position sizes to account for the choppy environment.

BTC/USD 4H chart via Bitstamp on April 18, 2025.
On the 1‑hour chart, bitcoin has traced a descending channel since peaking near $85,478, with recent lows hovering around $83,751. Short‑term momentum appears subdued, suggesting that range‑bound scalping could be more prudent than directional bets. Traders may look for bounces in the $83,750 to $84,000 zone for potential long entries, while a breakdown below $83,750 on stronger volume could amplify moves toward the $83,000 level and beyond.

BTC/USD 1D chart via Bitstamp on April 18, 2025.
Oscillators paint a mostly neutral picture, with relative strength index (RSI) at 52, Stochastic at 84, commodity channel index (CCI) at 76, average directional index (ADX) at 13, and awesome oscillator (AO) at 1,063, all signaling equilibrium. However, momentum (MOM) at 8,334 and moving average convergence divergence (MACD) level at –95 are flashing buy signals, indicating that the underlying force may be tipping in favor of bulls.
Moving averages (MAs) are skewed to the short term, with exponential moving average (EMA) values of 83,694 at 10 periods, 83,456 at 20 periods and 83,871 at 30 periods, alongside simple moving average (SMA) values of 83,635 at 10 periods, 82,656 at 20 periods and 83,577 at 30 periods, all in buy mode. On longer horizons, the 50‑period EMA at 85,332 and the 100‑period EMA at 87,458 sit in sell territory, as do the 100‑period SMA at 91,135 and both 200‑period EMAs and SMAs.
Bull Verdict:
If bitcoin can close above $86,000 on the daily chart with a surge in volume and hold above its 20‑ and 30‑period exponential moving averages, bullish momentum should carry it toward the $90,000 region.
Bear Verdict:
If bitcoin breaks below $82,000 support and the 1‑hour channel floor near $83,750 on rising volume, a deeper pullback toward the mid‑$70,000s becomes increasingly likely.
免责声明:本文章仅代表作者个人观点,不代表本平台的立场和观点。本文章仅供信息分享,不构成对任何人的任何投资建议。用户与作者之间的任何争议,与本平台无关。如网页中刊载的文章或图片涉及侵权,请提供相关的权利证明和身份证明发送邮件到support@aicoin.com,本平台相关工作人员将会进行核查。


