This is a daily technical analysis by CoinDesk analyst and Chartered Market Technician Omkar Godbole.
Bitcoin's (BTC) recovery rally has stalled since Sunday, raising the risk of a bearish shift in key indicators.
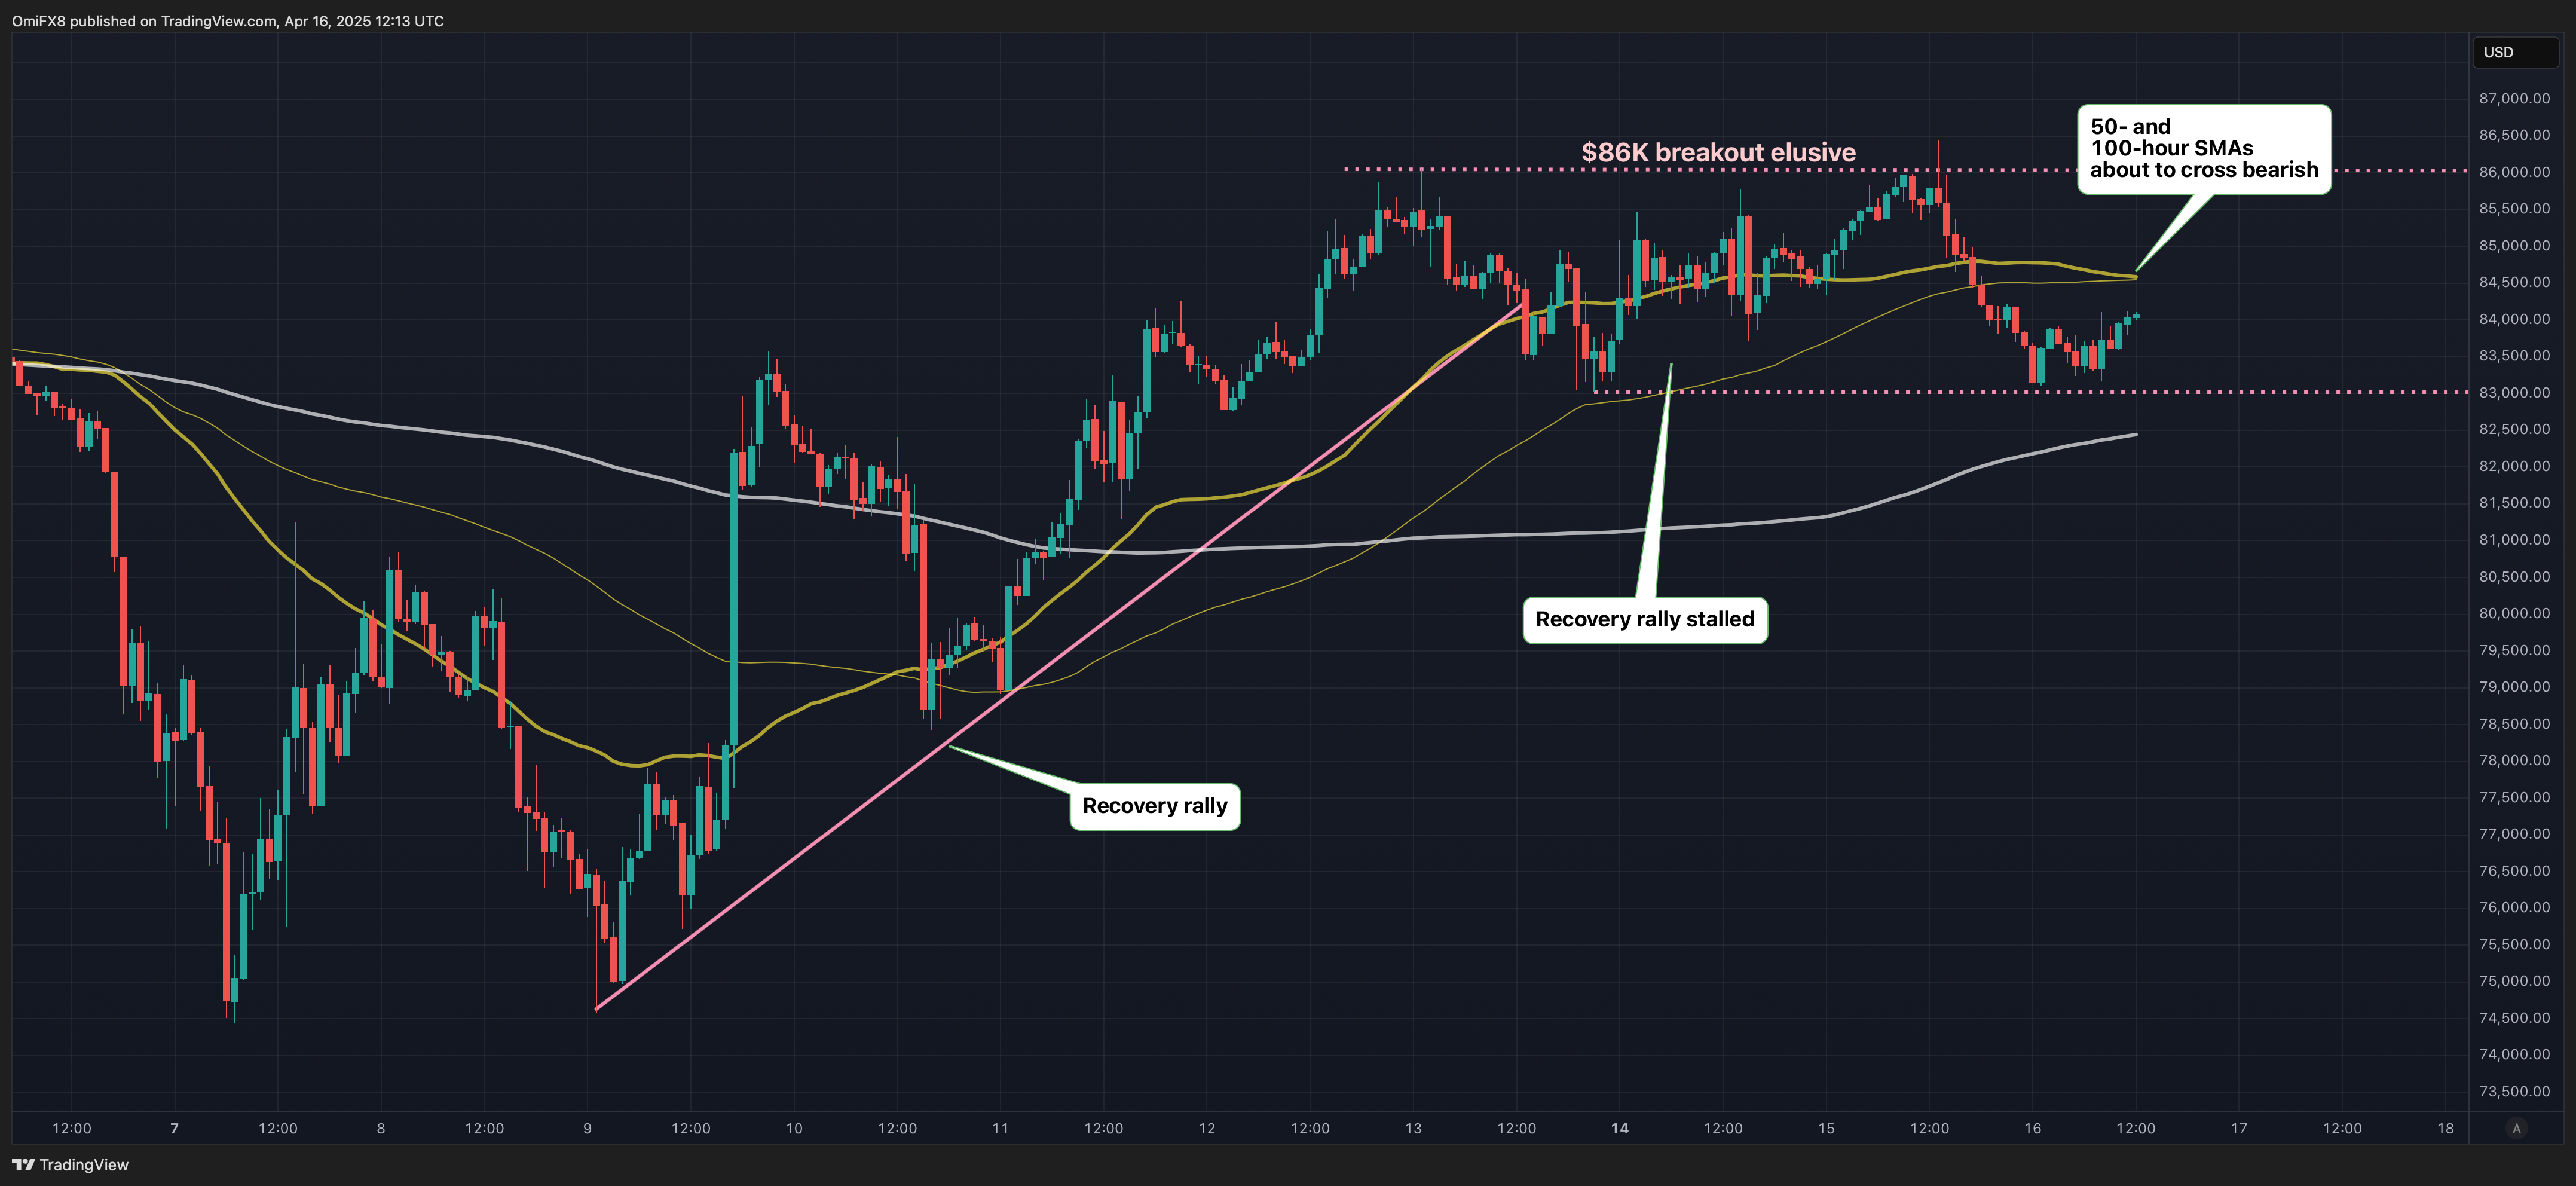
Since Sunday, the $86,000 mark has emerged as a resistance and supply zone, with bulls failing to keep gains above that level. The elusive breakout has raised the risk of a bearish realignment in key momentum indicators – the 50, 100- and 200-hour simple moving averages (SMA). The three averages stacked one below the other and trending south represent the bearish alignment.
The 50- and 100-hour SMAs have peaked and appear on track to produce a bearish crossover that will see the former move below the latter. While the cryptocurrency's price remains above the 200-hour SMA, the impending bear cross of the other two SMAs indicates that sellers are looking to reassert themselves.
Additionally, the daily chart MACD histogram has stopped printing successively higher bars above the zero line, reflecting a loss of upward momentum to support the notion of potential bearish developments in the market.
All this, when viewed against the backdrop of downward trending 50- and 100-day SMAs, calls for caution on the part of the bulls. A move below $83K, the hourly chart support, would validate the bearish developments, potentially yielding a sell-off toward the recent lows near $75K.
Meanwhile, a UTC close above $86K is needed to signal a continuation of the recovery rally.
免责声明:本文章仅代表作者个人观点,不代表本平台的立场和观点。本文章仅供信息分享,不构成对任何人的任何投资建议。用户与作者之间的任何争议,与本平台无关。如网页中刊载的文章或图片涉及侵权,请提供相关的权利证明和身份证明发送邮件到support@aicoin.com,本平台相关工作人员将会进行核查。


