On the one-hour chart, XRP is demonstrating a steady yet cautious upward trend following a recovery from a recent low of $1.61. Price action has since shown a retest of the support zone near $1.85, followed by a gradual climb toward the psychological resistance level of $2.00. The prevailing structure supports a bullish bias in the microtrend, provided that the price sustains itself above the $1.85–$1.88 region. Short-term traders may look for scalp entries within this zone, with potential exits around the $2.00 to $2.03 levels, while maintaining protective stops below $1.84 to manage downside risks.
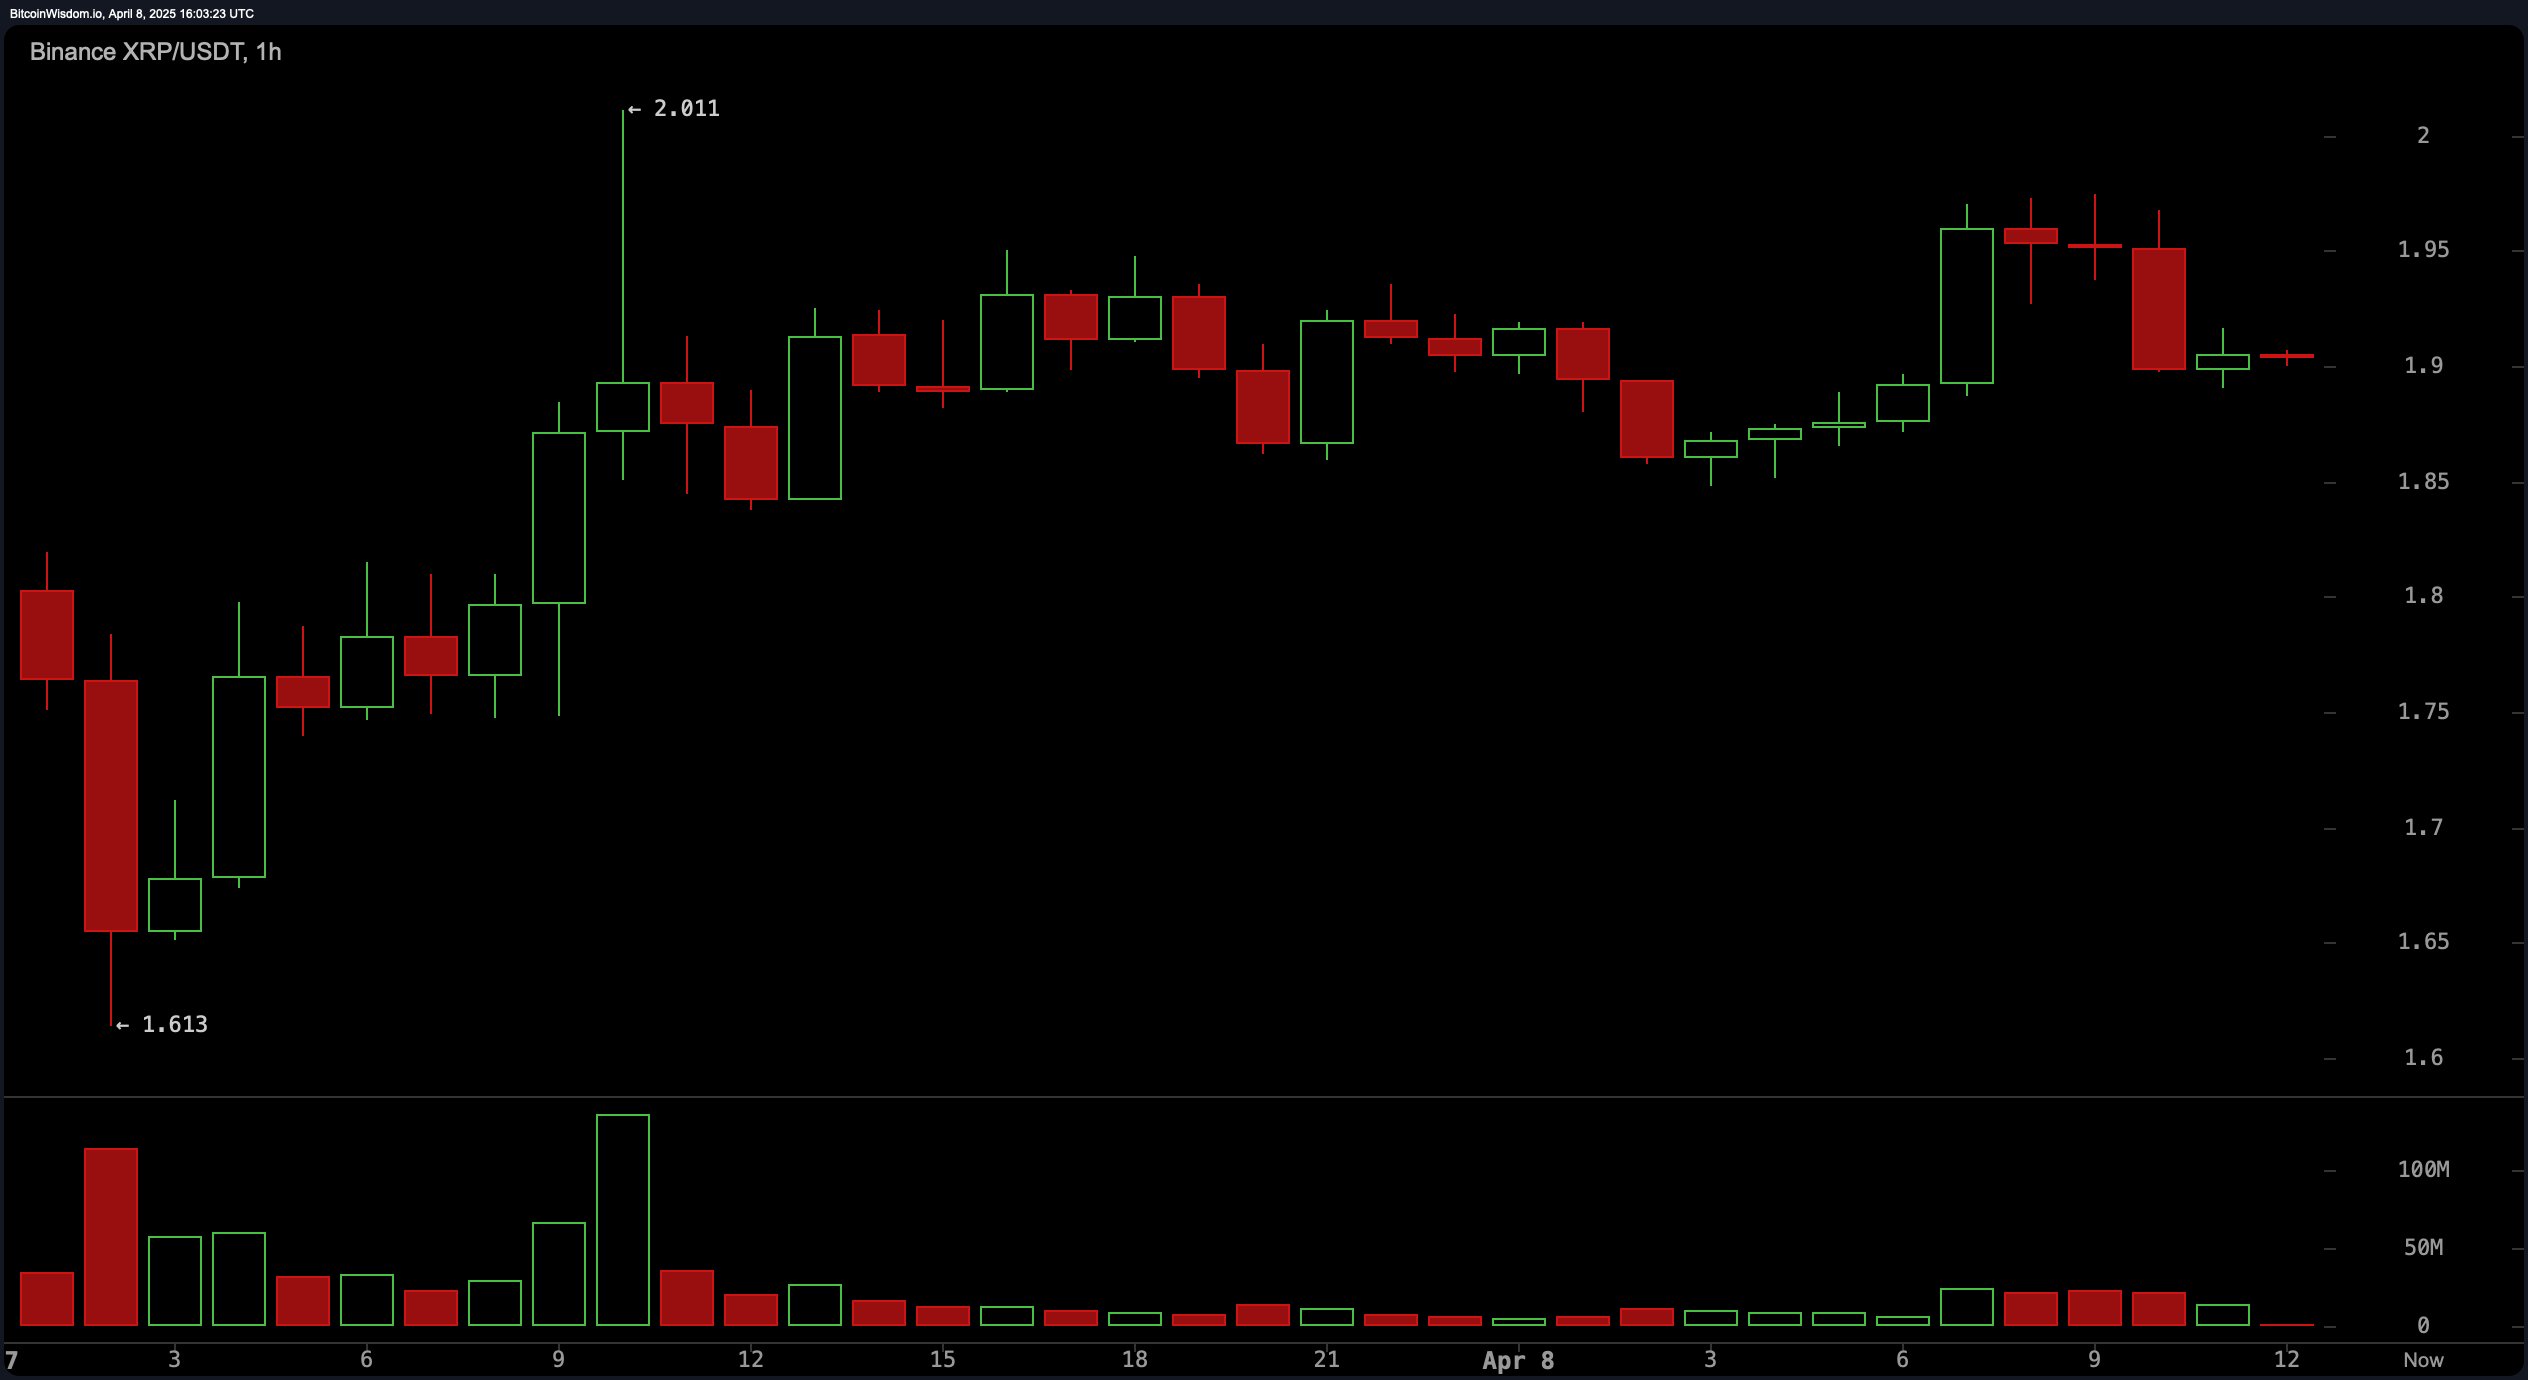
XRP/ USDT via Binance 1H chart on April 8, 2025.
The four-hour chart continues to reflect a V-shaped recovery from recent declines, followed by a period of price consolidation centered around $1.90. This phase indicates a pause in momentum as buyers assess the next move. A clear break above the $1.96 to $2.00 zone, particularly if supported by high trading volume, could pave the way for further gains. However, caution is warranted as a retest and failure near $1.80 would negate the bullish setup and suggest renewed downward pressure.
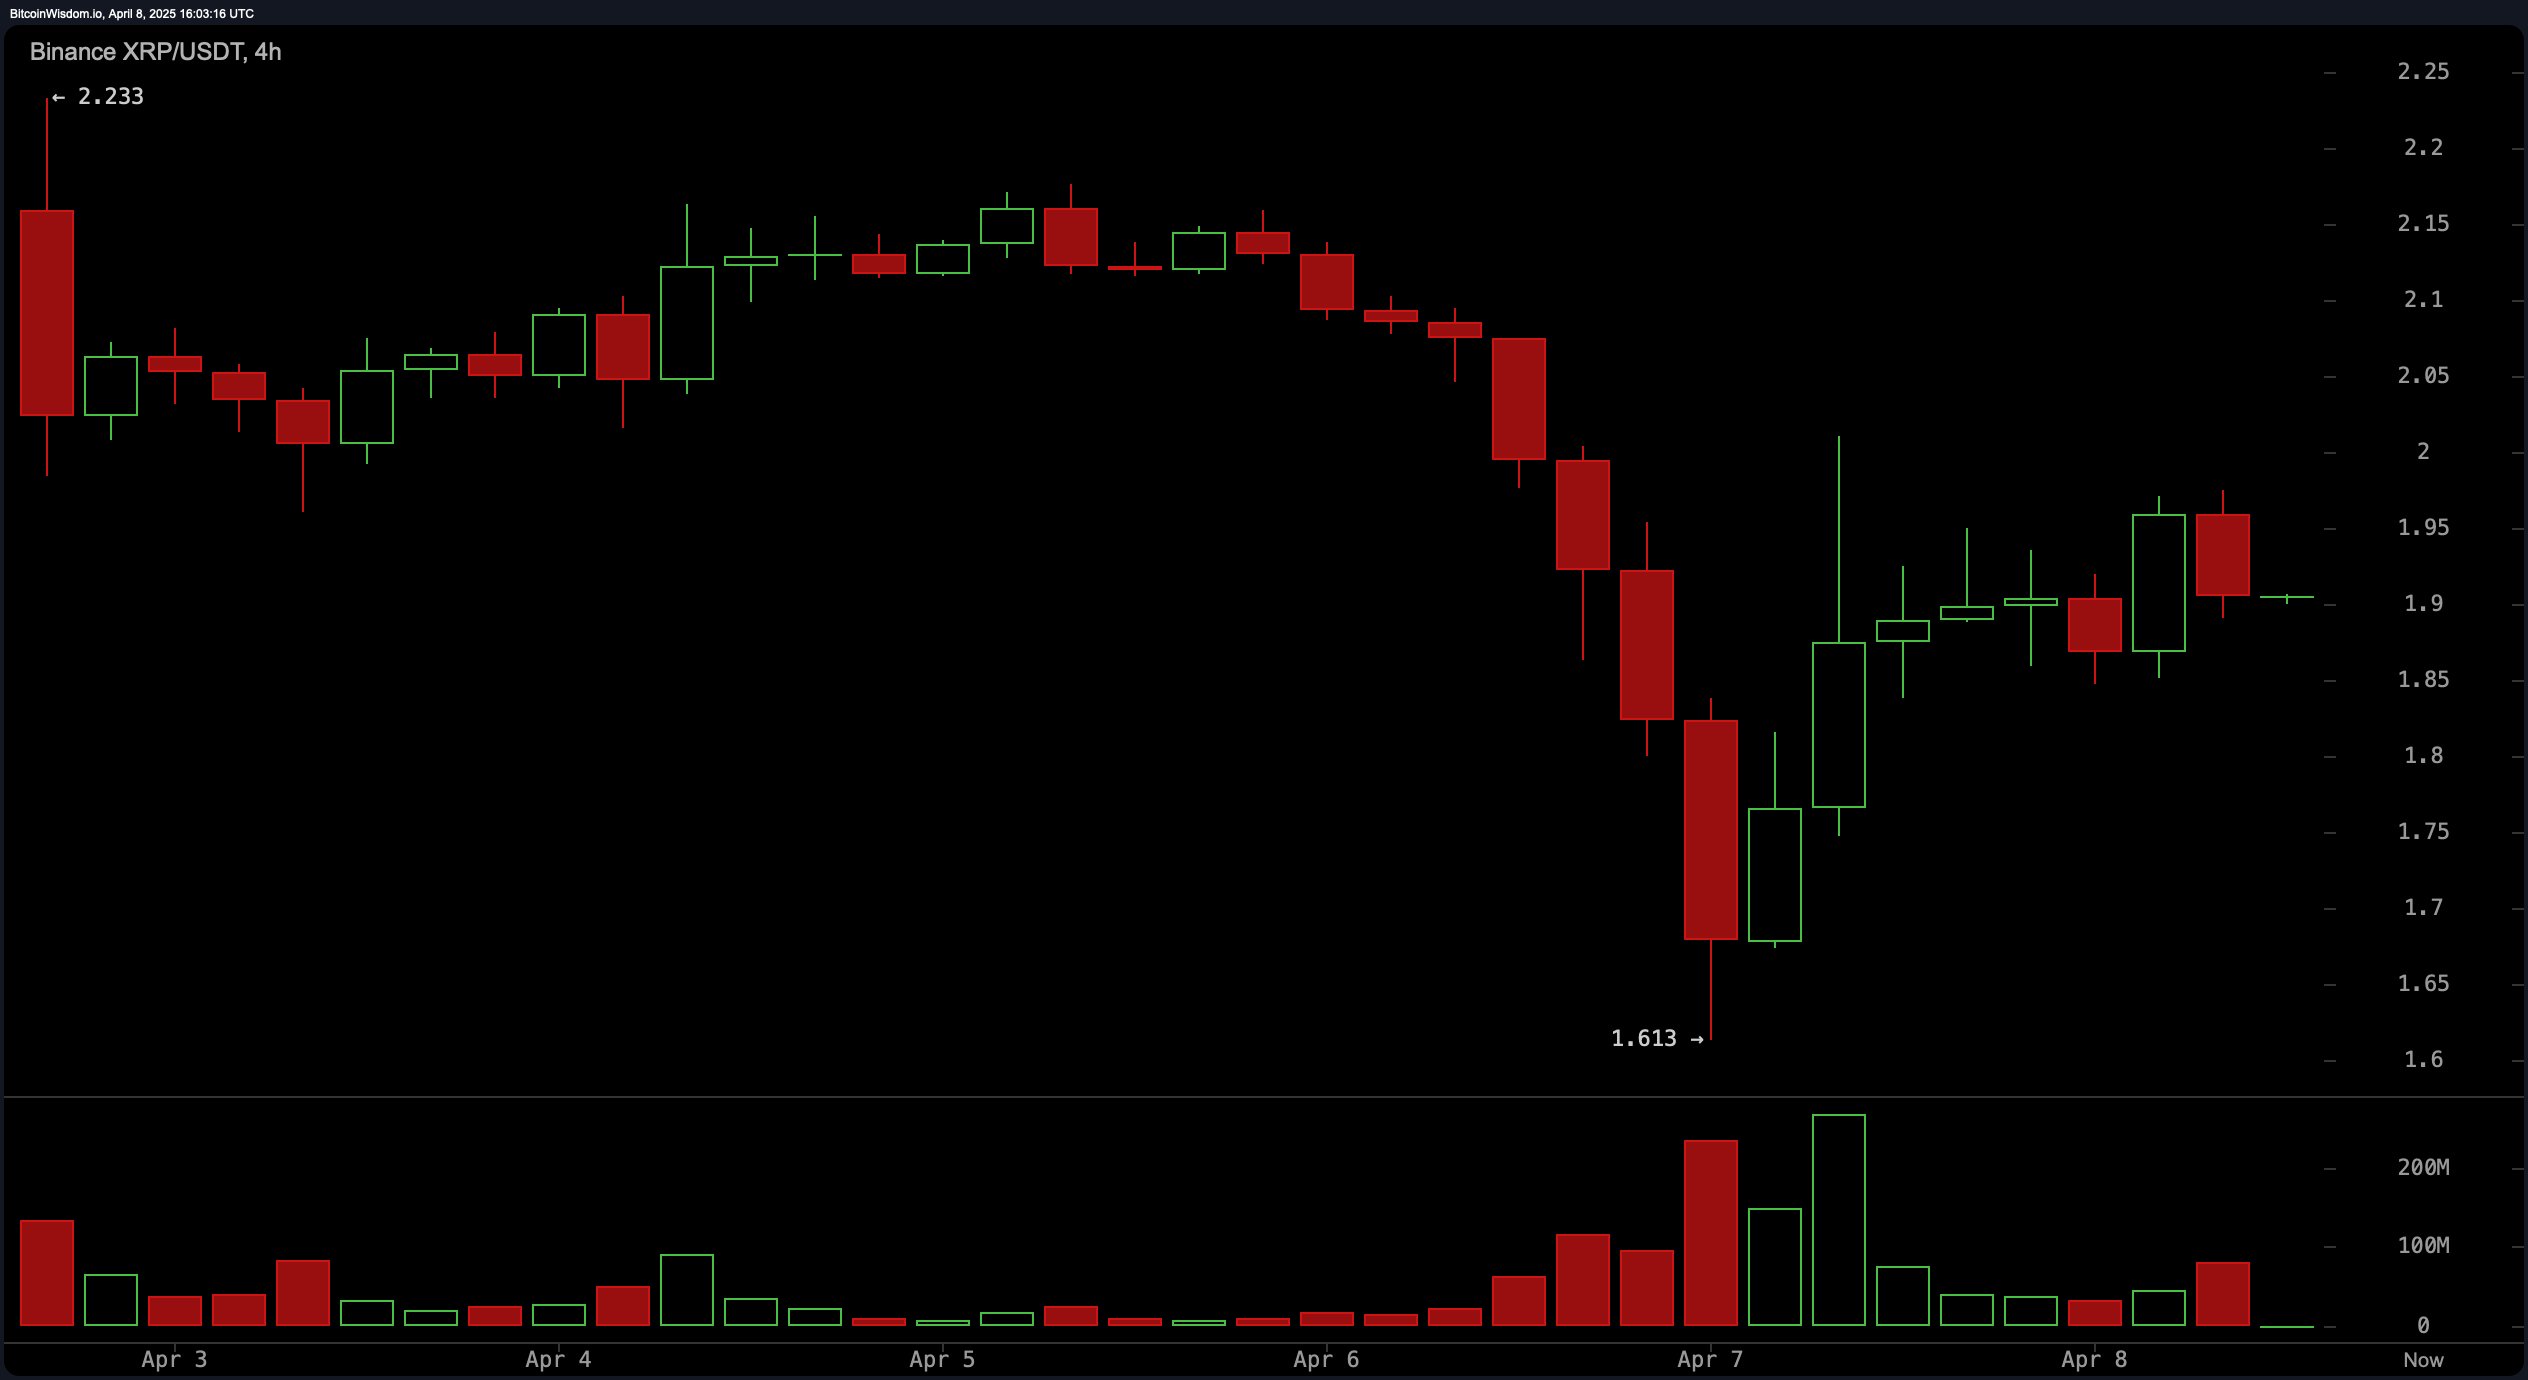
XRP/ USDT via Binance 4H chart on April 8, 2025.
Daily chart signals confirm that XRP remains within a strong downward channel, retreating from a local high of approximately $2.60 to a low of $1.61. Despite the sharp sell-off, a bounce from the $1.61 level has introduced a support base, while the $2.00 to $2.10 range has emerged as a key resistance. Candlestick formations in this timeframe exhibit small-bodied structures post-capitulation, suggesting a potential bottoming pattern or a consolidation range. A daily close above $2.00, especially if volume-backed, may signal a continuation of the recovery, whereas a failure to hold above $1.80 could signal further decline.
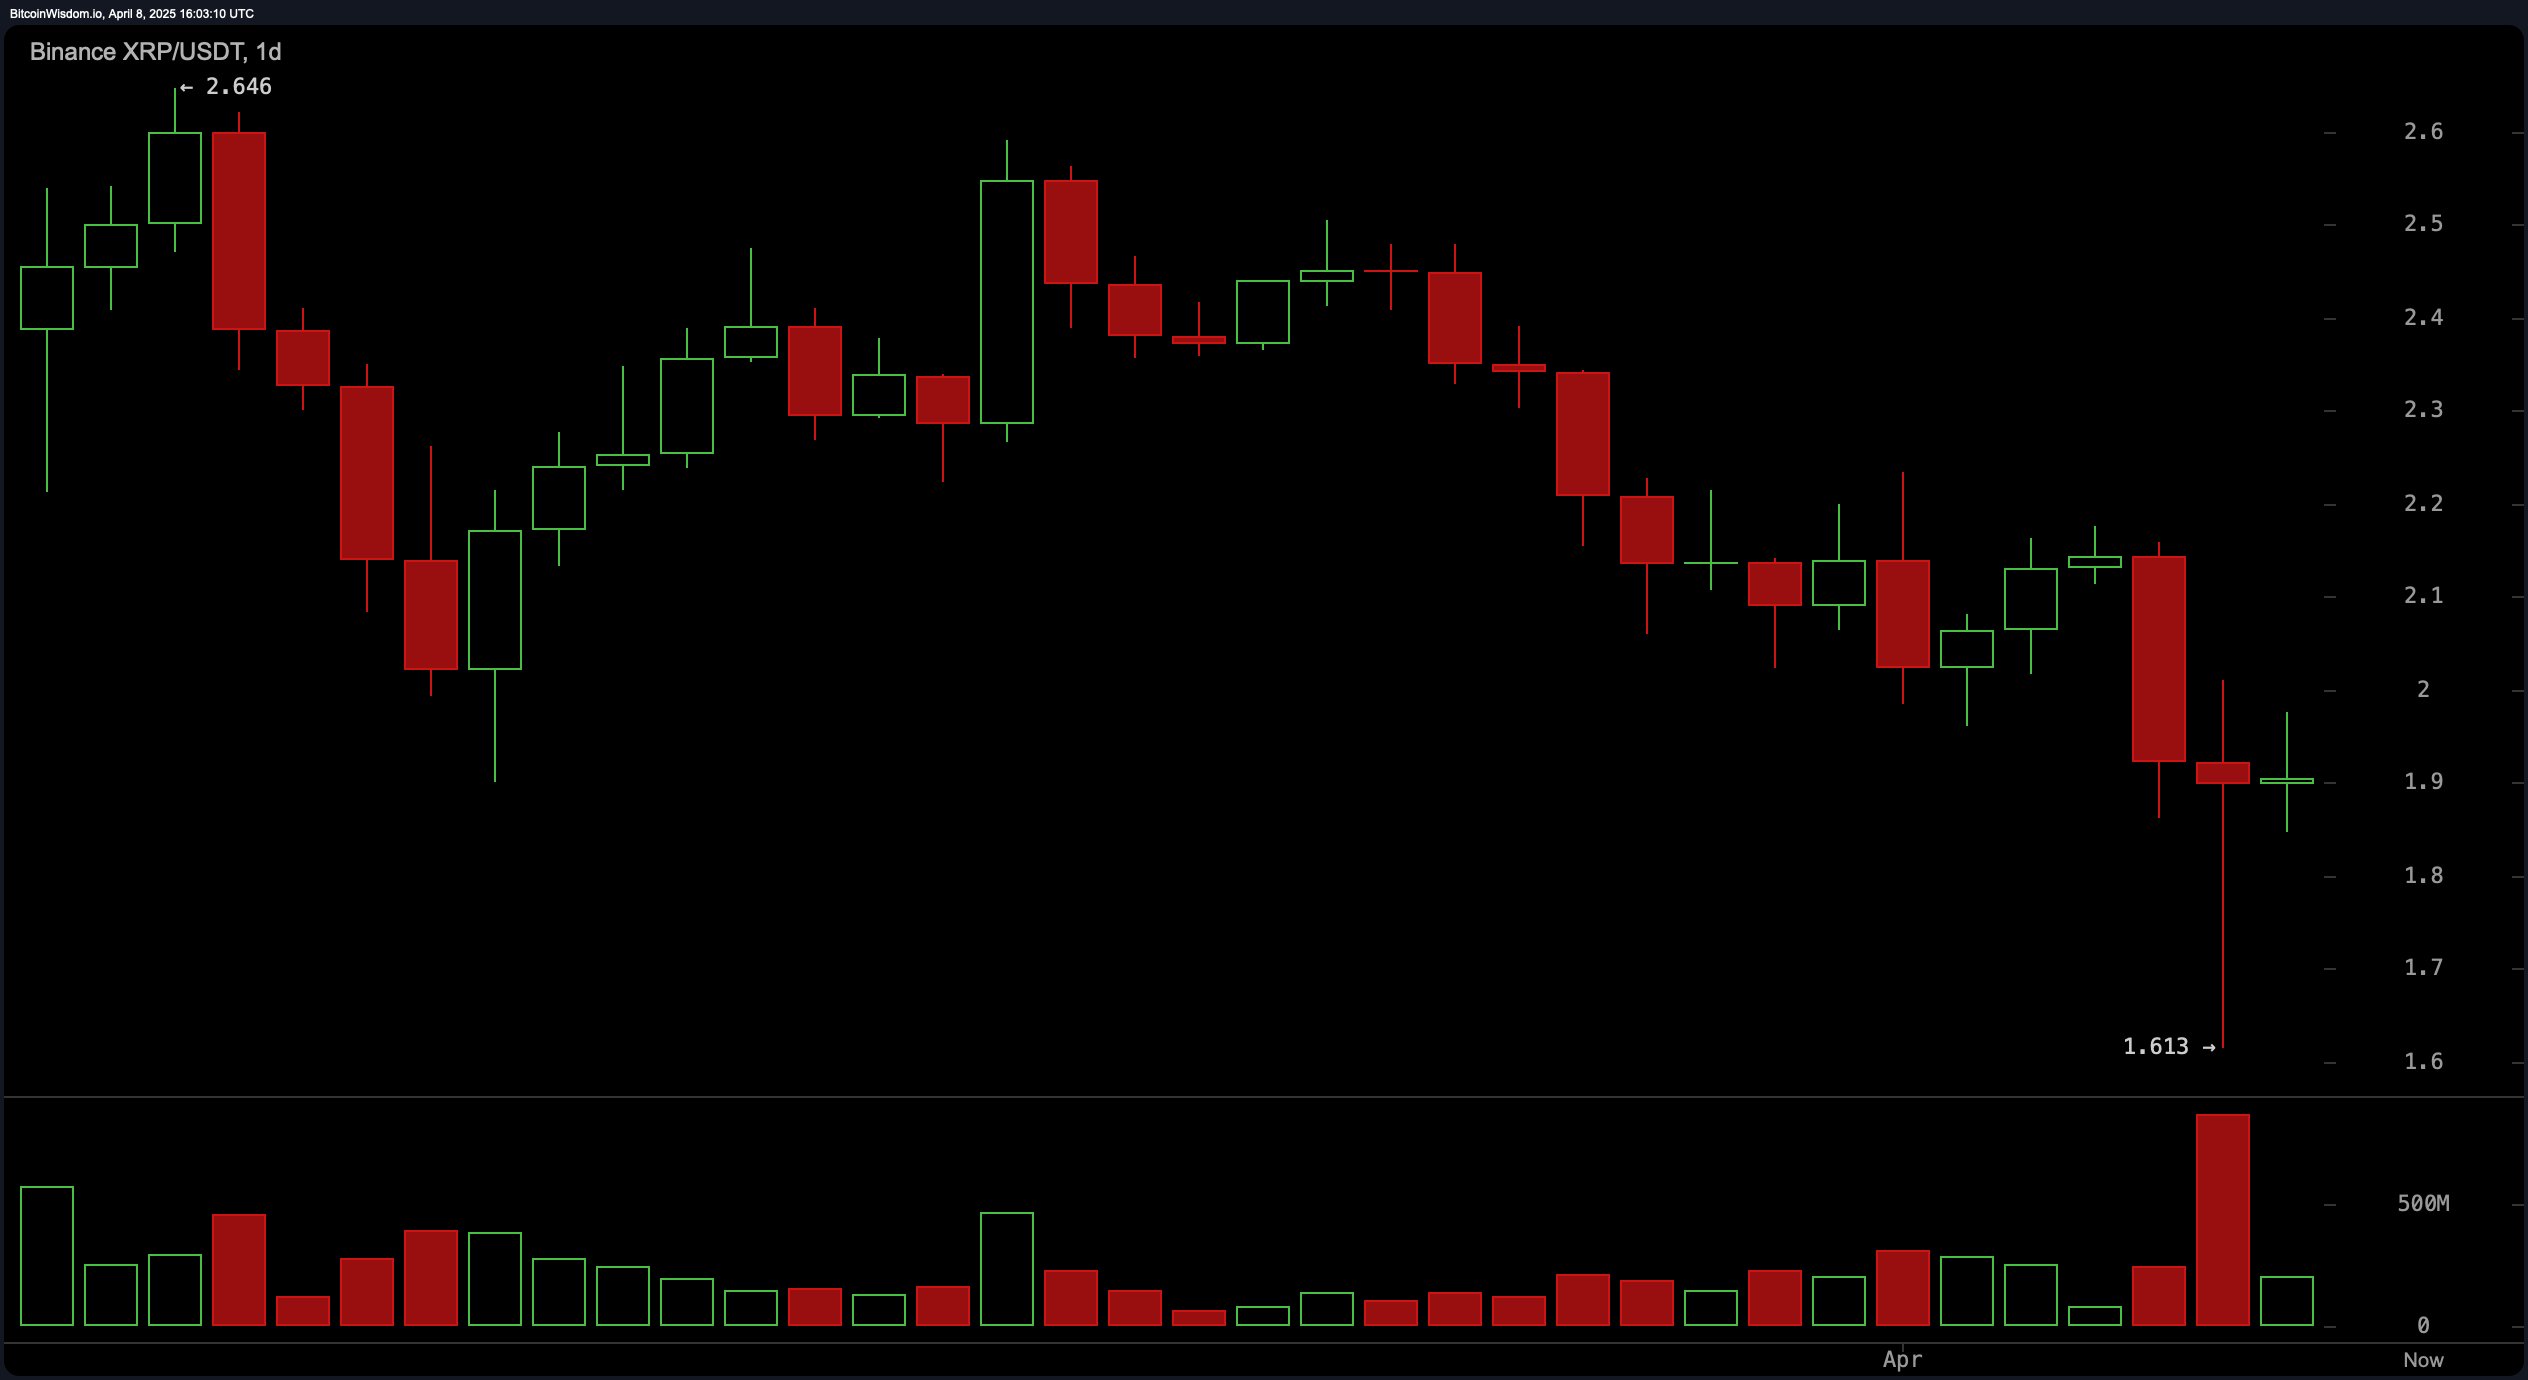
XRP/ USDT via Binance 1D chart on April 8, 2025.
Oscillators on the daily timeframe present a mixed outlook, emphasizing caution. The relative strength index (RSI) is at 35.07, indicating a neutral stance, while the Stochastic oscillator at 25.27 similarly implies indecision. The commodity channel index (CCI) reads −119.00, signaling a potential buying opportunity. The average directional index (ADX) at 22.47 denotes a weak trend. The awesome oscillator is slightly negative at −0.2595, indicating diminishing momentum, while the momentum oscillator at −0.2304 supports a buying stance. Conversely, the moving average convergence divergence (MACD) is at −0.1134, reflecting a bearish signal and suggesting that upside momentum has yet to assert dominance.
The daily chart’s moving averages (MAs) align predominantly with a bearish trend, particularly on shorter to intermediate timeframes. Both the exponential moving average (EMA) and the simple moving average (SMA) across the 10-day, 20-day, 30-day, 50-day, and 100-day periods are signaling negative actions, with values all above the current price of $1.90. The 200-day EMA stands at $1.9481, also indicating an unfavorable sentiment, whereas the 200-day SMA is at $1.8526 and uniquely suggests positivity. This divergence may reflect a long-term stabilization, though the short to mid-term sentiment remains under pressure. Traders should continue monitoring the $2.00 breakout level for potential trend reversals.
Bull Verdict:
If XRP can maintain its current support above $1.85 and break convincingly above the $2.00 resistance zone with rising volume, the technical structure favors a short-term bullish reversal. A decisive daily close above this level could catalyze further gains toward $2.10 and potentially beyond, validating a bullish bias across lower timeframes.
Bear Verdict:
Should XRP fail to reclaim the $2.00 threshold and instead slip below the $1.80 support zone, bearish momentum could reassert itself, driving prices back toward the $1.61 range or lower. With the majority of moving averages and the moving average convergence divergence (MACD) still signaling downward pressure, the path of least resistance remains to the downside unless strong buying interest emerges.
免责声明:本文章仅代表作者个人观点,不代表本平台的立场和观点。本文章仅供信息分享,不构成对任何人的任何投资建议。用户与作者之间的任何争议,与本平台无关。如网页中刊载的文章或图片涉及侵权,请提供相关的权利证明和身份证明发送邮件到support@aicoin.com,本平台相关工作人员将会进行核查。


