This Week's Preview (4.7-4.13), BTC Drops to Levels Seen During the U.S. Election, Only Four Coins Rise This Week!
Table of Contents:
This week's large token unlock data;
Overview of the crypto market, quick read on the weekly rise and fall of popular coins/fund flows in sectors;
Inflow and outflow of spot ETF funds;
BTC liquidation map data;
Key macro events and economic data forecasts and analysis for this week.
1. This week's large token unlock data;
This week, multiple tokens will undergo a one-time unlock. Sorted by unlock value as follows:
Cheelee (CHEEL) will unlock approximately 20.81 million tokens at 8:00 AM on April 13, valued at about $161 million;
Aptos (APT) will unlock approximately 11.31 million tokens at 4:00 PM on April 12, representing 1.87% of the current circulating supply, valued at about $53.7 million;
Saga (SAGA) will unlock approximately 133 million tokens at 4:00 PM on April 9, representing 118.54% of the current circulating supply, valued at about $35.1 million;
Axie Infinity (AXS) will unlock approximately 9.09 million tokens at 9:10 PM on April 12, representing 5.68% of the current circulating supply, valued at about $24.5 million;
Movement (MOVE) will unlock approximately 50 million tokens at 8:00 PM on April 9, representing 2.04% of the current circulating supply, valued at about $18.5 million.
The unlocking of these projects may have varying degrees of impact on the related markets. The above times are in UTC+8, according to CoinAnk data. This week, pay attention to the negative effects brought by the unlocking of these tokens, avoid spot trading, and seek shorting opportunities in contracts.
We believe that the large unlocks of multiple projects' tokens this week may exert significant pressure on short-term prices. First, the scale of the unlock relative to the circulating supply is a core observation indicator. For example, the unlock amount of SAGA tokens accounts for 118.54% of the current circulating supply, far exceeding the market's normal digestion capacity, which could easily trigger a sell-off. Secondly, although the unlock ratios for tokens like APT and AXS are relatively low (1.87%-5.68%), the absolute amounts exceed ten million dollars, combined with the current macro environment of tight market liquidity, which may amplify price volatility.
It is worth noting that the impact of token unlocks on the market has a forward-looking characteristic. Evidence shows that about 90% of unlocking events lead to price declines within 14 days, especially for tokens in the team unlock category, which can average a drop of 25%. Among the unlocking projects this time, both Cheelee and Aptos involve the release of early investor shares, and historical data indicates that the short-term negative impact of such unlocks is particularly pronounced.
From a strategic perspective, the risk-reward ratio for shorting high circulation ratio projects (like SAGA) is relatively reasonable, but caution is needed as some project parties may alleviate selling pressure through price increases. Investors are advised to focus on changes in on-chain chip distribution before and after the unlock, especially the movements of large addresses, rather than solely relying on the unlock values themselves. In the medium to long term, the market will return to the fundamentals of the projects, but in the short term, price corrections caused by supply-demand imbalances are unavoidable.
2. Overview of the crypto market, quick read on the weekly rise and fall of popular coins/fund flows in sectors
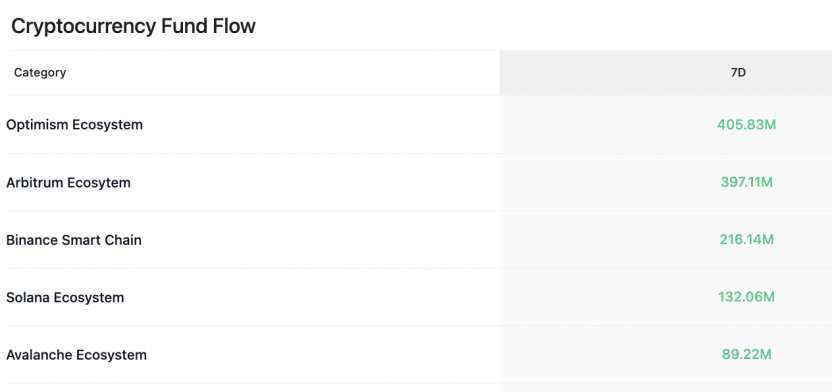
According to CoinAnk data, over the past 7 days, the crypto market, categorized by concept sectors, saw net inflows in five sectors: #Optimism ecosystem, Arbitrum ecosystem, #BSC, Solana ecosystem, and Avalanche ecosystem. The following are the top gainers among the top 500 coins by market capitalization over the past week: #fun, #aergo, CBK, #AQT, and stablecoins have relatively high gains, while other coins generally saw declines, so continue to prioritize trading opportunities in strong coins.
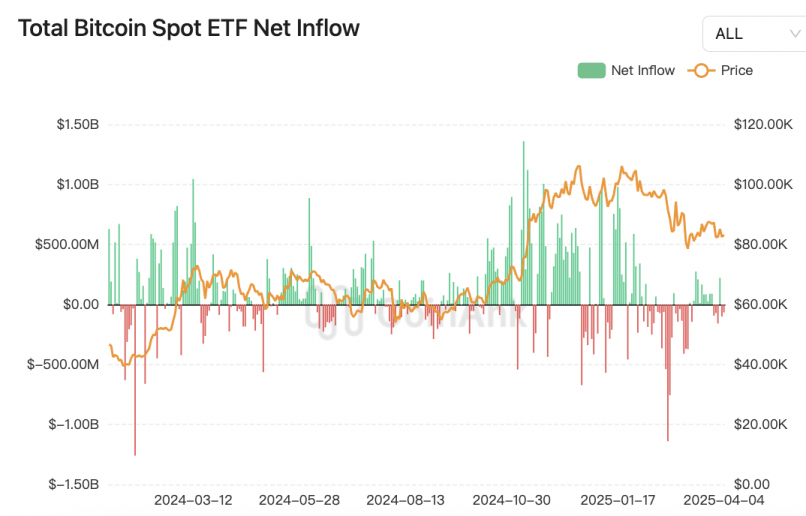
3. Inflow and outflow of spot ETF funds.
According to CoinAnk data, last week, Bitcoin spot ETFs saw a net outflow of $173 million. The largest net outflow was from Grayscale's GBTC, with a net outflow of $95.48 million, bringing GBTC's total historical net outflow to $22.62 billion. Conversely, the largest net inflow was into Grayscale's mini trust ETF BTC, with a net inflow of $34.28 million, bringing BTC's total historical net inflow to $1.15 billion.
We believe that the heterogeneous characteristics of fund flows in U.S. Bitcoin spot ETFs have become more pronounced. Although there was an overall net outflow of $173 million last week, Grayscale's mini trust BTC attracted $34.28 million in inflows, while the flagship product GBTC continued its outflow trend (net outflow of $95.48 million), revealing that institutional investors are executing a "fee migration" strategy—mini trusts have a management fee of 0.15%, significantly lower than GBTC's 1.5%, driving internal fund movements to optimize holding costs.
The structural motivations include threefold logic: first, GBTC has a historical cumulative net outflow of $22.6 billion, yet its assets under management still account for 31.2% of the total net value of ETFs, reflecting a path dependence of existing funds on liquidity; second, the net asset ratio of Bitcoin ETFs remains stable at 5.65%, indicating that the institutionalization process is resilient, with current outflows mainly coming from short-term arbitrage rather than core allocation funds; third, market volatility (BTC 30-day volatility at 34%) has dropped to a low for the year, suppressing high-frequency trading returns, prompting some funds to shift towards lower-volatility gold ETFs (with a net inflow of $2.3 billion last week).
In terms of potential transmission paths, funds migrating from high-fee products to low-cost tools may accelerate the reshuffling within the ETF market, forming an "oligopoly" where the strong get stronger. Currently, Grayscale, BlackRock, and Fidelity control 85% of the market share, and liquidity stratification may exacerbate price manipulation risks. However, the proportion of long-term holders (LTH) of Bitcoin on-chain has risen to 76.8%, potentially hedging against ETF fund disturbances and providing a buffer for the market. In the future, attention should be paid to the timing of the Federal Reserve's policy shift and the resonance effect of ETF fund flows; if expectations for interest rate cuts strengthen, institutions may restart their allocation cycles.
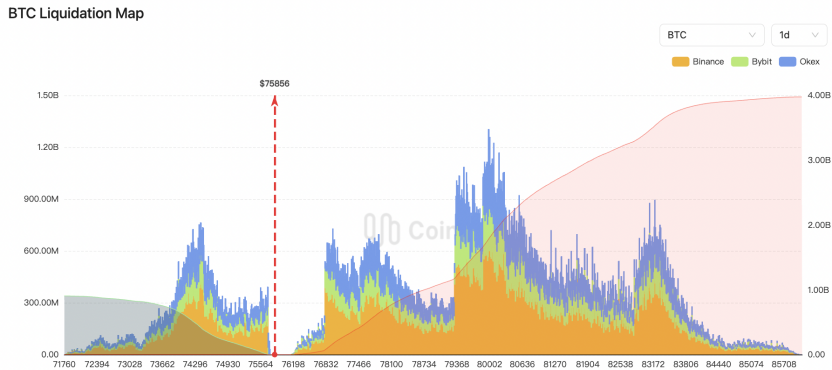
4. BTC liquidation map data.
As BTC drops to the price levels seen during the U.S. election, CoinAnk's liquidation map data shows that if BTC breaks $84,800, the cumulative short liquidation intensity on major CEXs will reach $5.376 billion. Conversely, if Bitcoin falls below $71,760, the cumulative long liquidation intensity on major CEXs will reach $900 million.
We believe that the liquidation thresholds in Bitcoin's current price range ($71,760-$84,800) reveal the focal point of the market's long-short game. If it breaks $84,800, it is expected to trigger $5.376 billion in short liquidations, which could lead to a "short squeeze," where short covering drives prices up rapidly, creating a positive feedback loop. Conversely, if it falls below $71,760, the $900 million long liquidation pressure may exacerbate short-term selling, opening up a downward price channel. It is worth noting that there are significant discrepancies in liquidation data from different sources (for example, the liquidation amount of $72,000 long positions differs by nearly half), reflecting the dynamic adjustments in market position distribution and leverage changes.
On a deeper level, liquidation intensity reflects the risk preferences of market participants. Currently, the volume of short liquidations at high levels far exceeds that of long liquidations at low levels, indicating that investors have strong expectations for breaking previous highs, but the concentration of high-leverage short positions also implies vulnerability. From the perspective of liquidity wave theory, breaking through key price levels can trigger amplified price volatility through chain liquidations, meaning that the intensity of "liquidation clusters" determines the severity of market reactions. It should be noted that historical data shows that Bitcoin has often experienced severe fluctuations near key liquidation thresholds (for example, the $80,000-$86,000 range previously triggered over $2 billion in liquidations), and the current threshold may catalyze a new trend. It is advisable to monitor changes in open contracts and funding rates in the derivatives market to anticipate potential liquidity shock transmission paths.
5. Key macro events and economic data forecasts for this week.
The important macro data to be released this week is as follows:
Wednesday 02:00, San Francisco Fed President Daly will participate in a dialogue event titled "Federal Reserve Economic Outlook and Work."
Thursday 02:00, the Federal Reserve will release the minutes from the March monetary policy meeting.
Thursday 20:30, U.S. March CPI data, and the number of initial jobless claims for the week ending April 5.
Friday 20:30, U.S. March PPI data.
Friday 22:00, U.S. April one-year inflation expectations preliminary value, and U.S. April University of Michigan Consumer Sentiment Index preliminary value.
Friday 23:00, New York Fed President Williams will speak on the economic outlook and monetary policy.
The upcoming U.S. March CPI and PPI data (April 10 and 11) are core observation points. These two indicators will directly affect the market's expectations for a shift in the Federal Reserve's monetary policy, subsequently triggering price fluctuations in crypto assets. If inflation data exceeds expectations, it may strengthen the Federal Reserve's resolve to maintain a high interest rate stance, putting pressure on risk assets, and cryptocurrencies like Bitcoin may face selling pressure. Conversely, if inflation continues to cool, it may boost market bets on interest rate cuts in 2025, providing expected support for liquidity in the crypto market.
Additionally, the Federal Reserve's March meeting minutes (April 10) should focus on two points: first, the officials' assessment of inflation stickiness; if the minutes show more committee members concerned about price rebounds, it may suggest a hawkish policy path; second, the expression of economic risks; if there are mentions of banking sector pressures or signs of economic slowdown, it may weaken interest rate hike expectations. Coupled with speeches from officials like Williams on Friday, there is room for repeated policy signal negotiations, which may exacerbate market volatility.
For the crypto market, short-term trends will be driven by both data and policy expectations. The current market is in a "high volatility, low directionality" state, and marginal changes in CPI and PPI may become the key to breaking the deadlock. If the data reinforces tightening expectations, Bitcoin may test key support levels (such as $60,000); if the data is weak, it may trigger a short covering rebound. In the medium to long term, expectations for a delayed interest rate cut cycle have been partially digested, but if inflation data continues to decline, it may still provide a cyclical basis for rising crypto assets. Caution is needed regarding cross-market risk transmission triggered by geopolitical factors (such as tariff policies) and liquidity tightening.
免责声明:本文章仅代表作者个人观点,不代表本平台的立场和观点。本文章仅供信息分享,不构成对任何人的任何投资建议。用户与作者之间的任何争议,与本平台无关。如网页中刊载的文章或图片涉及侵权,请提供相关的权利证明和身份证明发送邮件到support@aicoin.com,本平台相关工作人员将会进行核查。


