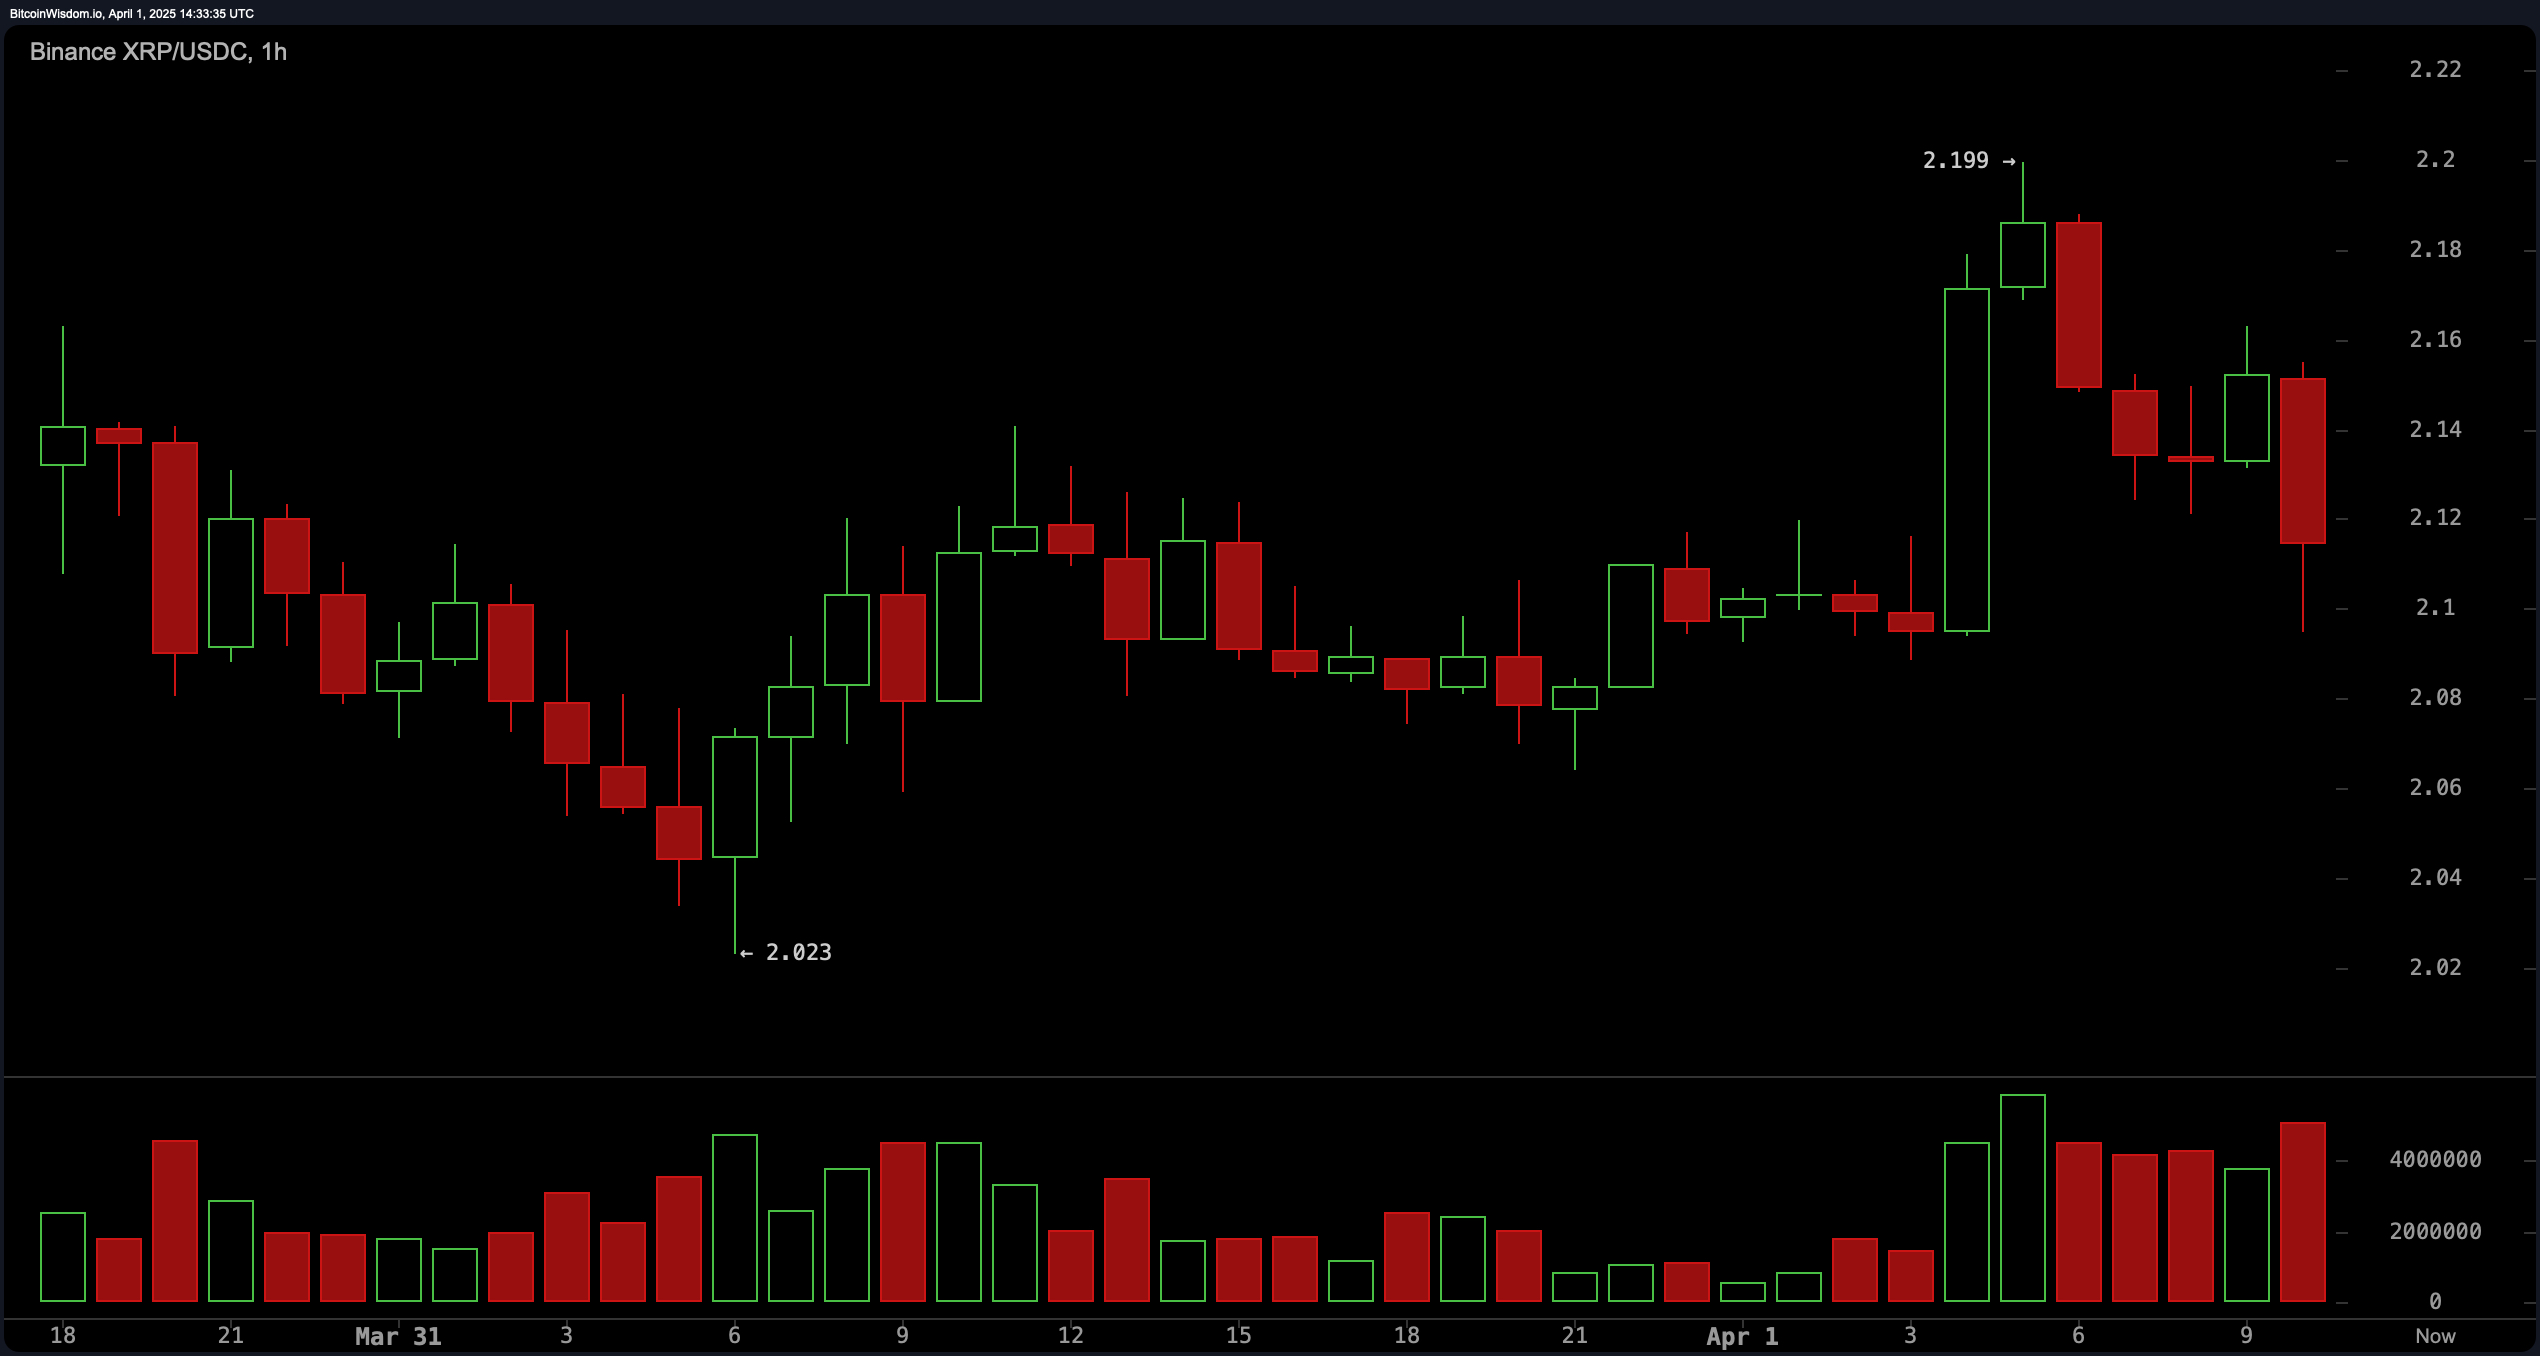
On the 1-hour chart, XRP displays choppy price action with a recent lower high at $2.199, confirming intraday bearish pressure. The support zone at $2.10 has been tested repeatedly, demonstrating resilience but also vulnerability. The rejection near $2.199 implies sellers remain in control at higher levels. Intraday traders may consider short positions if XRP breaks cleanly below $2.10, targeting the $2.02 zone. Conversely, holding above $2.10 allows for potential scalp opportunities toward $2.18 to $2.20, albeit with cautious optimism given the weak bullish response and limited momentum.

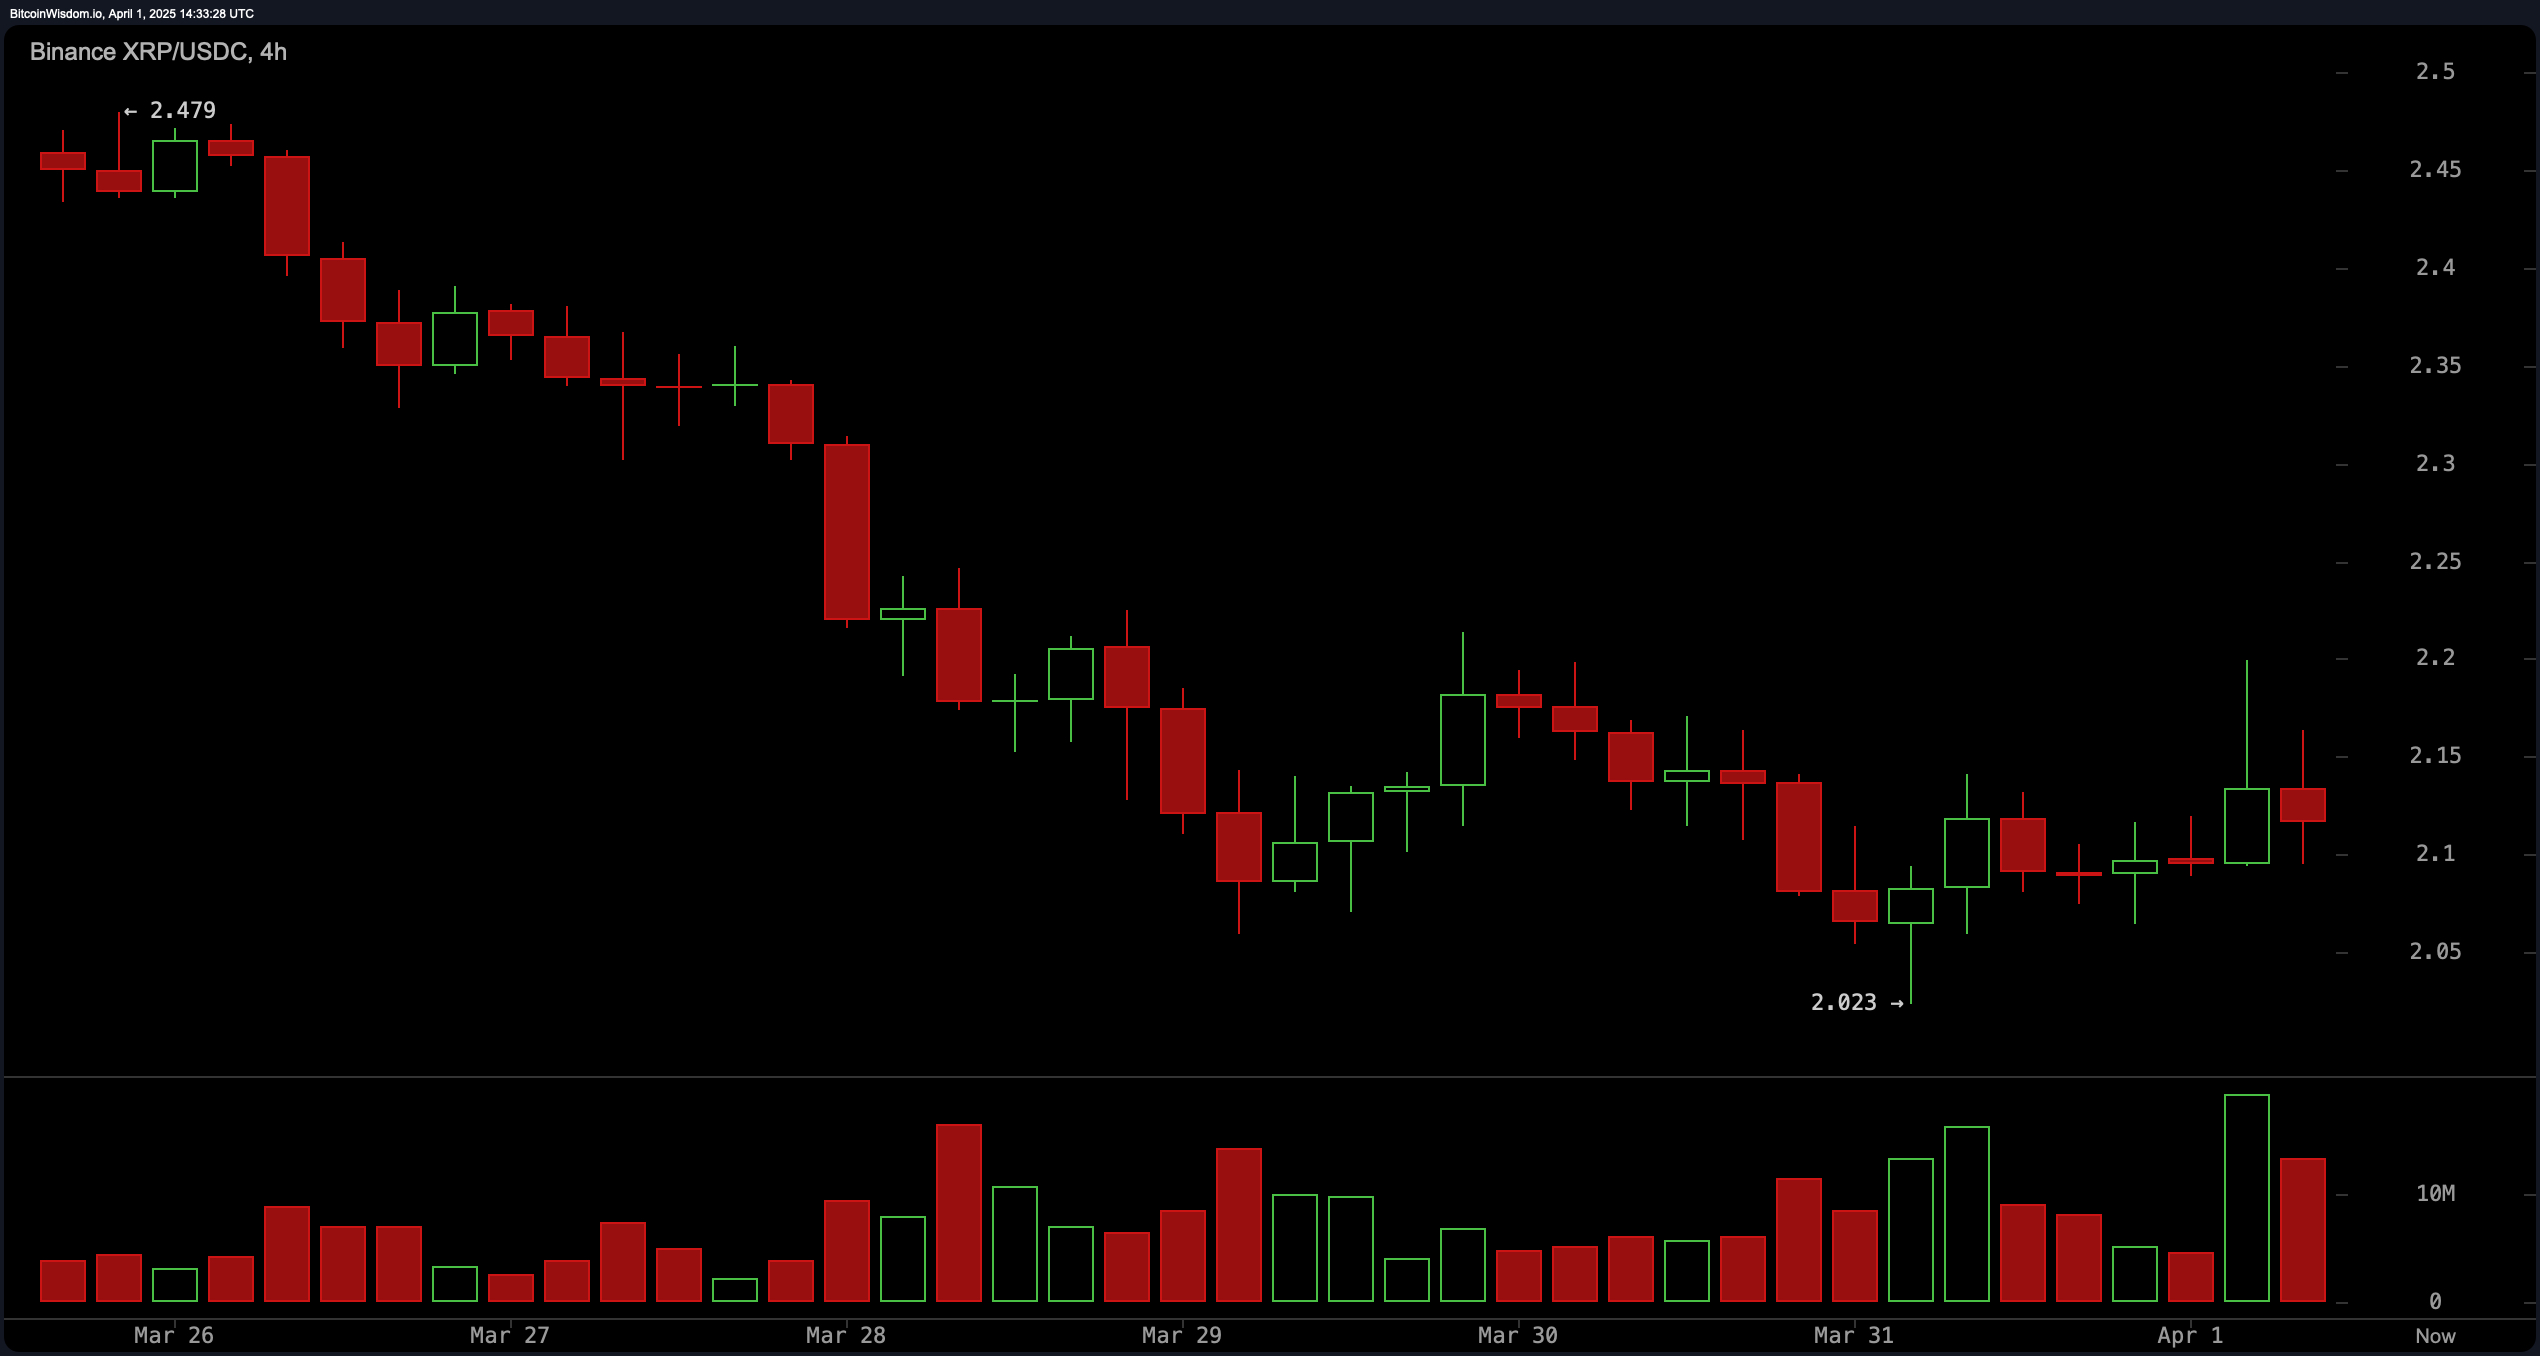
The 4-hour chart portrays XRP in a post-downtrend phase, transitioning into a sideways consolidation pattern. Support has solidified near $2.02, while resistance at $2.15 to $2.20 has capped recent upward attempts. The uptick in volume on bearish candles near resistance suggests potential bull traps, implying sellers might be distributing. Should the price close decisively above $2.20 on strong volume, a short-term bullish breakout toward $2.40 could unfold. However, any failure to maintain the $2.10 level, especially under high-volume selling, may reintroduce downside pressure targeting sub-$2.00 levels.

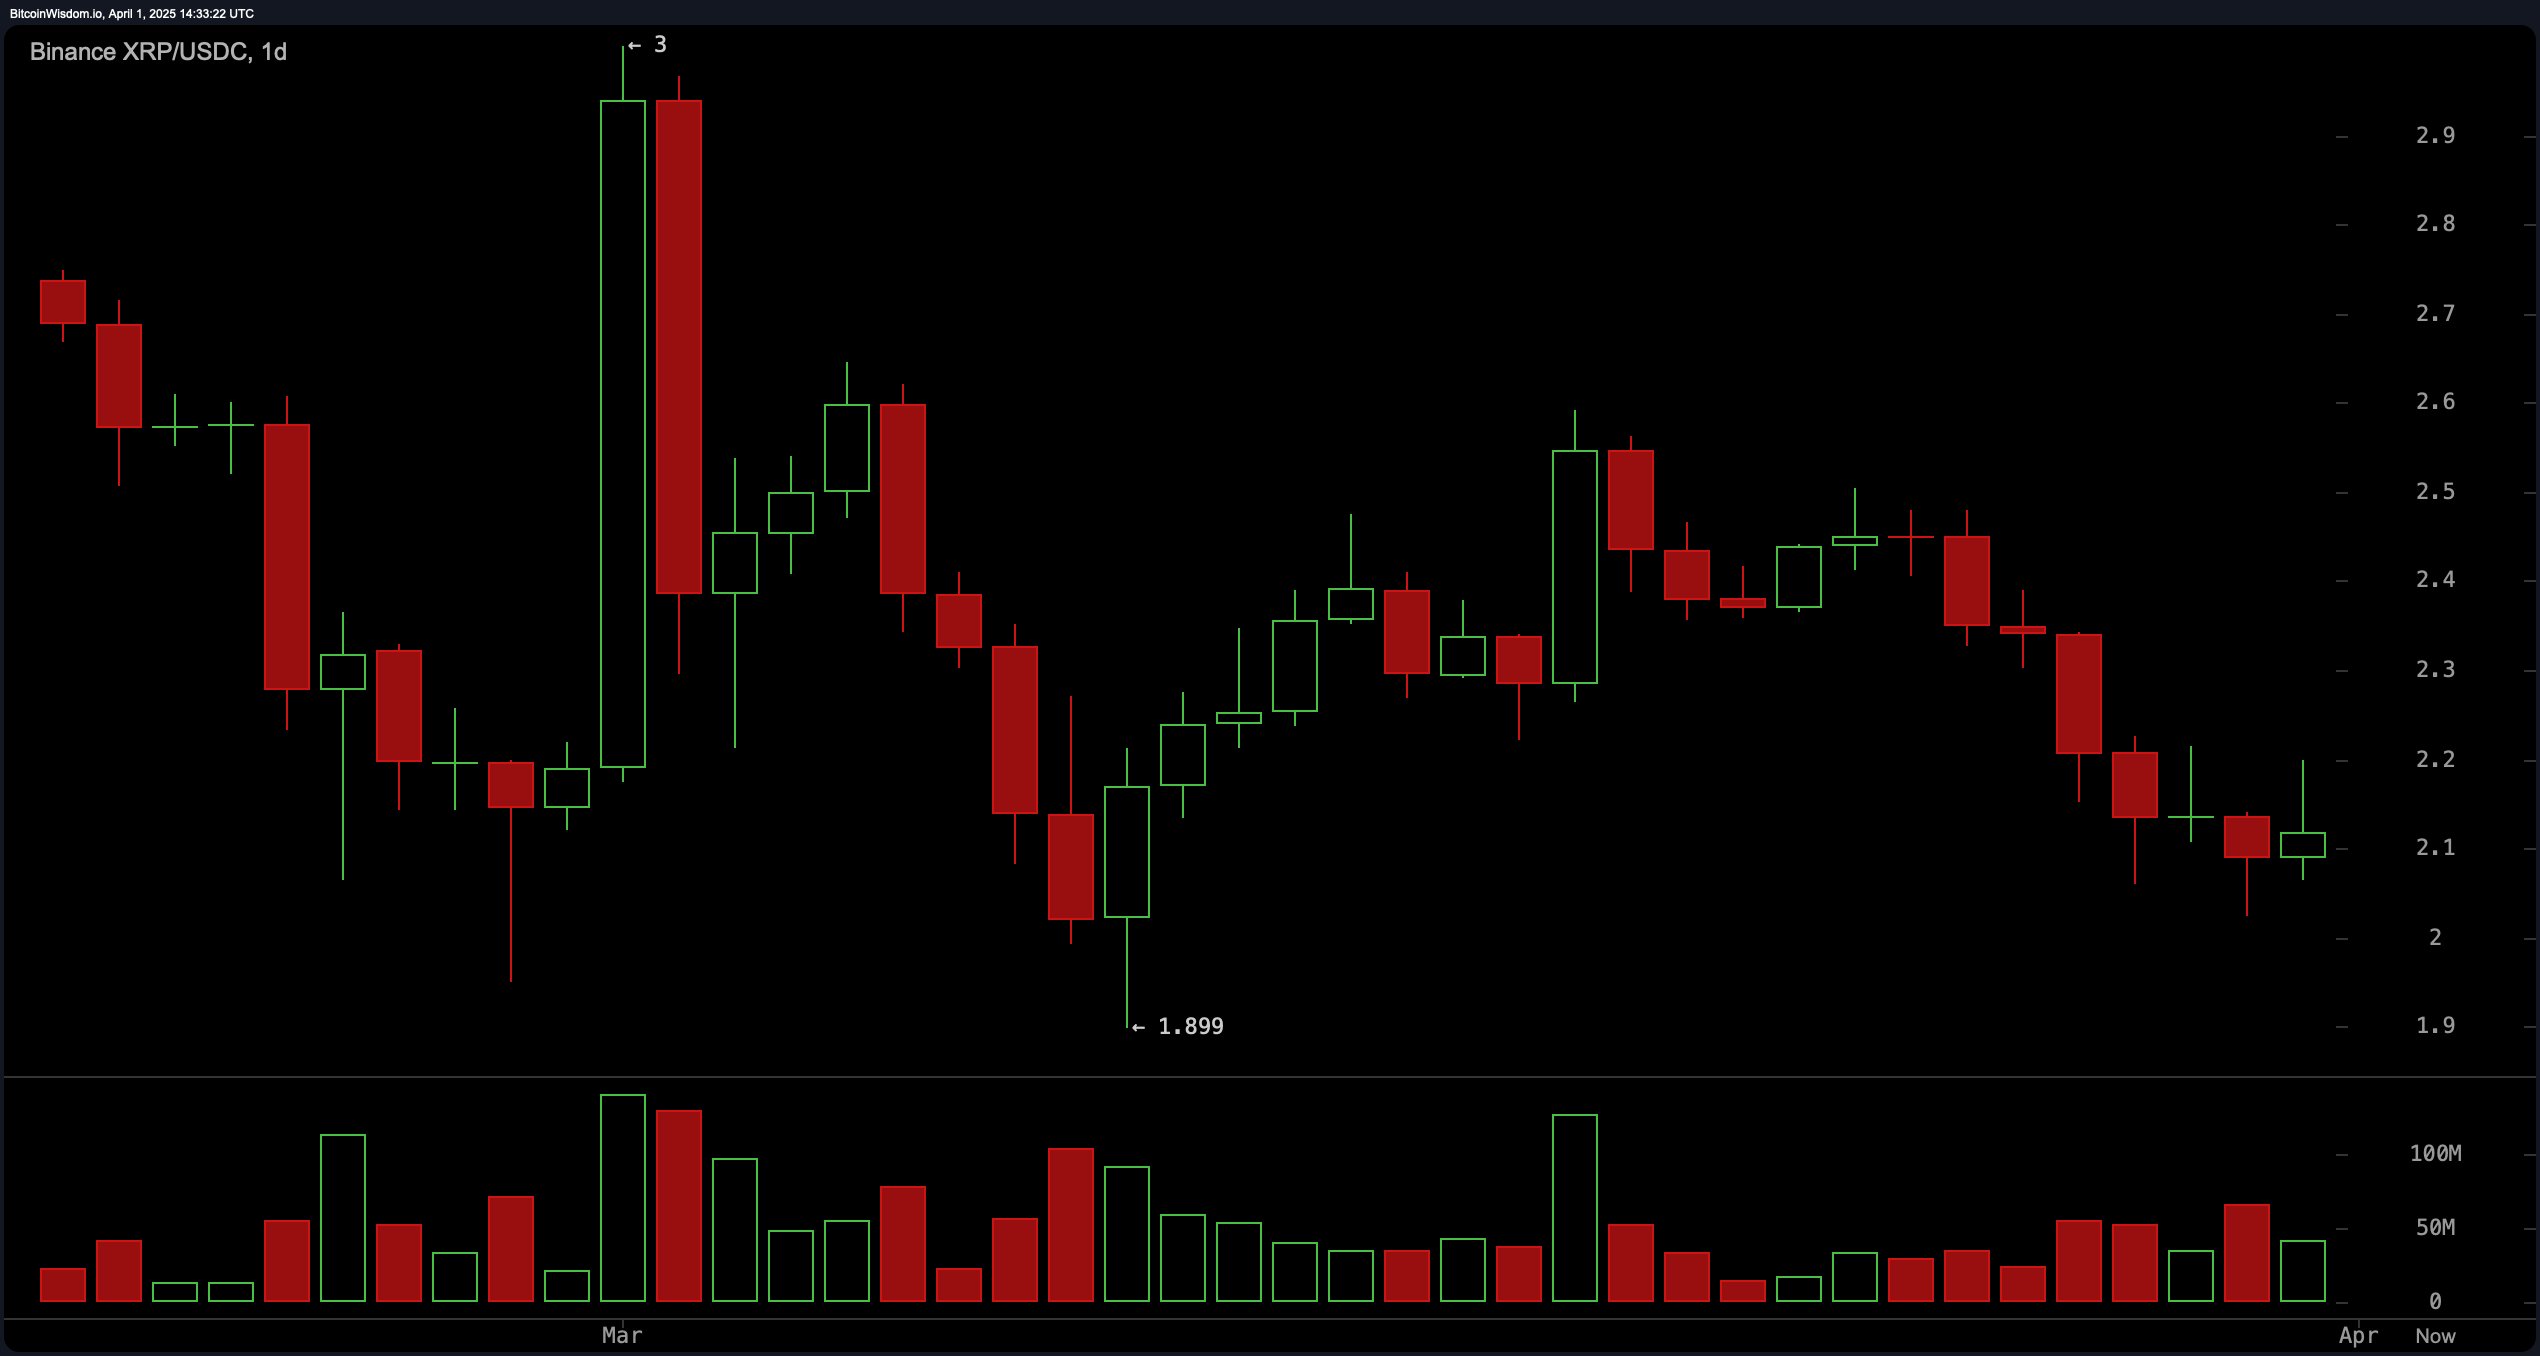
The daily chart affirms a broader short-term downtrend following a peak near $2.90, characterized by a bearish engulfing pattern and lower highs. Key support exists around $1.90 to $2.00, aligning with previous demand zones and strong volume responses. Resistance remains formidable between $2.50 and $2.60, having rejected multiple upward pushes. The volume surge during a prior green candle hints at a blow-off top, succeeded by steady selling pressure. Long positions are more favorable near $2.00–$2.10, provided confirmation through reversal candlestick patterns and volume upticks.

The daily chart’s oscillators provide a mixed but cautiously supportive technical outlook. The relative strength index (RSI) at 39.94980 remains neutral, suggesting the asset is not in overbought or oversold territory. The Stochastic oscillator at 14.29918 also holds a neutral position, albeit near oversold conditions. The commodity channel index (CCI) at −135.11363 indicates bullishness, highlighting potential undervaluation. The momentum oscillator at −0.25519 corroborates a positive signal, suggesting emerging bullish interest. However, the moving average convergence divergence (MACD) at −0.06858 shows bearish signals, reflecting the downward momentum prevailing at present. Both the awesome oscillator and average directional index (ADX) point to a neutral stance, underscoring a lack of strong trend conviction.
XRP’s moving averages (MAs) on the daily overwhelmingly support a bearish outlook in the short to medium term. All key short-term indicators—exponential moving averages (EMA) and simple moving averages (SMA) across 10, 20, 30, 50, and 100 periods—signal negative sentiment, with current prices residing below their respective trend lines. Specifically, the exponential moving average (10) at $2.22150 and the simple moving average (10) at $2.27067 both exceed the spot price. However, the longer-term exponential moving average (200) at $1.94347 and simple moving average (200) at $1.80261 flash a positive signal, suggesting the longer-term trend may still lean bullish despite short-term weakness. This divergence supports a wait-and-see approach, reinforcing the importance of key support levels in determining XRP’s near-term trajectory.
Bull Verdict:
XRP maintains the potential for a bullish reversal if it defends the $2.10 support and breaks above $2.20 with meaningful volume, paving the way for a rally toward $2.40. Oscillator buy signals from the commodity channel index (CCI) and momentum indicators, along with long-term moving average support, hint at latent buying pressure that could reemerge if short-term resistance levels are cleared.
Bear Verdict:
The dominant trend remains bearish across multiple timeframes, with price action repeatedly failing to sustain upward momentum. A breach below $2.10 could invite further downside toward $2.00 or below, especially given the bearish signals from the moving average convergence divergence (MACD) and the consensus of sell signals across nearly all short- and mid-term moving averages. Until the price reclaims and holds above $2.20, sellers retain control.
免责声明:本文章仅代表作者个人观点,不代表本平台的立场和观点。本文章仅供信息分享,不构成对任何人的任何投资建议。用户与作者之间的任何争议,与本平台无关。如网页中刊载的文章或图片涉及侵权,请提供相关的权利证明和身份证明发送邮件到support@aicoin.com,本平台相关工作人员将会进行核查。


