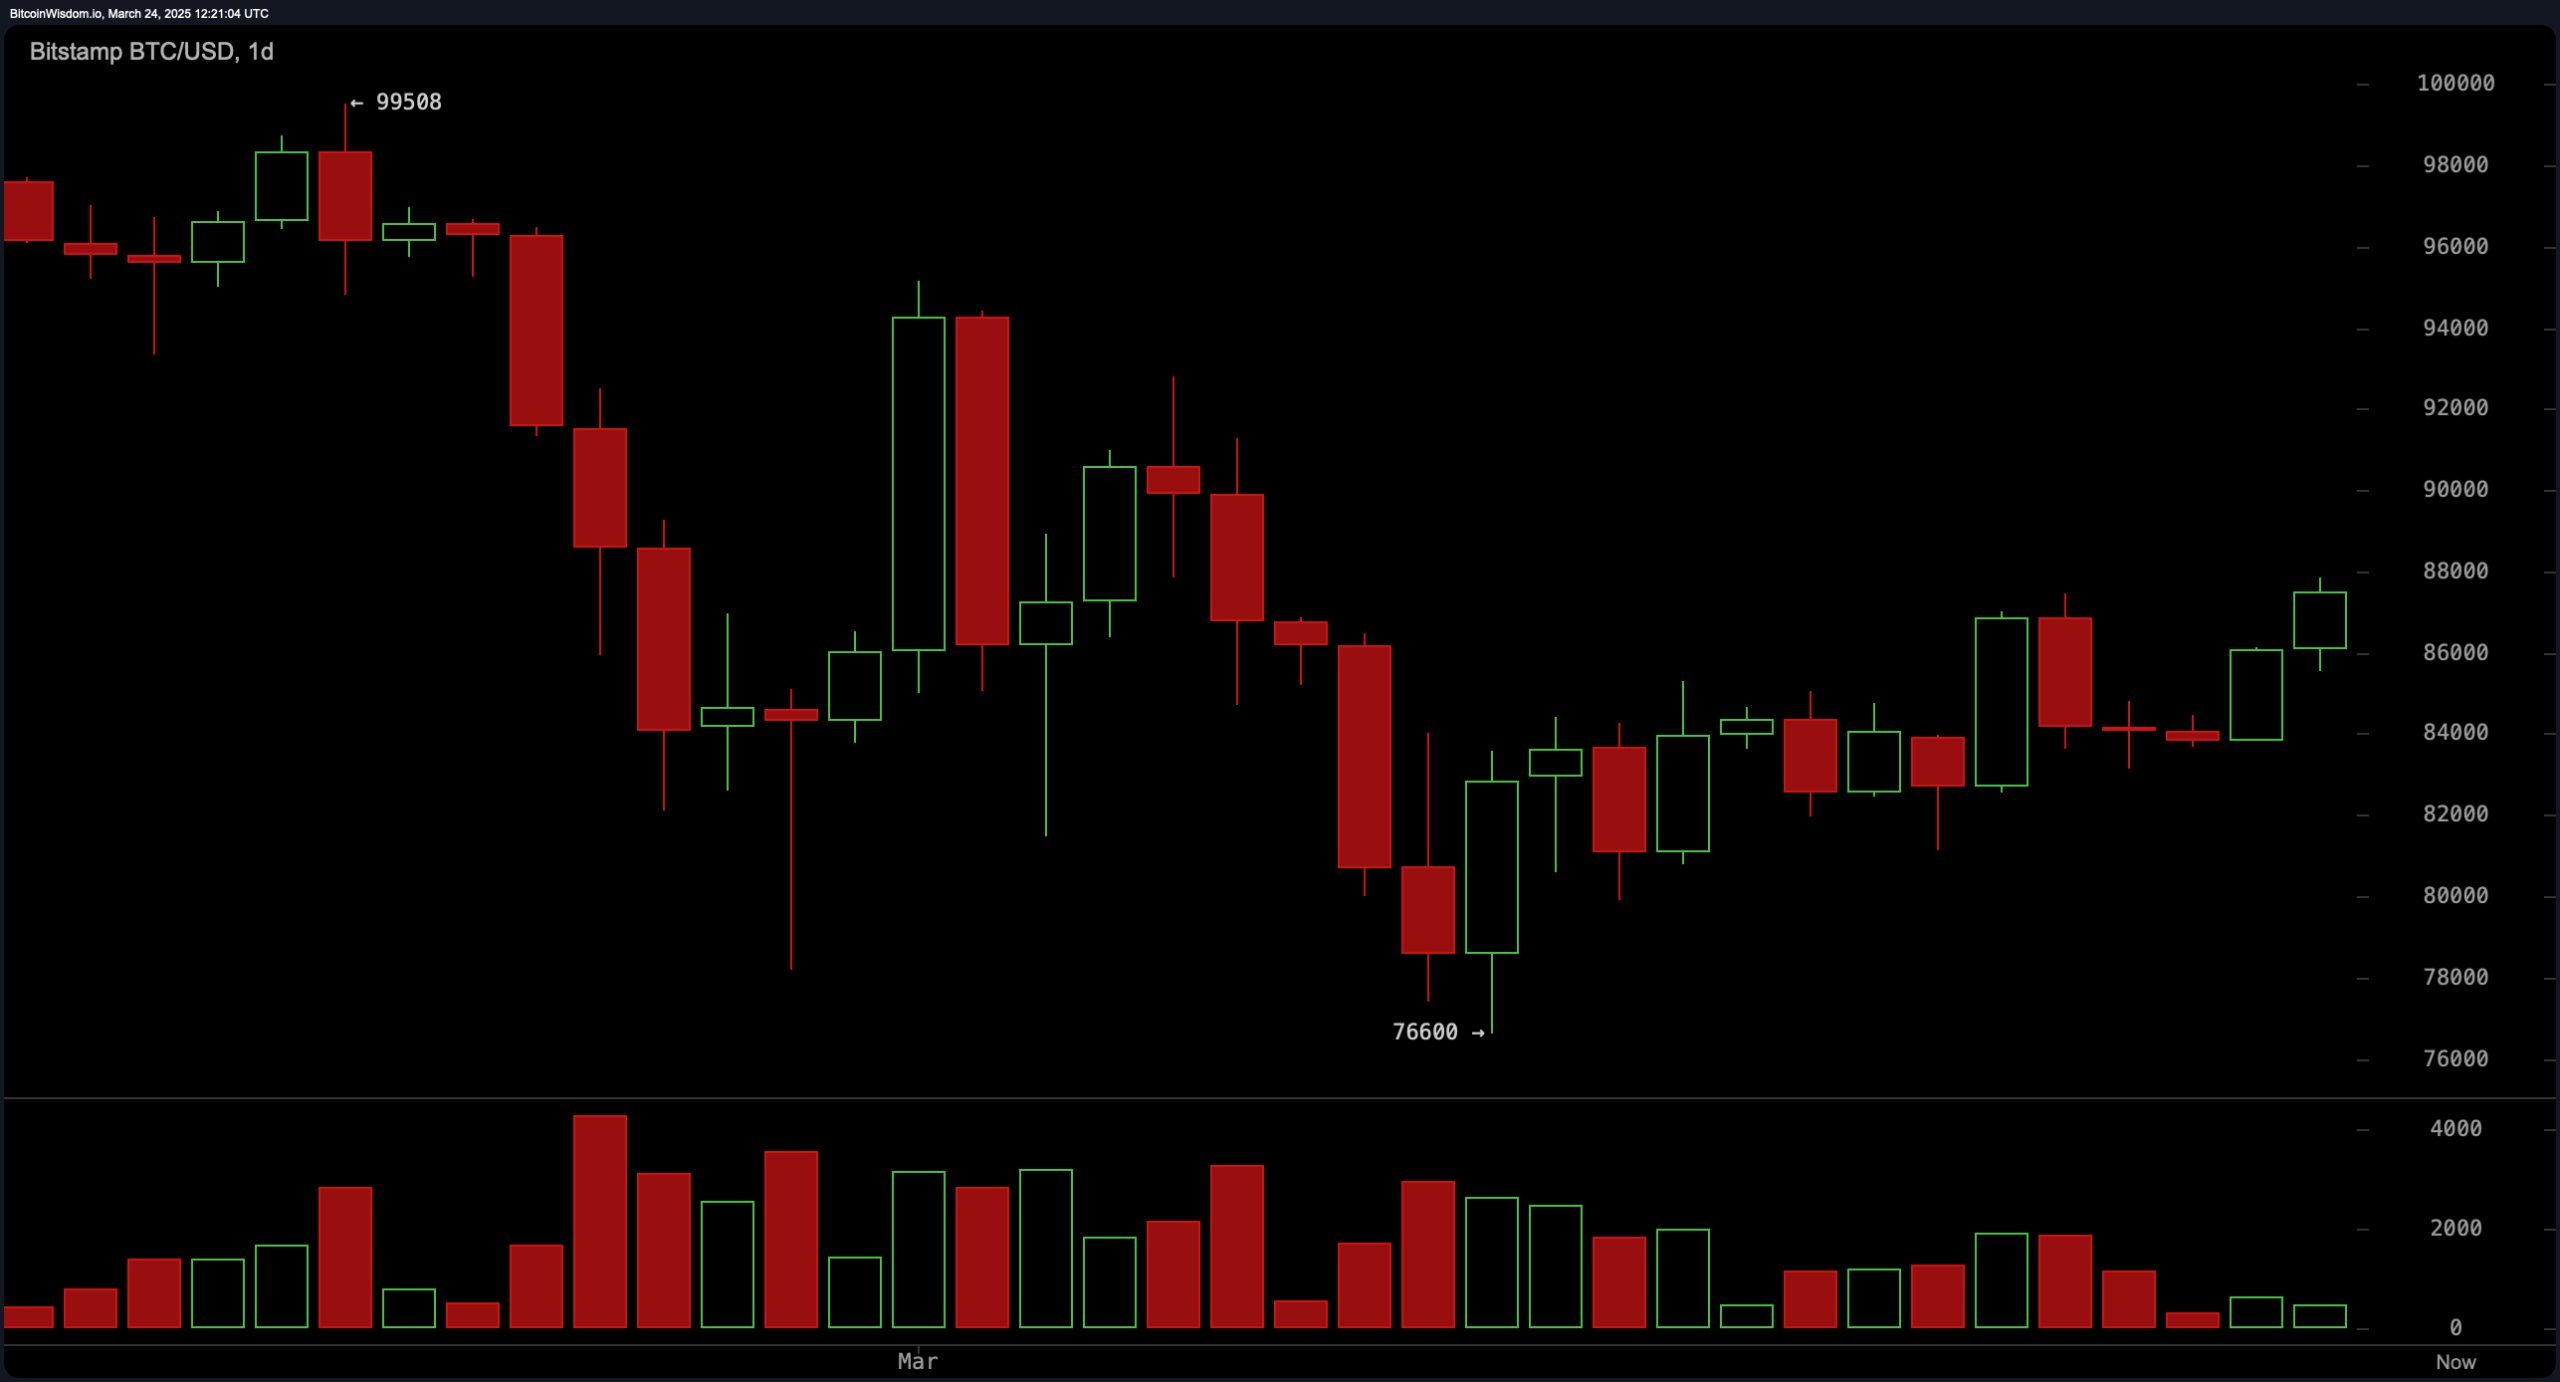
In the daily chart analysis, bitcoin has staged a notable recovery after bottoming around $76,600, rebounding steadily from a recent decline that saw prices fall from nearly $99,500. This structure signals a bullish reversal, underpinned by a potential higher low formation. However, the fading volume accompanying recent upward moves suggests waning conviction, although the pattern of accumulation candles indicates persistent buying interest. Traders eyeing a mid-term swing position may look for a decisive break and close above the $88,000 level, provided it is backed by renewed volume. A drop below $82,000, on the other hand, could reignite selling pressure toward the previous bottom.

BTC/USD 1D chart via Bitstamp on March 24, 2025.
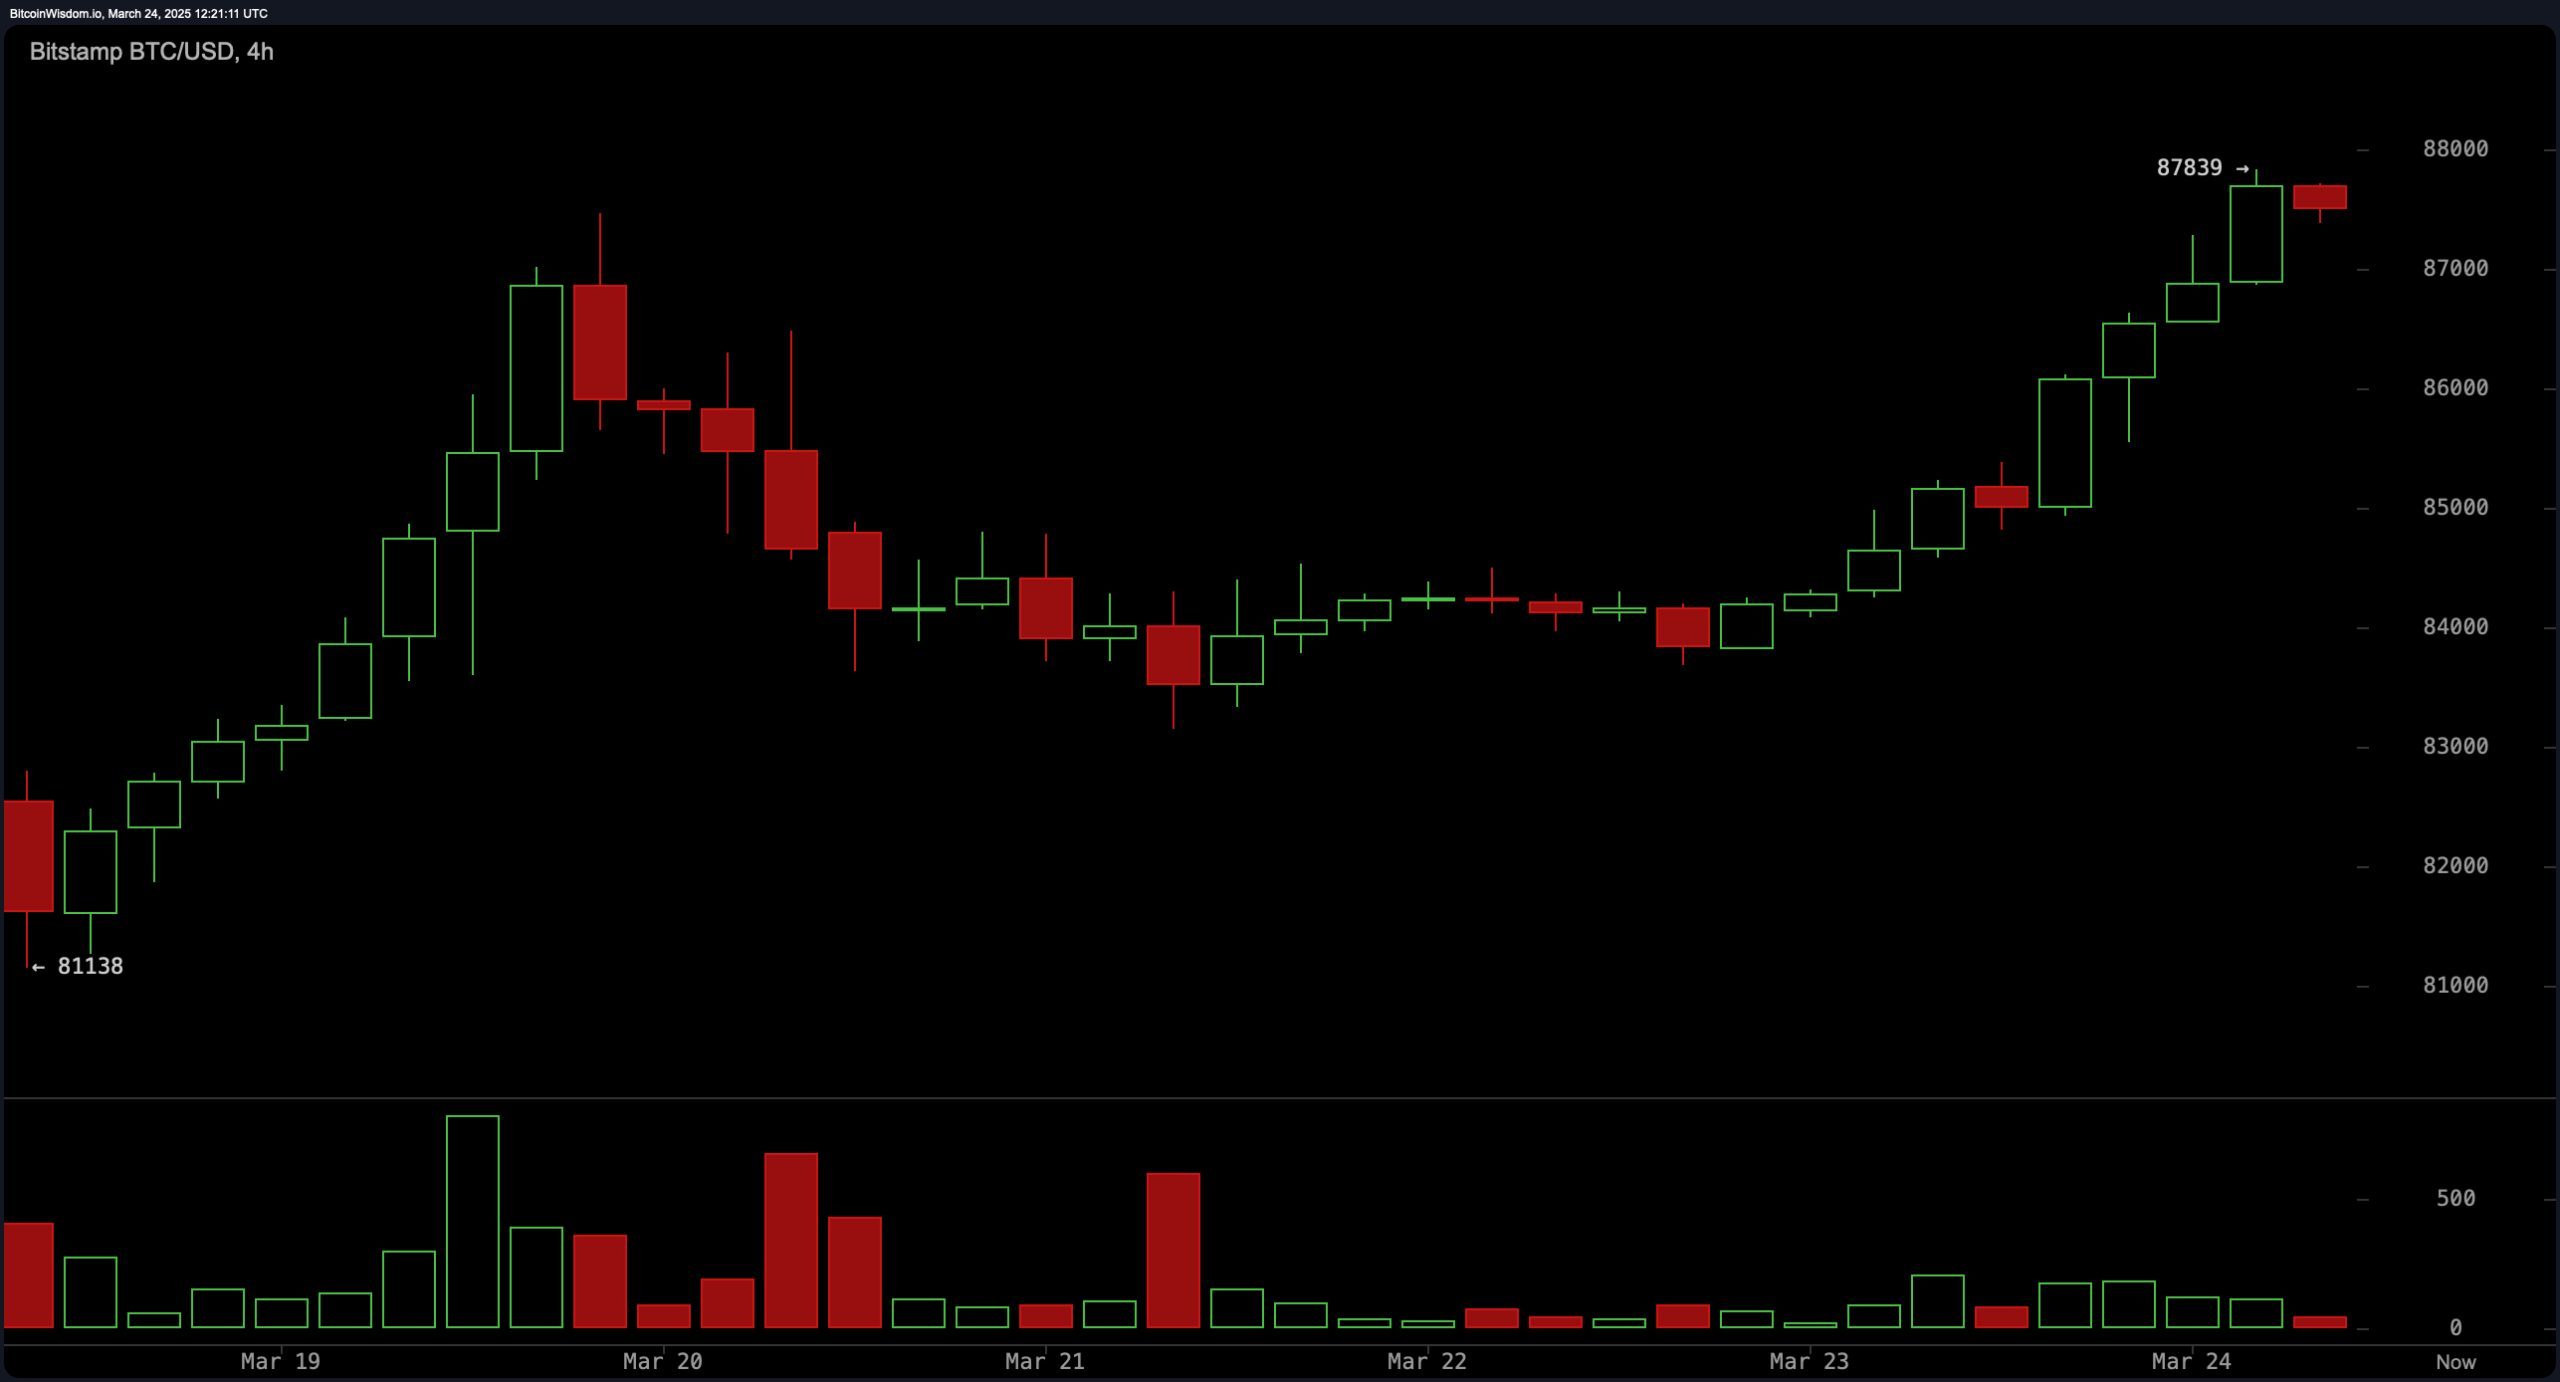
The 4-hour chart further reinforces the short-term bullish narrative, with bitcoin advancing sharply from $81,000 to $87,800. The momentum was accompanied by robust volume during the ascent, although it has since tapered off near the recent highs. A red candle forming near $87,800 suggests mild profit-taking or resistance at that level. The structure of higher lows remains intact, indicating the uptrend is technically sound. A favorable pullback entry is situated around the $85,000 to $85,500 support zone, while a move below $83,500 may invalidate the pattern and expose downside risks.

BTC/USD 4H chart via Bitstamp on March 24, 2025.
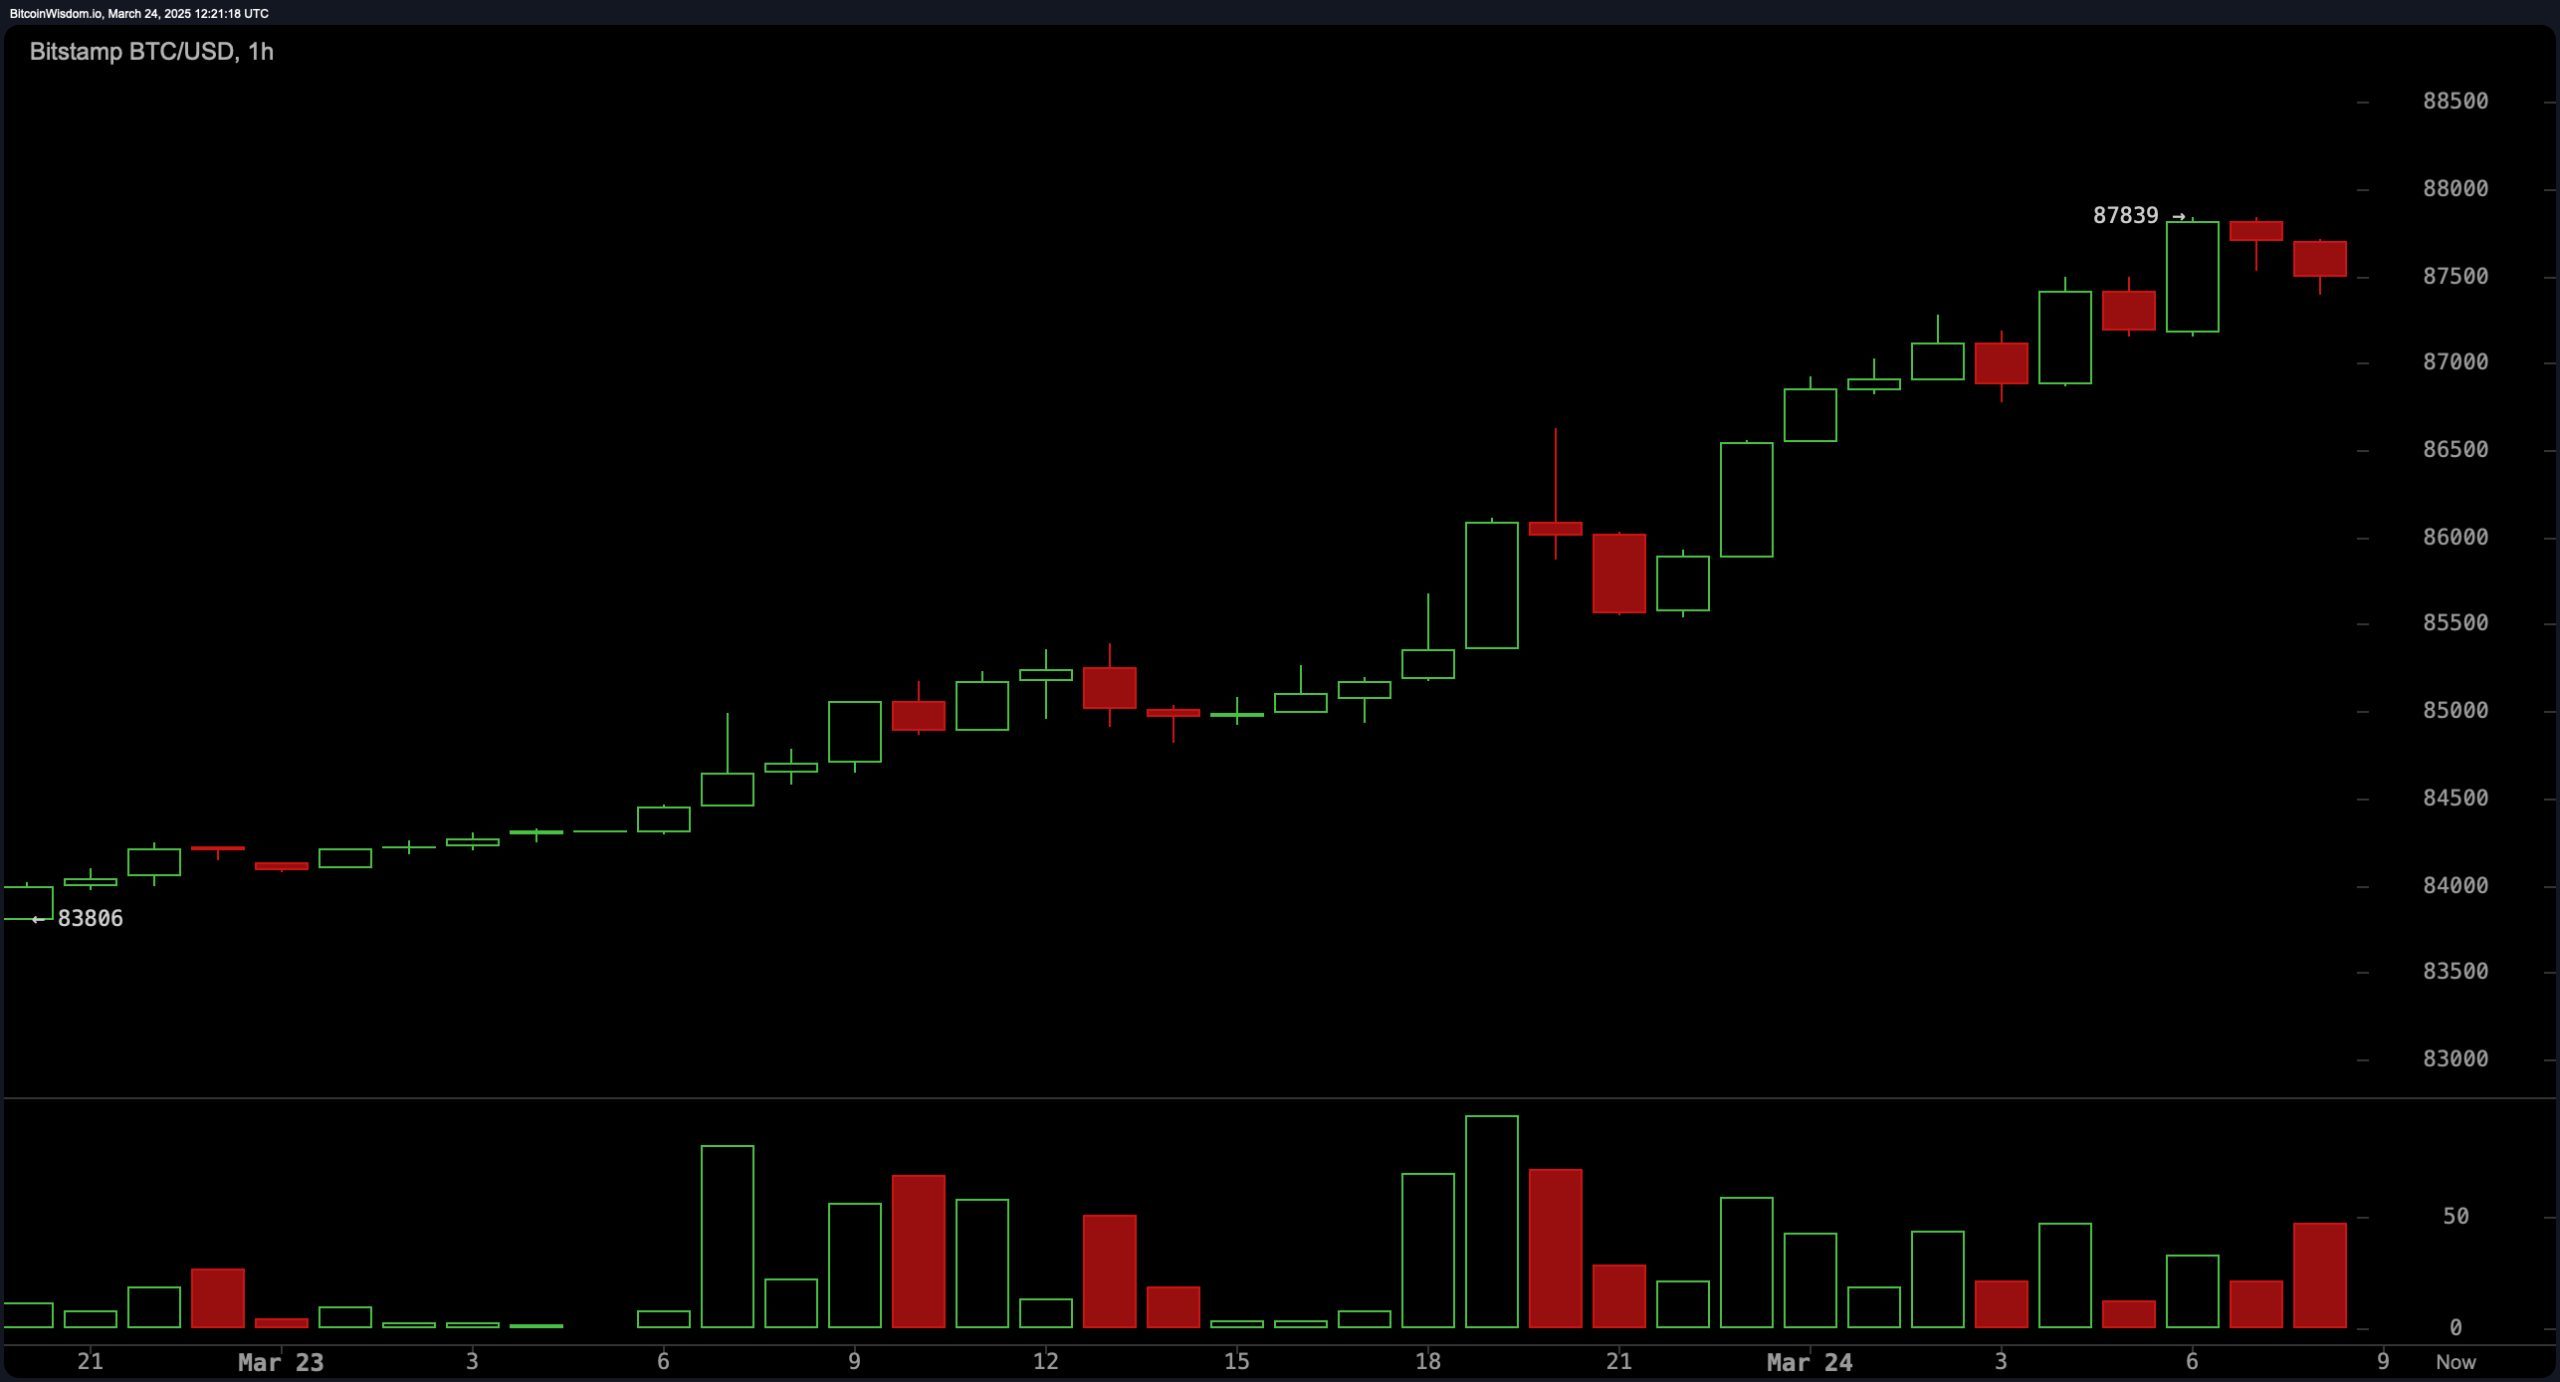
BTC’s 1-hour chart presents a strong intraday uptrend characterized by higher highs and higher lows, showcased by surging volume during upward price movements. Short-term resistance has emerged near $87,800, evidenced by upper wick rejections, hinting at potential exhaustion. Nonetheless, the market remains constructive, and a brief correction toward the $86,500 to $86,800 range may offer scalping opportunities. If price action falls below $85,500, it would signal a breach in the current microstructure and likely prompt a reassessment of bullish positions.

BTC/USD 1H chart via Bitstamp on March 24, 2025.
A review of technical indicators provides a mixed, yet cautiously optimistic, outlook. All oscillators, including the relative strength index (RSI), stochastic, commodity channel index (CCI), average directional index (ADX), and awesome oscillator, remain neutral, signaling indecision or balance between buyers and sellers. Notably, momentum is issuing a sell signal, contrasting with the moving average convergence divergence (MACD), which is offering a buy signal. These conflicting signals imply a market in transition, where bulls may still have the upper hand, but caution is warranted amid uncertain momentum dynamics.
The moving averages (MAs) present a layered technical perspective. The short- and medium-term exponential moving averages (EMAs) and simple moving averages (SMAs) from 10 to 30 periods are all aligned with buy signals, underscoring current bullish momentum. However, longer-term signals from the 50, 100, and 200-period EMAs and SMAs paint a divided picture: while the 50 and 100-period indicators flash sell signals, the 200-period averages lean bullish. This suggests the rally may have room to continue, but resistance from higher timeframe trendlines could limit the upside unless further buying conviction emerges.
Bull Verdict:
Bitcoin continues to exhibit bullish technical strength across multiple timeframes, supported by higher low formations, favorable moving averages in the short to medium term, and a strong intraday uptrend. As long as price action holds above key support zones—particularly $85,000—and breaks convincingly above $88,000 with volume, the market structure favors continued upward momentum toward recent highs and possibly beyond.
Bear Verdict:
Despite the ongoing rebound, weakening volume on rallies, neutral oscillators, and longer-term moving averages issuing sell signals introduce the risk of a reversal. A failure to sustain levels above $88,000, combined with a breakdown below $83,500 or $82,000, could trigger a deeper correction, potentially revisiting the $76,600 support level as bullish momentum wanes.
免责声明:本文章仅代表作者个人观点,不代表本平台的立场和观点。本文章仅供信息分享,不构成对任何人的任何投资建议。用户与作者之间的任何争议,与本平台无关。如网页中刊载的文章或图片涉及侵权,请提供相关的权利证明和身份证明发送邮件到support@aicoin.com,本平台相关工作人员将会进行核查。


