Gold Hits New Historical High, BTC Volatility Near Monthly Low, AI Analysis Indicates Resistance Above $86,000?
Macroeconomic Interpretation: As gold prices first broke the $3,000 per ounce barrier and set a new historical high this week, the crypto market is experiencing a silent downturn. Coinank data shows that Bitcoin futures open interest has evaporated by over $10 billion in two months. This seemingly severe deleveraging actually hides deeper meanings—just like the undercurrents beneath a calm sea, whales are completing their breathing actions. The current short-term pain caused by crypto market leverage liquidation is clashing violently with the long-term bull market momentum, while the policy swings of the Trump administration hang like the sword of Damocles over this digital gold battle, adding dramatic tension.
The "decluttering" of market leverage is akin to a strong tonic for the bull market's survival. From a technical perspective, the 90-day change rate of open interest has plummeted to -14%, a phenomenon reminiscent of the market recovery after the "Black Thursday" in March 2020. On-chain data shows that the massive chips settled in the $100,000 price range, while temporarily suppressing upward momentum, also build a solid value foundation. The continuous inflow of stablecoin funds nourishes the market like an underground river, and the strong performance of USDT under European regulatory pressure further confirms that the global liquidity network of crypto assets has developed resilience.
The "black swan" group dance on the policy front keeps the market on edge. The trade war risks warned by institutions have materialized into real threats— the S&P 500 index has retreated 8% from its peak, and the Nasdaq index has dropped over 12% this year, with traditional market risk aversion directly reflected in the volatility of the crypto market. Bitcoin's weekly implied volatility has dropped from 91% at the beginning of the month to 49%, a calm before the storm reminiscent of the market's dormancy before the CME futures launch in 2018. Interestingly, despite Trump's sudden embrace of the crypto industry, the capital migration triggered by his tariff policies has led to Bitcoin retreating 20% from its historical high. This quantum entanglement of policy and market resembles Schrödinger's cat box—both bulls and bears are cautiously betting before the regulatory boot drops.
The "cognitive revolution" of institutional funds is reshaping the market landscape. GSR's "Bitcoin Value Discount Theory" reveals the absurd reality of the current market: when the intrinsic value of the underlying asset remains unchanged, a 20% price discount is solely due to fluctuations in risk premium. This shift in valuation logic suggests that the crypto market is transitioning from a wild west era to an institutionalized 2.0 phase. The "seesaw effect" between gold and Bitcoin is becoming increasingly evident, with the VIX index soaring 50% reflecting the collective anxiety of traditional institutions "voting with their feet" amid regulatory fog. However, Bitcoin has yet to complete its ultimate evolution into "digital gold," and this lack of identity recognition is both a risk and an opportunity.
The crypto market is experiencing a clash of ideas in the bull-bear debate. The "bear market theory" from the CEO of CryptoQuant stands in stark contrast to GSR's "bull market narrative," with the market direction depending on the observer's stance. The continuous outflow of ETF funds over the past three weeks has sounded the alarm, but the ongoing accumulation of stablecoins on-chain hides potential vitality. Savvy investors might consider adopting the "Schrödinger strategy": holding spot positions in one hand while reserving cash in the other to defend against black swans. After all, under the iron law of mean reversion in volatility, beneath the calm surface of 49%, there are undercurrents building towards a 70% volatility threshold.
This tug-of-war between leverage liquidation and policy gamesmanship will ultimately forge a healthier foundation. When the market completes the purification process of "removing the false and retaining the true," Bitcoin may break through value constraints with a more robust posture. Just as the Pacific monsoon brings storms yet nourishes all, the current market adjustment may be a necessary rite of passage for digital assets towards maturity. We must remember: in the calculation of pi in the crypto world, volatility is not the denominator but the numerator; it is both a risk premium and a source of excess returns.
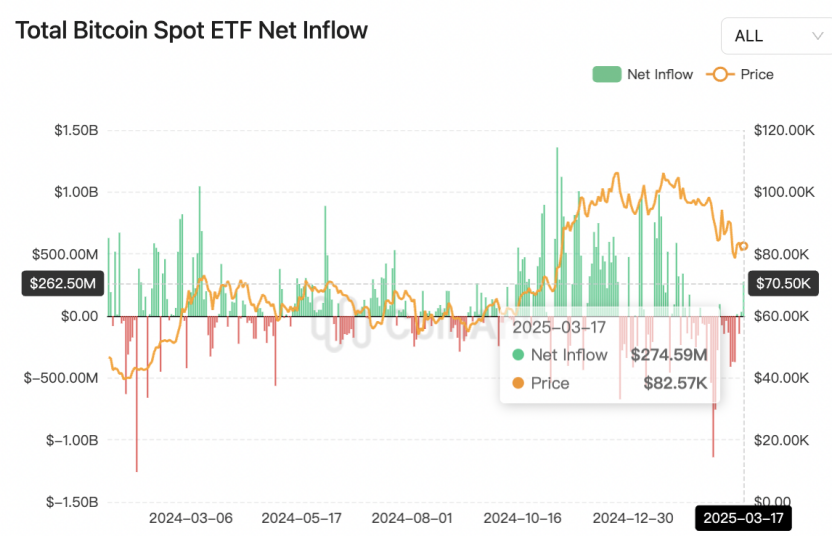
ETF Data Analysis:
Coinank data shows that the US spot Bitcoin ETF saw a net inflow of $275 million yesterday, approximately 3,326.27 BTC. I checked, and this is the highest net inflow since February 4, and the only one to exceed $200 million.
We believe that the single-day net inflow reaching a new high in over a month needs to be interpreted in conjunction with policy expectations, market sentiment, and fund dynamics.
Policy Drivers and Institutional Participation: The Trump administration has been continuously promoting crypto-friendly policies since the 2024 election, including appointing a crypto czar and advancing the FIT 21 bill, creating a compliant environment for institutional funds to enter. The first quarter of 2025 is seen as a critical period for policy implementation, combined with expectations for Bitcoin reserve plans, leading institutional investors (such as pension funds and family offices) to accelerate their positioning, forming a foundation for long-term capital inflow.
Short-term Market Sentiment and Technical Factors: The single-day inflow exceeding $200 million may be related to bullish sentiment. Evidence suggests that investors may be going long on Bitcoin in the spot market while arbitraging futures premiums, amplifying ETF fund volatility. Additionally, rising expectations for Federal Reserve interest rate cuts and a rebound in the US stock market may boost risk appetite, leading to a short-term capital return to crypto assets.
Trend Contradictions and Potential Risks: Despite the impressive single-day inflow, the cumulative net inflow of ETFs since 2025 has been overall weak. As of March, the cumulative net inflow has only increased by $200 million since the beginning of the year, far below the institutional forecast of a $70 billion target for the year. This contradiction reflects that the market is still constrained by the ongoing outflow of Grayscale's GBTC (historically over $22.4 billion) and macroeconomic uncertainties. If the Federal Reserve delays interest rate cuts or the US stock market adjusts, it may suppress further capital inflow.
Conclusion: The capital movement on March 17 indicates tactical accumulation by institutions during the policy window, but whether this can translate into a trend of inflow depends on the progress of policy implementation and external liquidity conditions. In the long run, the role of Bitcoin ETFs as a "bridge between new and old funds" remains unchanged, but short-term volatility risks still need to be monitored.
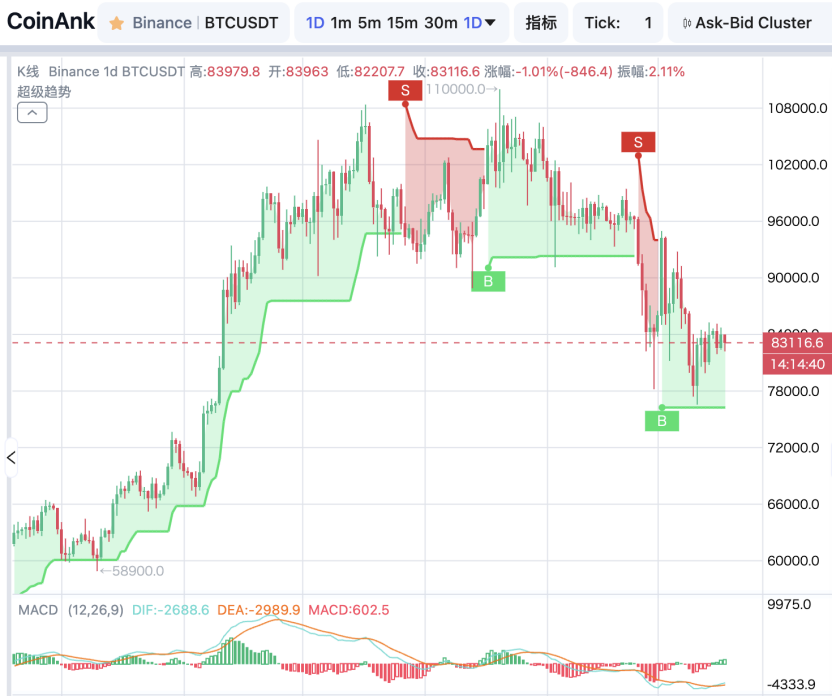
According to CoinAnk AI Smart Analysis, the BTC Market Analysis Report is as follows:
Current major support level: $80,810.40, major resistance level: $86,177.20. Current trend: Slightly bearish.
Technical Indicators Summary:
Moving Average System: MA5=83,738.90, MA10=82,557.32, MA20=85,080.11, MA120=95,793.96. The moving average system shows a bearish arrangement, with both MA5 and MA10 below MA20, indicating a bearish short-term trend.
MACD: DIF=-2,622.34, DEA=-2,976.62, Histogram=354.28. The MACD is in a death cross state, and both DIF and DEA are negative, indicating weak market momentum and dominant bearish forces.
BOLL: Upper Band=92,062.40, Middle Band=85,080.12, Lower Band=78,097.83. The current price is between the middle and lower bands, with %B=0.42%, indicating that the price is in a weak area, leaning towards the lower band.
RSI: RSI6=49.69, RSI12=44.99, RSI14=44.40, RSI24=43.74. The RSI indicator is in a neutral to weak area, not entering the oversold zone, indicating that there is still room for downward movement in the market.
KDJ: K=65.92, D=52.75, J=92.27. The KDJ indicator shows that both the K line and J line are above the D line, but the J line has entered the overbought area, indicating a potential need for a pullback in the short term.
Indicator Data:
Funding Rate: 0.00253900%. The funding rate is in a neutral area, showing no significant bullish or bearish sentiment.
Volume Changes: Recent trading volume has shown a shrinking state, indicating low market participation and a lack of clear directional guidance.
Capital Flow Data: The net inflow and outflow of contract funds and the net inflow and outflow of spot funds indicate that there has been a significant outflow of funds in the short term, suggesting cautious market sentiment.
Analysis Result: Direction: Cautiously bearish, Entry Timing: It is recommended to short when the price rebounds near the upper resistance level.
免责声明:本文章仅代表作者个人观点,不代表本平台的立场和观点。本文章仅供信息分享,不构成对任何人的任何投资建议。用户与作者之间的任何争议,与本平台无关。如网页中刊载的文章或图片涉及侵权,请提供相关的权利证明和身份证明发送邮件到support@aicoin.com,本平台相关工作人员将会进行核查。


