Another wave of selling may be on the way.
Author: Xiao Yanyan
The rapid surge in the U.S. stock market on Wednesday quickly faded, with over 300 S&P 500 stocks declining in less than two hours, suggesting that investors looking for a market bottom may need to continue waiting.
This is exactly what a series of technical indicators show. While U.S. stocks may rise in the coming days or weeks, there are still some thresholds that need to be overcome before a real rebound can begin.
The initial enthusiasm on Wednesday was based on data showing that the Consumer Price Index (CPI) rose at its slowest pace in four months in February, which likely gave the Federal Reserve a reason to cut interest rates earlier than expected. However, inflation is no longer the main driver for investors; economic growth is, along with the trade threats posed by Trump's tariff policies. Based on this, investors are still being defensive.
Patrick Fruzzetti, portfolio manager at Rose Advisors, said, “CPI is no longer relevant. Everything is now about growth. Tariff news is a daily driver for the market. These fluctuations will be with us for a while until a new trade agreement is reached, but I don’t think that will happen soon.”
From a technical perspective, the S&P 500 index is struggling after ending a two-year uptrend this week. Chart watchers believe that the S&P 500 needs to reclaim the 200-day moving average, which is around 5737 points. The index is currently trading around 5580 points. Technical indicators also show that the S&P 500 is in oversold territory, indicating that Wall Street has turned bearish on the stock market.
So the question arises: can the current rebound last?
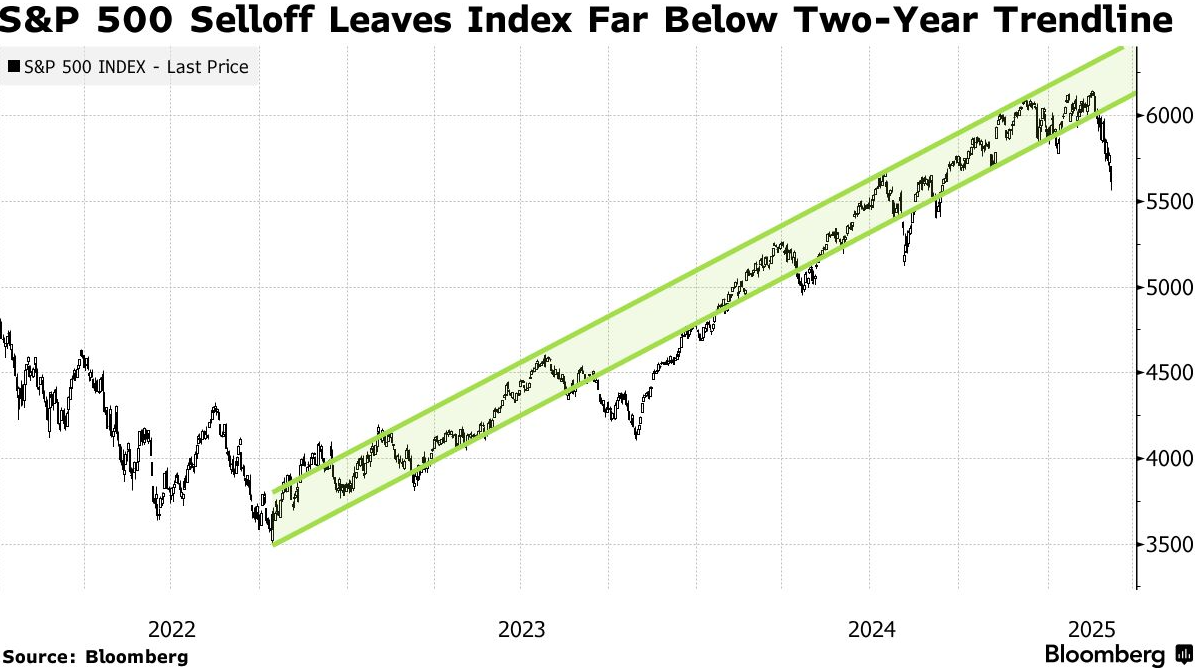
The S&P 500 index has significantly fallen below the 2-year trend line.
Stuart Kaiser, head of U.S. equity trading strategy at Citigroup, told clients late Tuesday, “We are not buyers on the dips.” He still believes that high-priced tech stocks are at risk, and the likelihood of support from Trump or the Federal Reserve is low, as the U.S. president warned that Americans might feel “a little disruption” from the trade war with Canada and Mexico.
Mark Newton, head of technical strategy at Fundstrat Global Advisors, believes that traders cannot rule out the possibility of the S&P 500 dropping to 5500 points.
The 14-day relative strength index for the S&P 500 was slightly below the key level of 30 on Monday, marking the first time since October 2023. As of Tuesday's close, about 25% of the index's stocks were above the 20-day moving average, another sign that investors have turned bearish. Traders typically want to see less than 10% of index stocks above their 20-day moving average before signaling an all-clear.
When stock prices drop too much and too quickly, leaving almost no room for further declines, chart watchers consider the stocks to be oversold. However, further improvement in technical signals such as breadth and volume is needed to confirm that the recent market pain has passed.
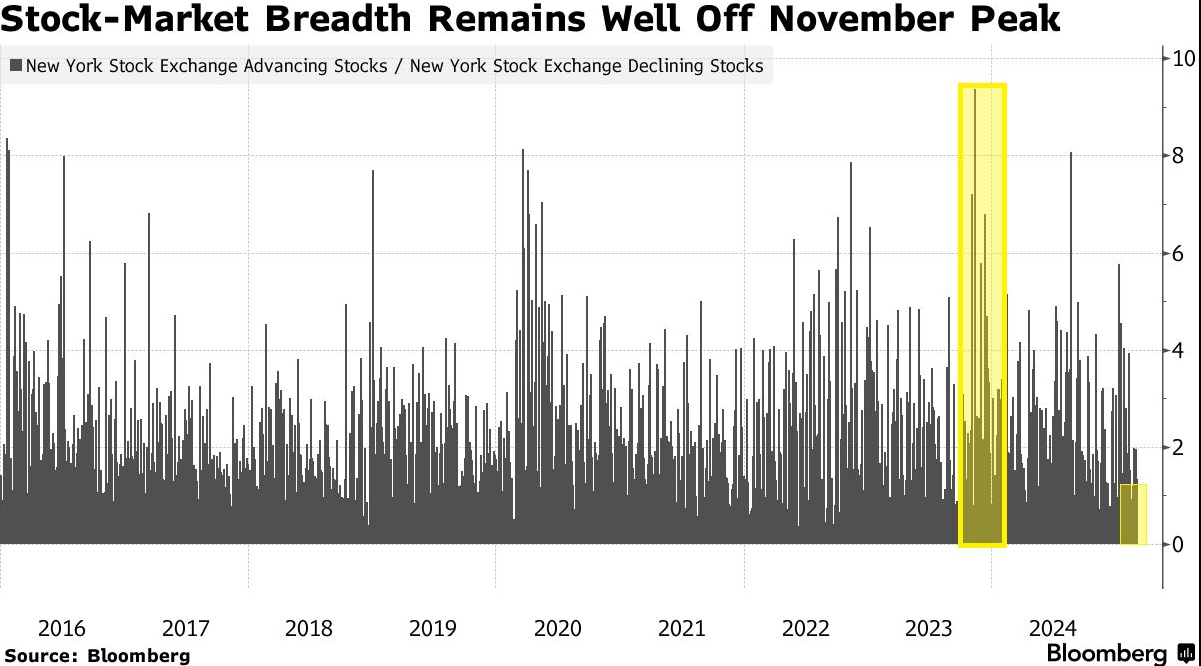
The breadth of U.S. stocks is still far below last November's peak.
Currently, about 38% of the stocks in the S&P 500 are trading above the 200-day moving average. Ari Wald, a senior analyst at Oppenheimer, stated that typically this number needs to drop below 20% for traders to consider the market has capitulated.
What happens in the coming weeks—including the Federal Reserve's interest rate decision on March 19, the "Triple Witching Day" on March 21 (when stock options, index futures, and index options expire simultaneously, increasing volatility), and the portfolio rebalancing at the end of the month—will be crucial in determining whether bears will push the index lower.
John Kolovos, head of technical strategy at Macro Risk Advisors, believes that whether the S&P 500 can break through 5665 points (the high from last July) will be a turning point for the market to either enter a sideways trend or experience more pain.
Kolovos said, “We are preparing for a substantial rebound, but the recent speed of the decline may leave scar tissue.”
Craig Johnson, chief market technician at Piper Sandler, believes that if the S&P 500 breaks above the 50-day moving average near 5975 points, the bulls will regain the upper hand. This level is more than 7% higher than Tuesday's closing price.
“Investor sentiment has become extremely bearish, to the point that it’s time to be bullish,” Johnson said. “People's current pessimism is worse than during the pandemic when the world came to a halt, which is crazy. This is not a crisis.”
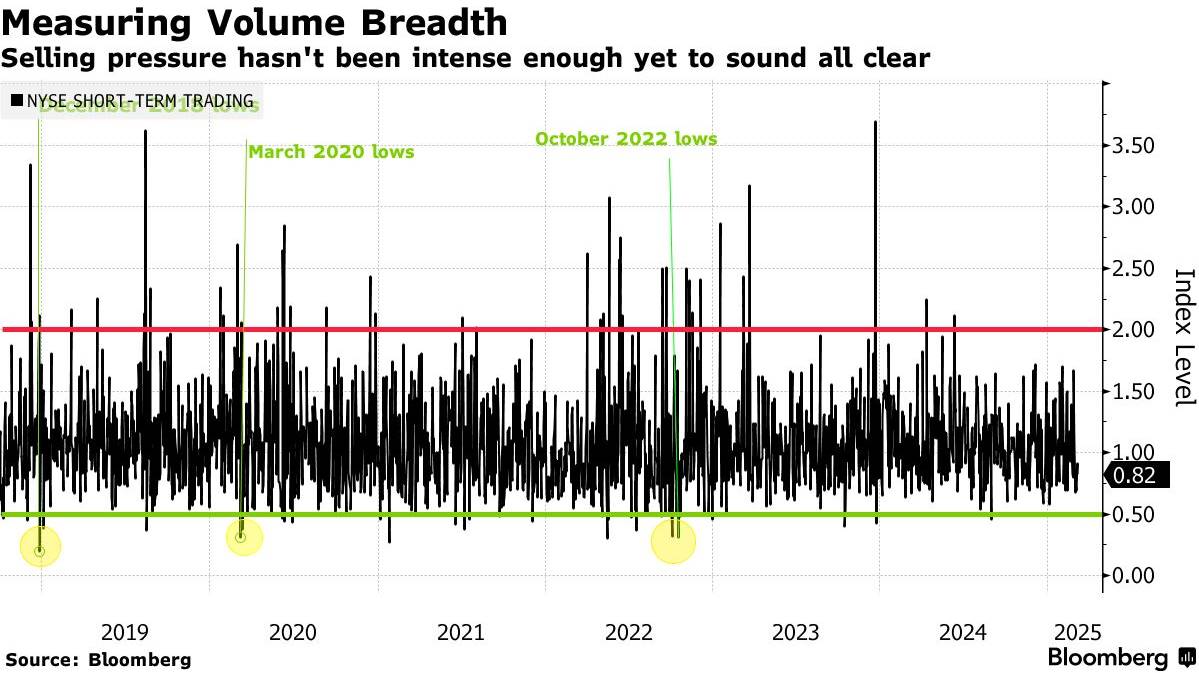
The selling pressure has not yet reached a level sufficient to resolve the crisis.
Chart watchers hope to see movements supported by broad volume, rather than just a few companies driving the major indices higher. The Arms Index, also known as the short-term trading index (TRIN), compares the number of advancing and declining stocks with the volume of advancing and declining stocks.
Todd Sohn, managing director of ETF and technical strategy at Strategas Securities, said that an index reading above 2.0 indicates that investors are selling stocks, while a reading below 0.5 indicates increased demand for stocks. After Tuesday's sharp decline, the index was at 0.8, suggesting that another wave of selling may be imminent before the market is ready for a real rebound.
免责声明:本文章仅代表作者个人观点,不代表本平台的立场和观点。本文章仅供信息分享,不构成对任何人的任何投资建议。用户与作者之间的任何争议,与本平台无关。如网页中刊载的文章或图片涉及侵权,请提供相关的权利证明和身份证明发送邮件到support@aicoin.com,本平台相关工作人员将会进行核查。


