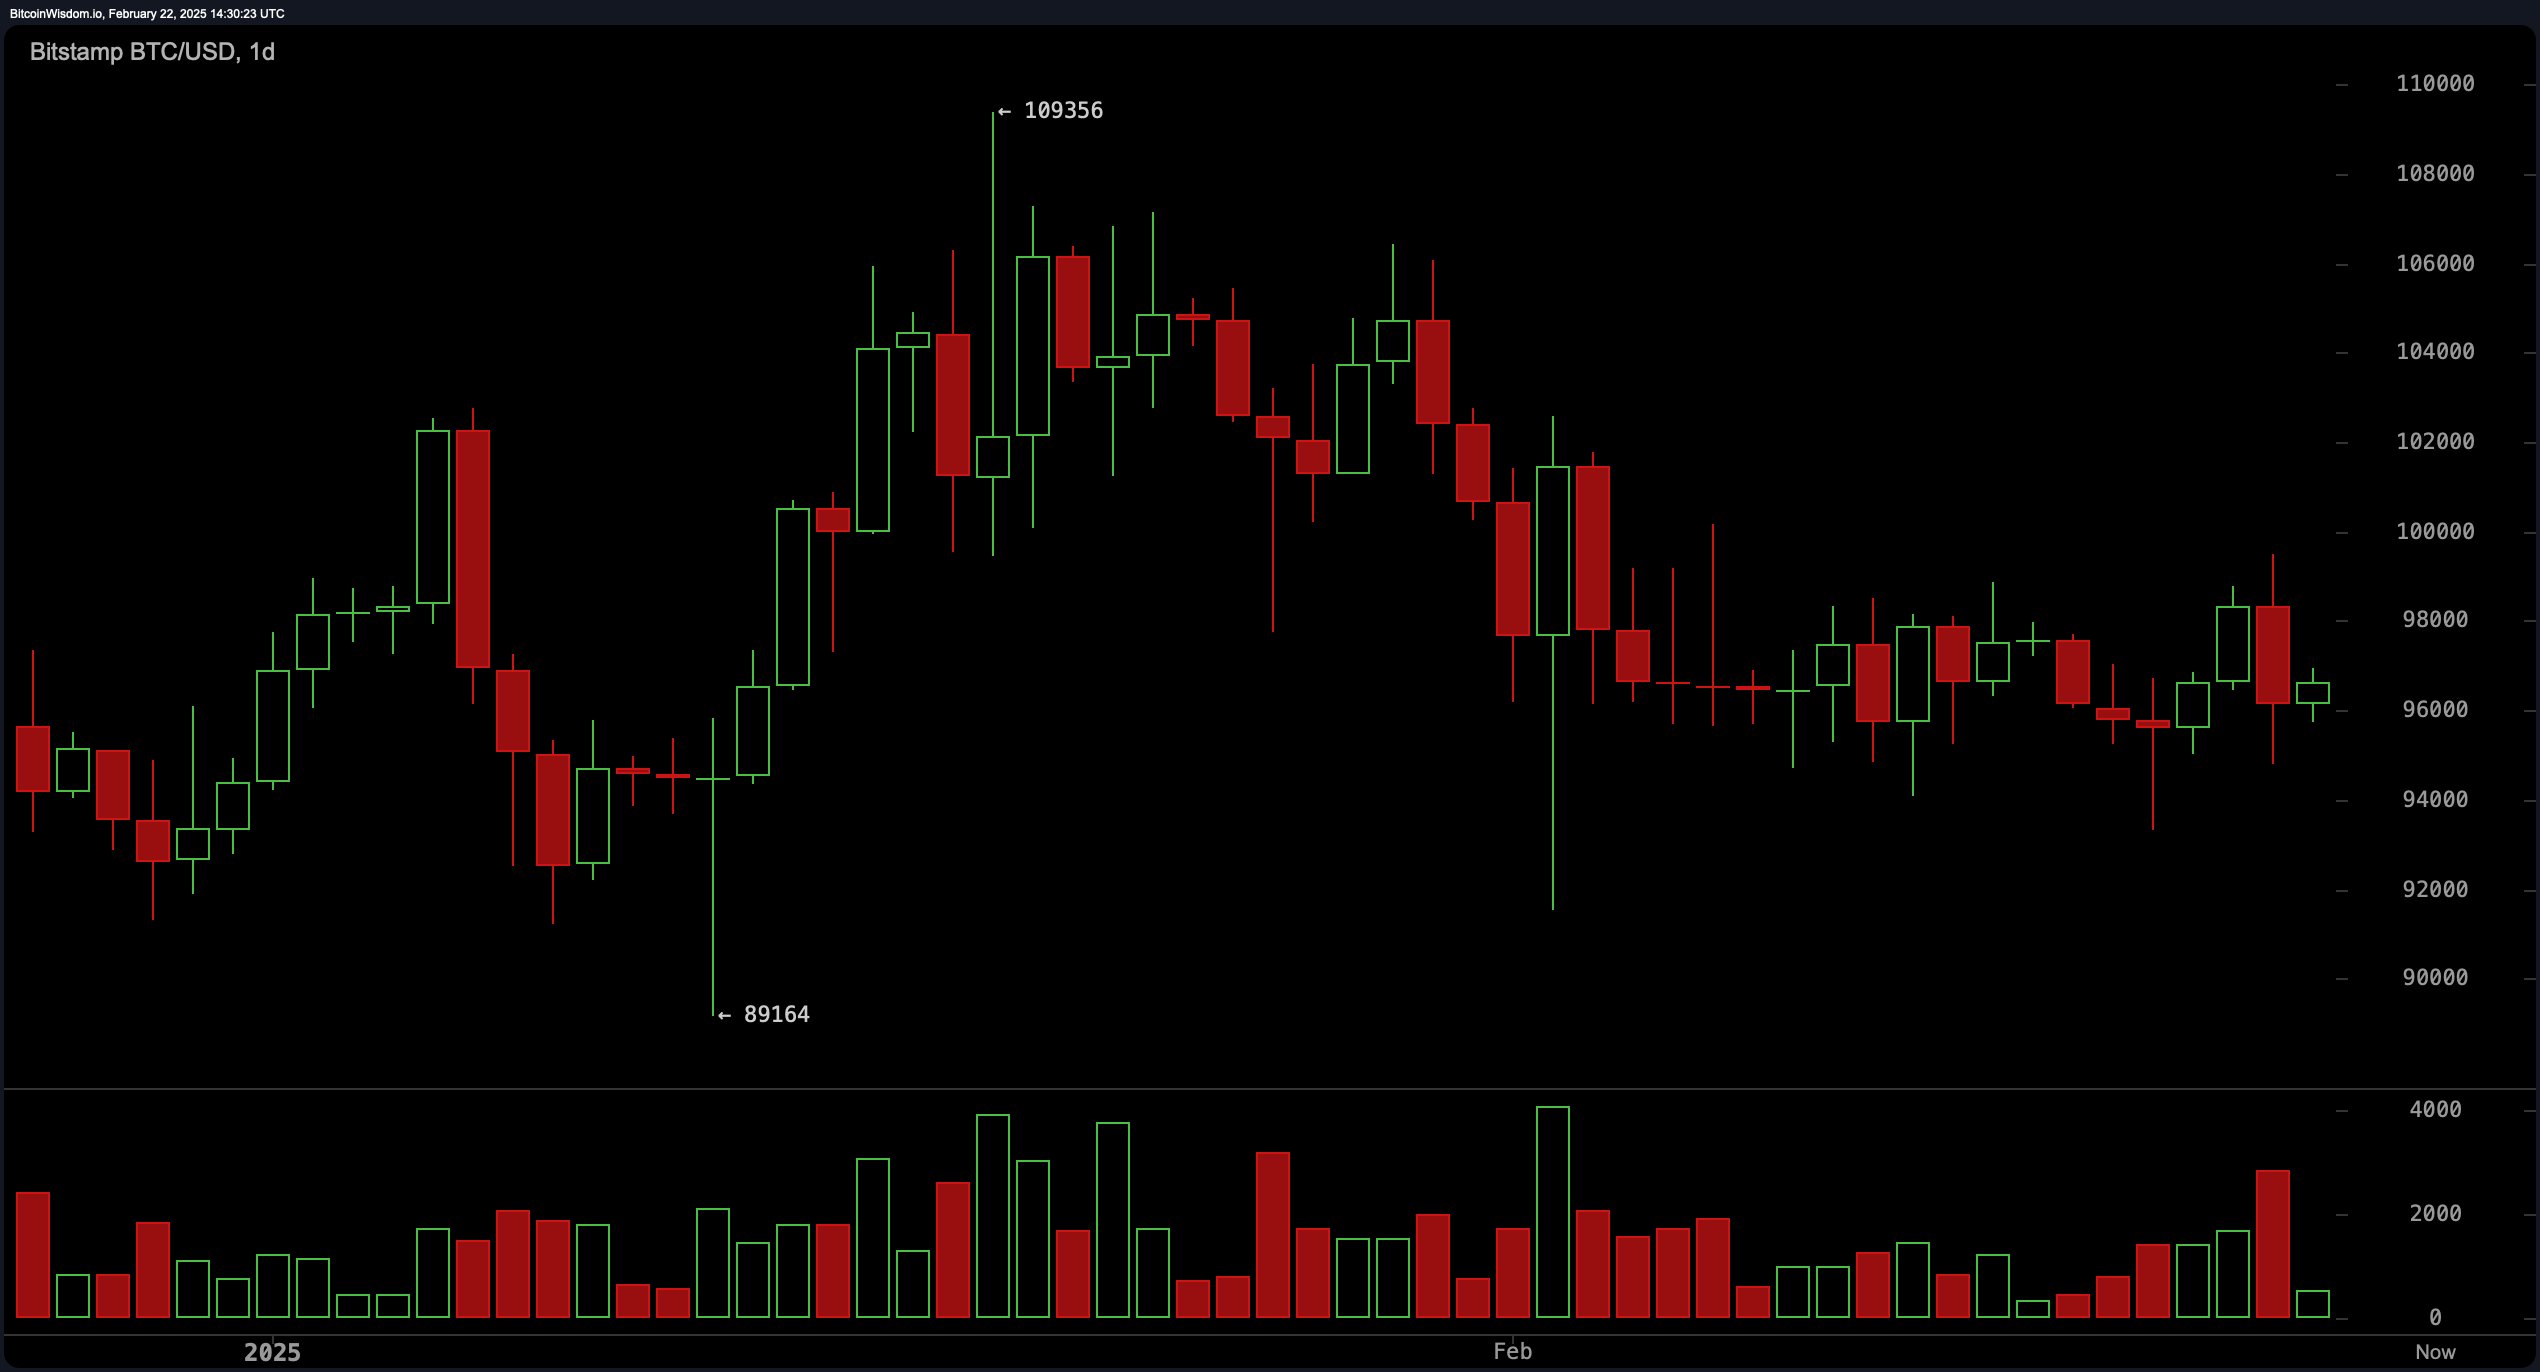
The daily chart reflects a continued downtrend, with bitcoin forming lower highs and lows after peaking near $109,356. Key support sits around $89,164, while resistance is evident near $98,000 to $100,000. The presence of bearish engulfing candles signals ongoing selling pressure, although volume remains moderate. If bitcoin fails to hold above $94,000, a retest of lower support levels is likely. Conversely, a breakout above $100,000 could shift momentum toward a bullish reversal.

BTC/USD 1D chart on Feb. 22.
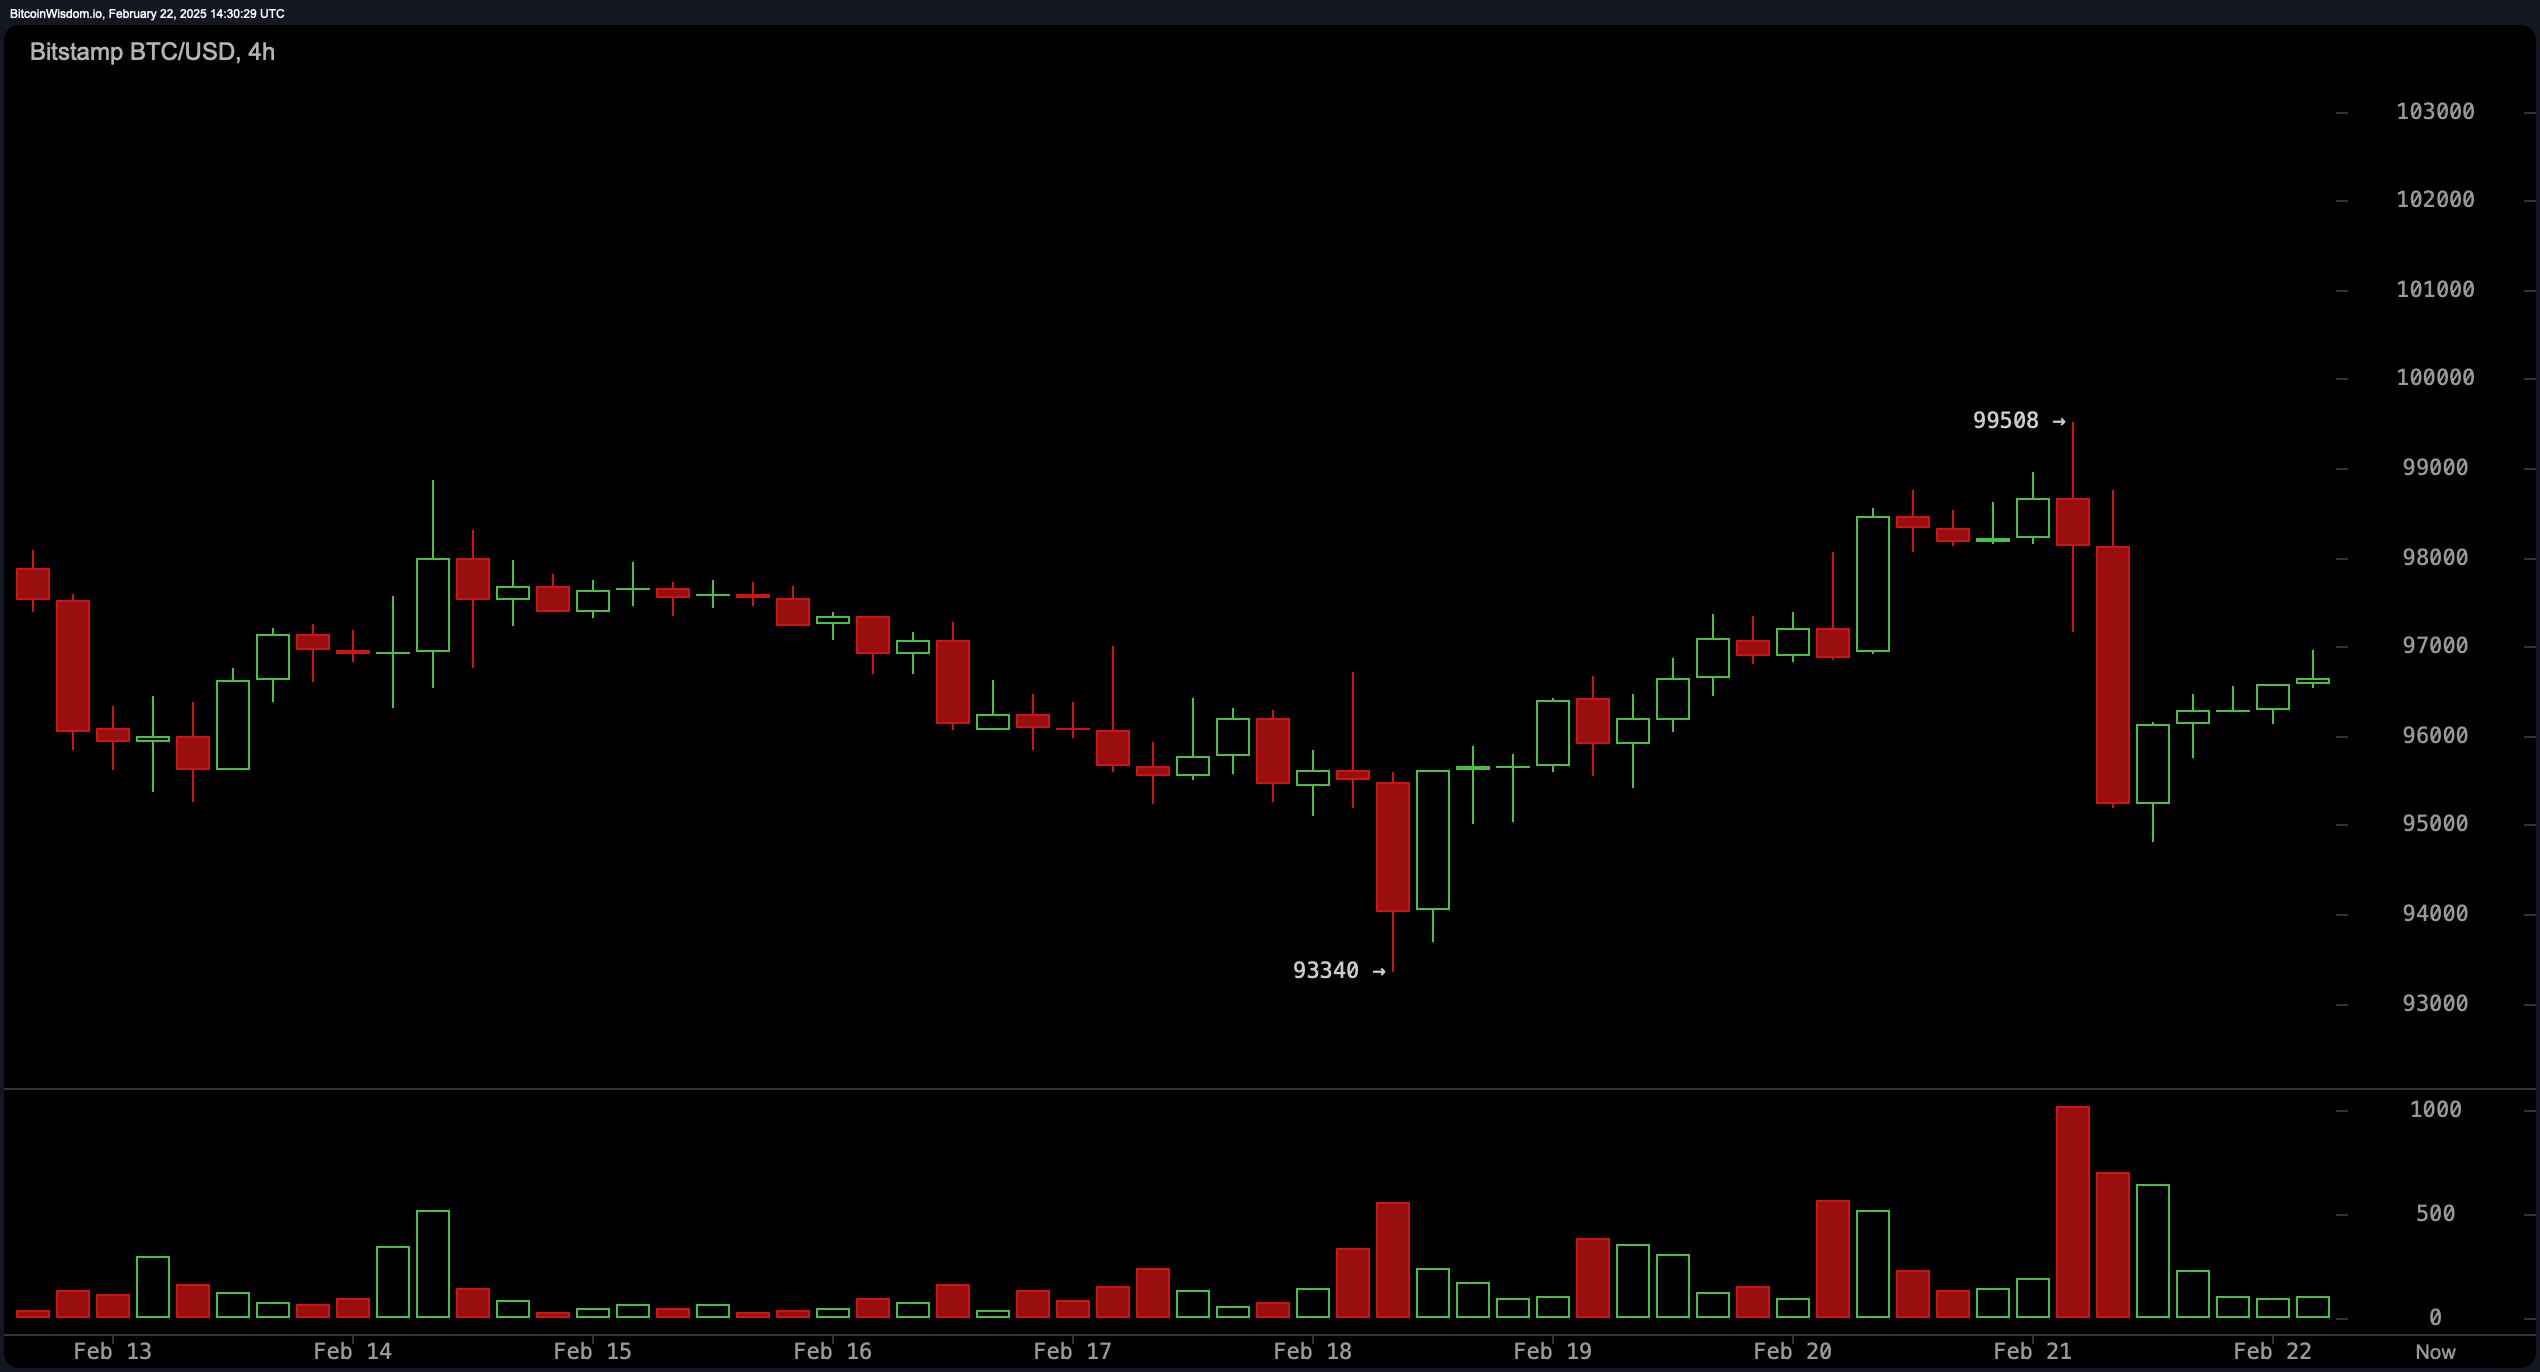
The 4-hour chart indicates a short-term bounce from $93,340, followed by a rejection near $99,500 and a decline below $97,000. Price action shows a stabilization near $96,500, but the formation of lower highs suggests the potential for further downside. If bitcoin holds above $95,000, it may attempt to reclaim the $98,000 level, whereas a break below $94,000 could accelerate selling pressure toward lower support.

BTC/USD 4H chart on Feb. 22.
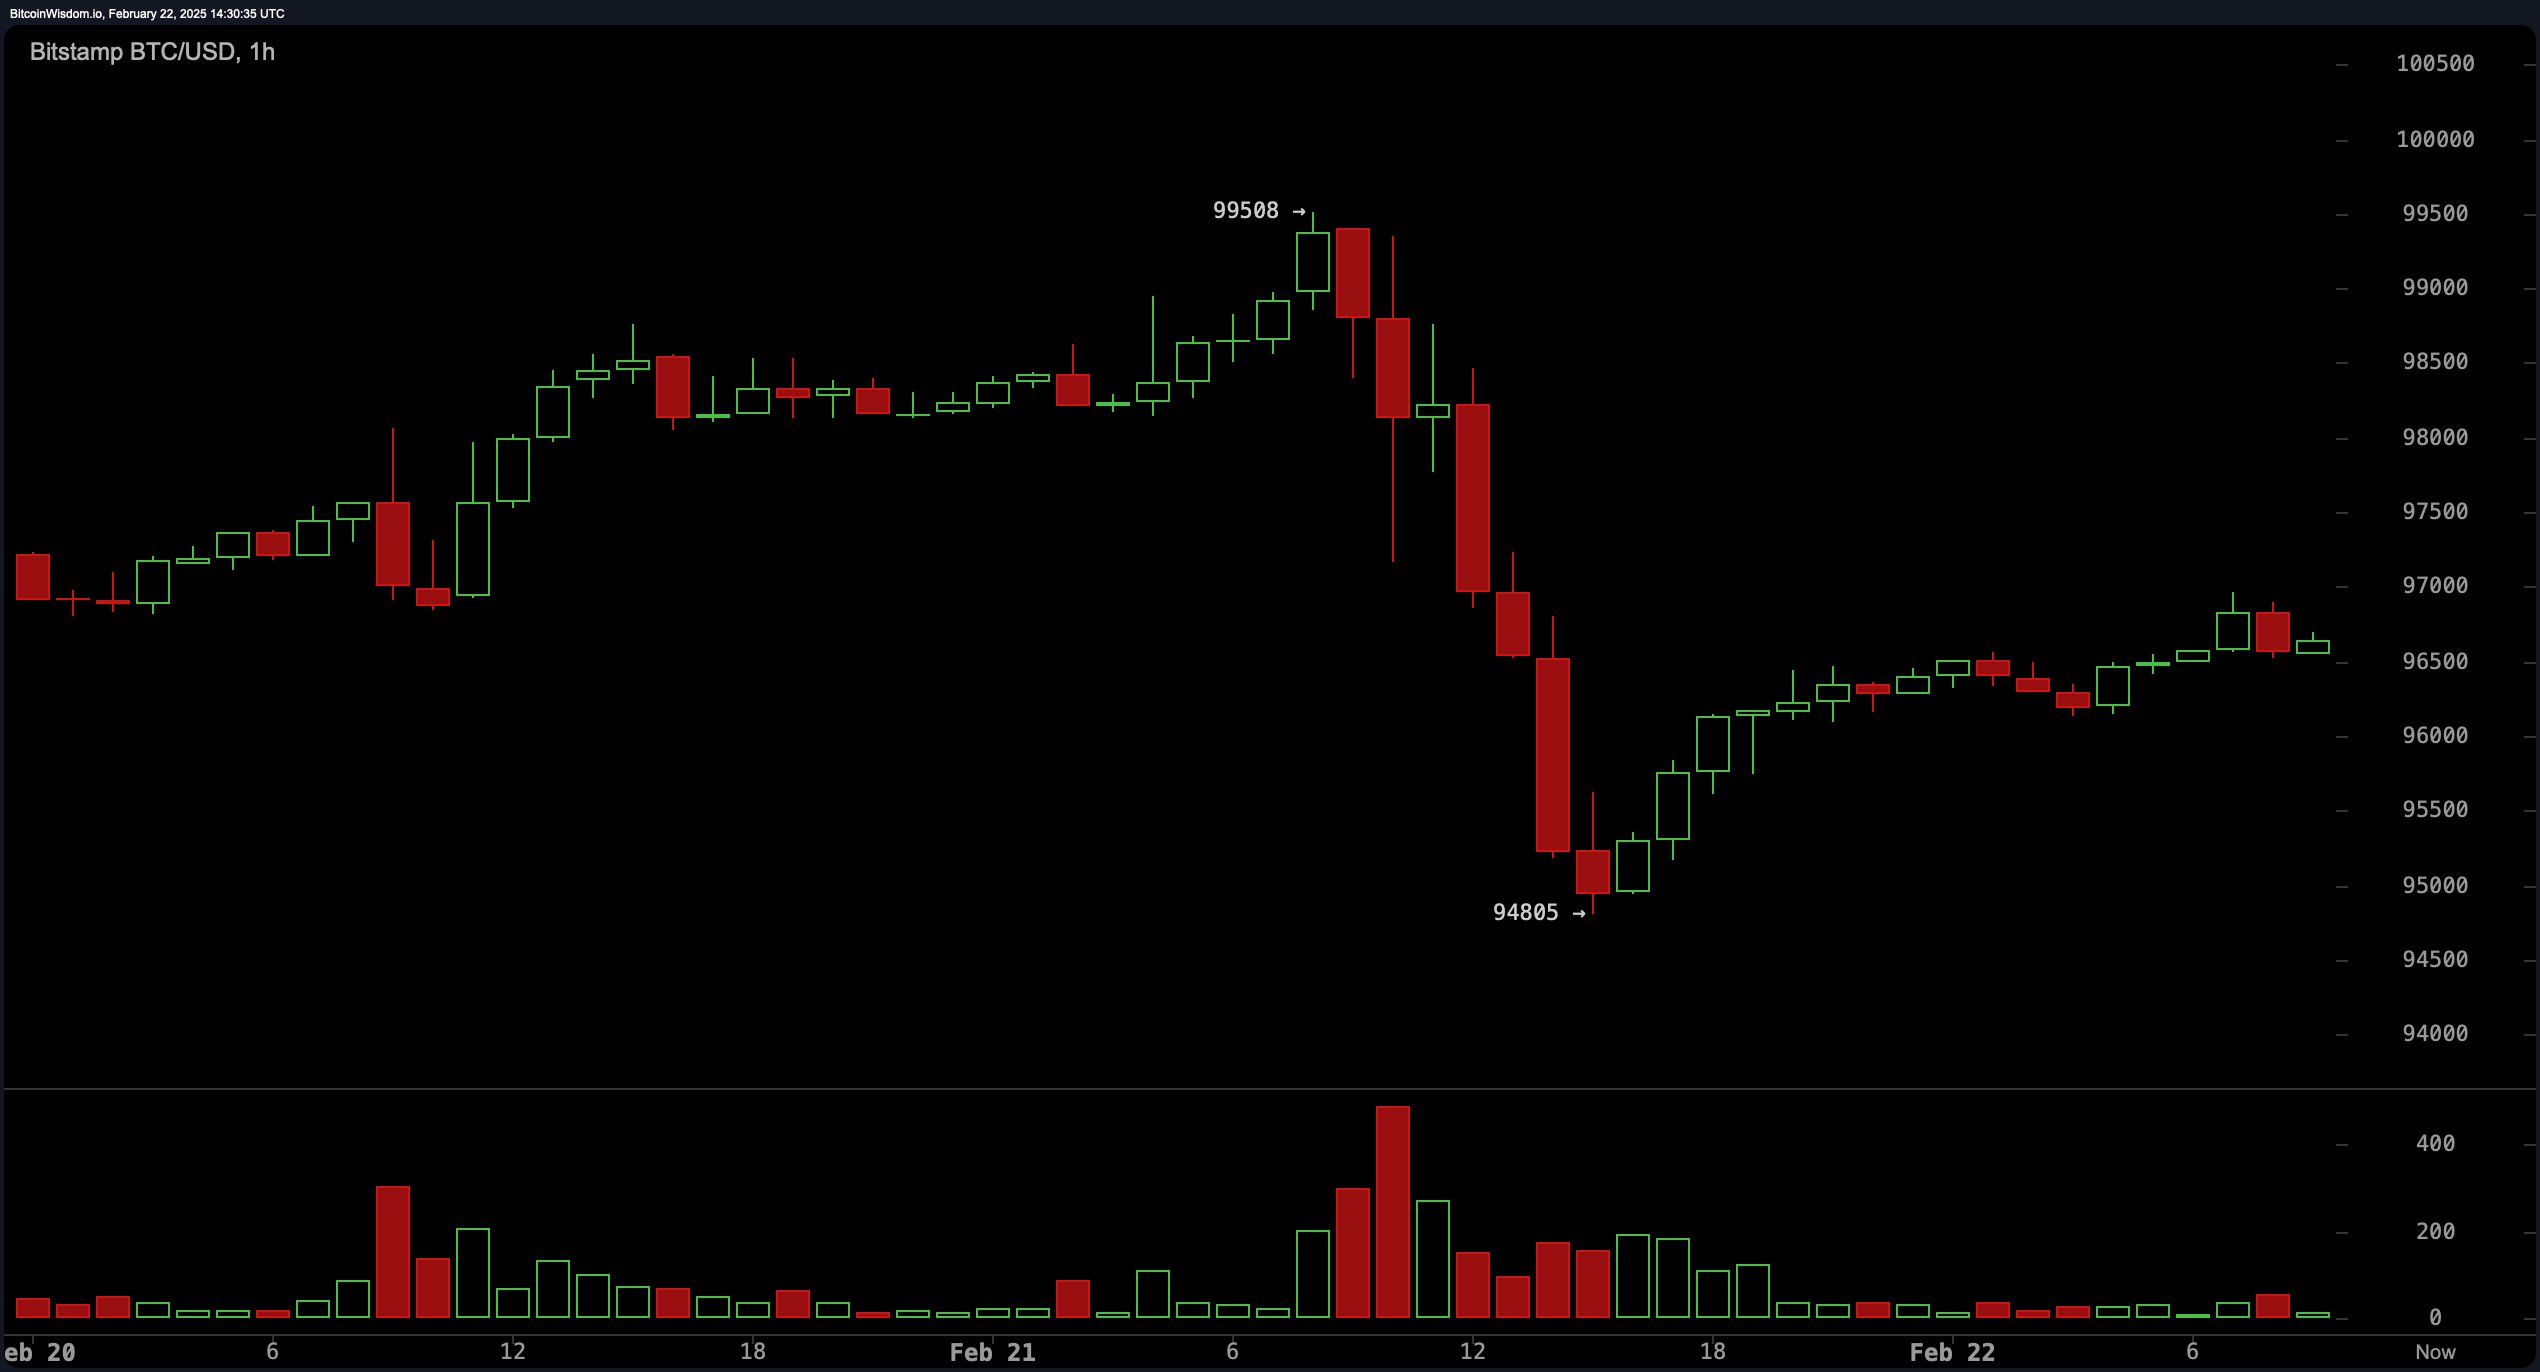
The 1-hour chart highlights a steep sell-off from $99,500 to $94,805, followed by a rapid rebound toward $96,500 to $97,000. A surge in trading volume at the $94,805 level suggests potential short-term support, though the presence of lower highs raises concerns about bearish continuation. Bitcoin must sustain levels above $96,000 to regain bullish momentum; otherwise, further declines may be imminent.

BTC/USD 1H chart on Feb. 22.
Among oscillators, the relative strength index (RSI) at 47 remains neutral, as do the Stochastic, commodity channel index (CCI), average directional index (ADX), and awesome oscillator. Momentum is in sell territory at -1,238, while the moving average convergence divergence (MACD) signals a buy at -806. Moving averages indicate a bearish trend, with all short- and mid-term exponential moving averages (EMA) and simple moving averages (SMA) pointing to selling pressure, while only the 100-period and 200-period EMA and SMA offer buy signals, reinforcing long-term support.
Bitcoin’s technical landscape suggests caution, with key resistance near $98,000 to $100,000 and critical support at $94,000. If buyers regain control, bitcoin could challenge $102,000; otherwise, a break below $91,000 might extend the correction. Traders should watch price action around these levels for confirmation of the next directional move.
Bull Verdict:
Despite short-term bearish pressure, bitcoin is holding above key support at $94,000, with the moving average convergence divergence (MACD) signaling potential upside momentum. If buyers can push the price above $98,000 and sustain a breakout beyond $100,000, bitcoin could reclaim bullish dominance, targeting $102,000 and higher in the coming sessions.
Bear Verdict:
The formation of lower highs across multiple timeframes, coupled with selling pressure reflected in moving averages and momentum indicators, suggests continued downside risk. If bitcoin fails to hold above $94,000, a break below $91,000 could trigger further declines toward long-term support levels, reinforcing the ongoing bearish trend.
免责声明:本文章仅代表作者个人观点,不代表本平台的立场和观点。本文章仅供信息分享,不构成对任何人的任何投资建议。用户与作者之间的任何争议,与本平台无关。如网页中刊载的文章或图片涉及侵权,请提供相关的权利证明和身份证明发送邮件到support@aicoin.com,本平台相关工作人员将会进行核查。


