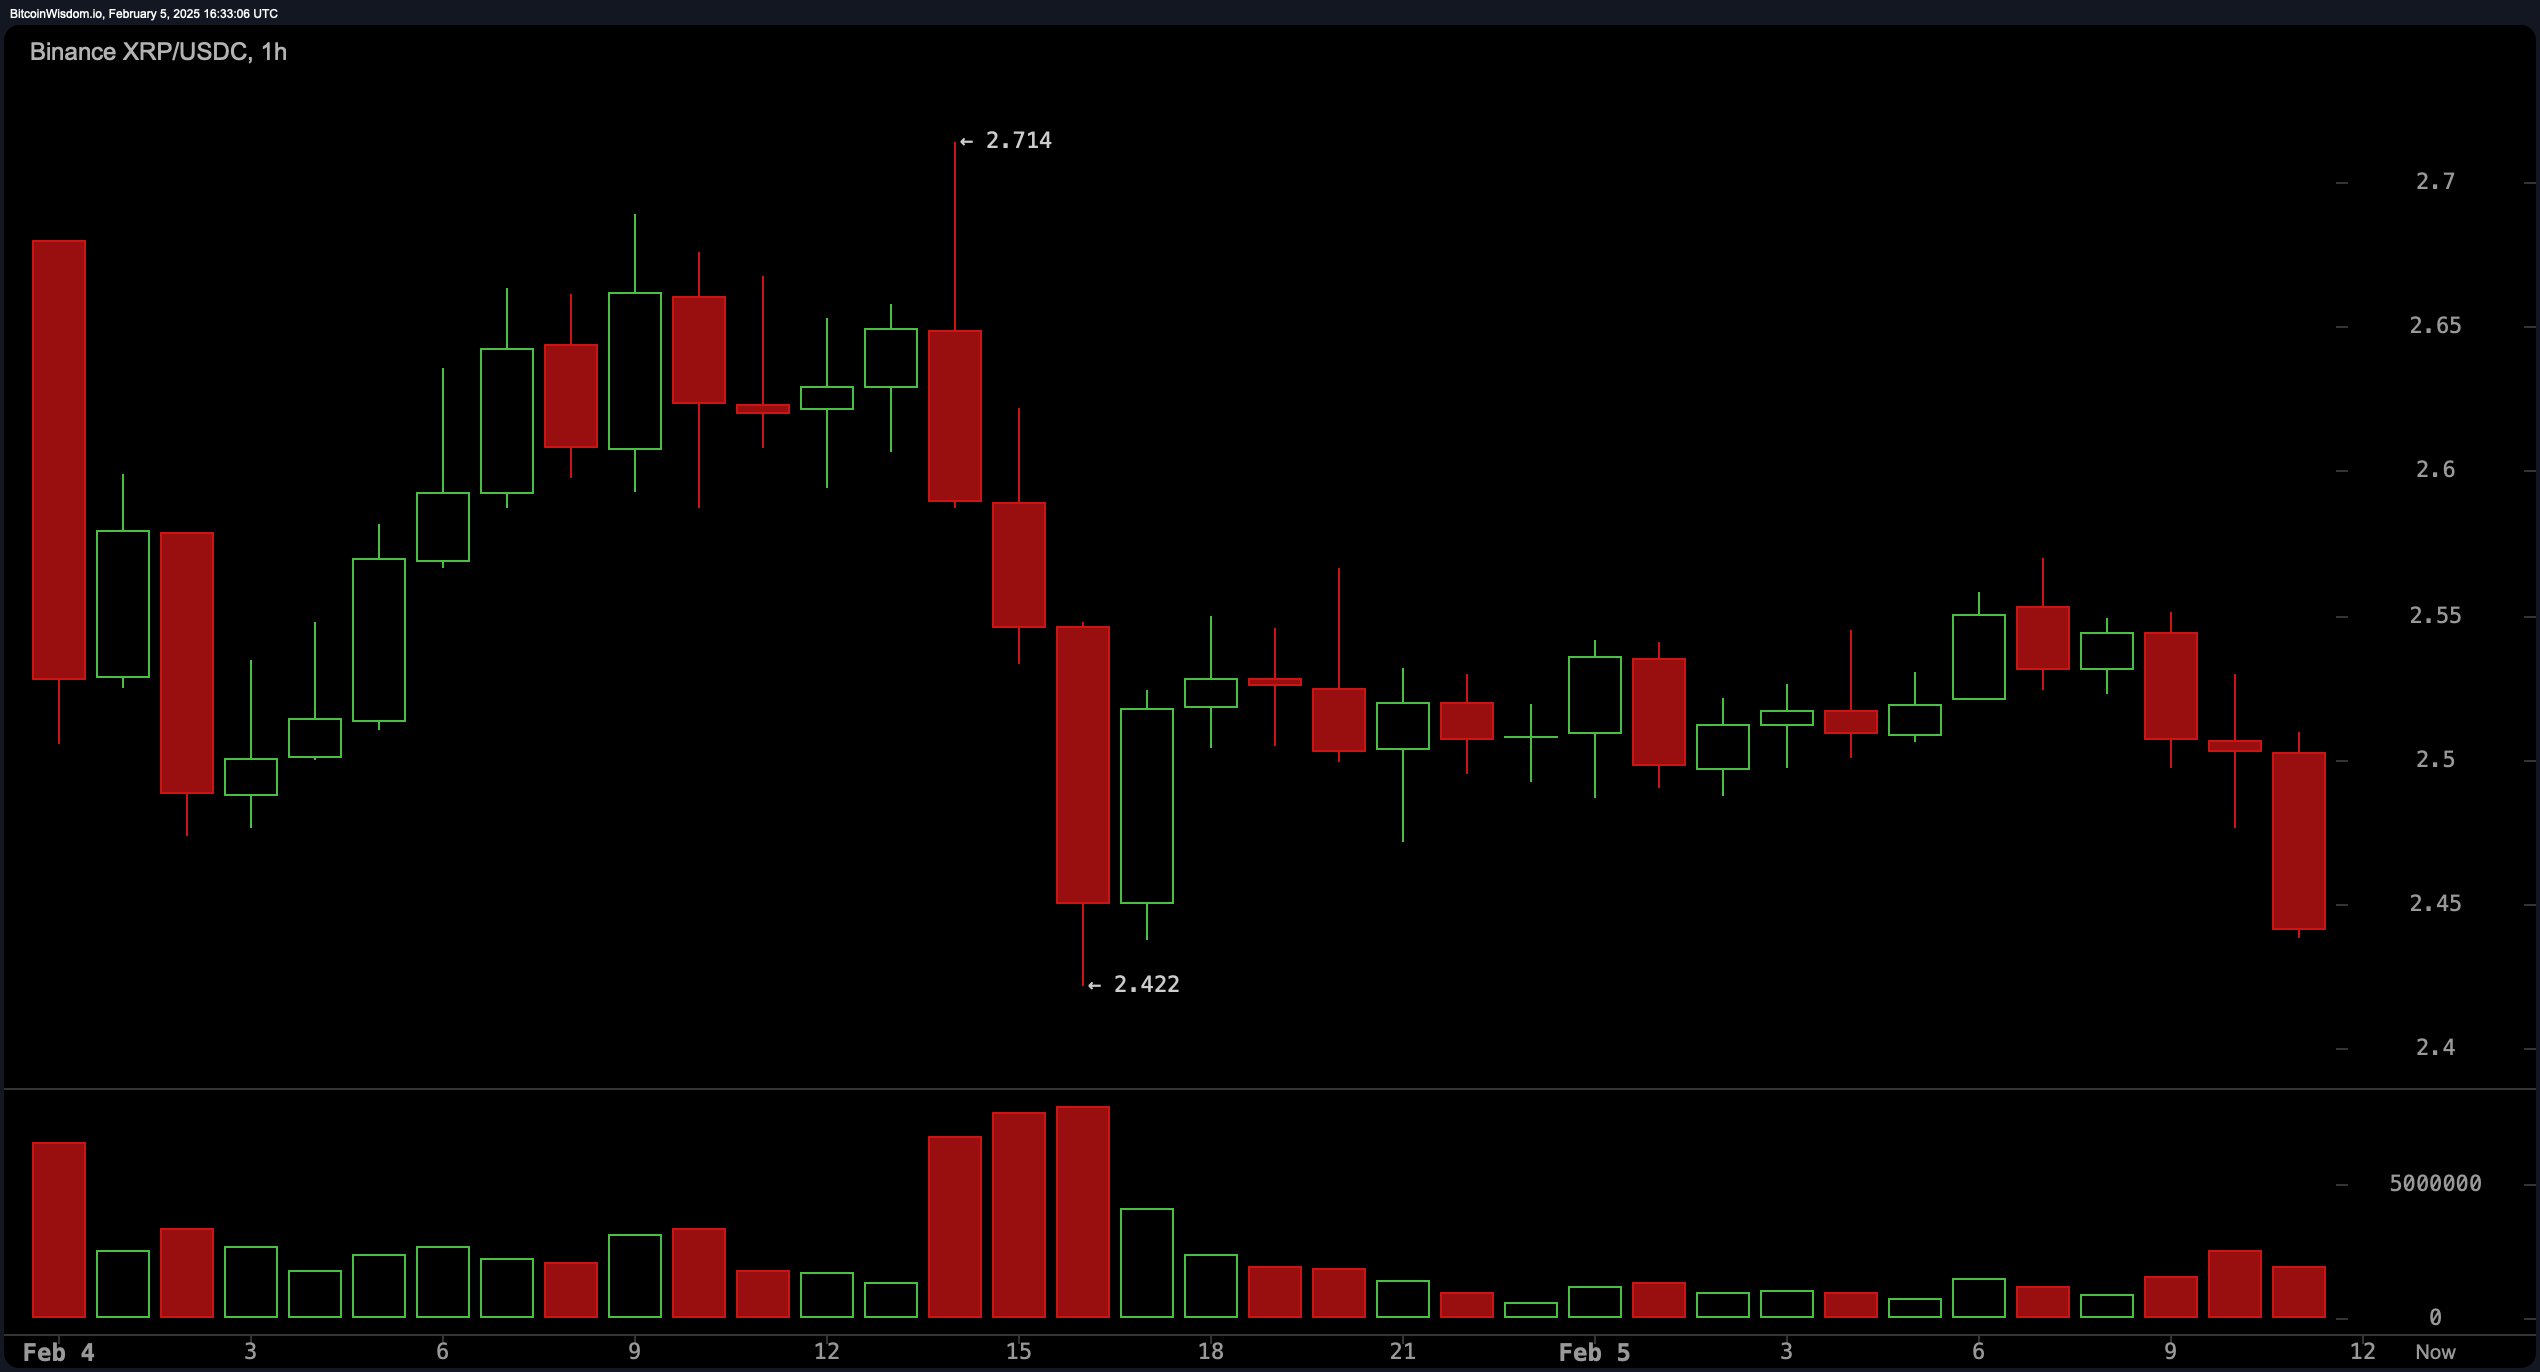
XRP’s 1-hour chart reveals a challenge in sustaining upward progress, as XRP continues to be weighed down by selling pressure. A formation of lower highs near $2.71 hints at a potential downturn, with several bearish candles materializing around the $2.50 mark. Volume trends display bursts of selling activity near this threshold, reinforcing short-term bearish sentiment. Despite a brief attempt at recovery, XRP has yet to reclaim key resistance, leaving it vulnerable to further declines if buyers do not intervene near the $2.42 support level.

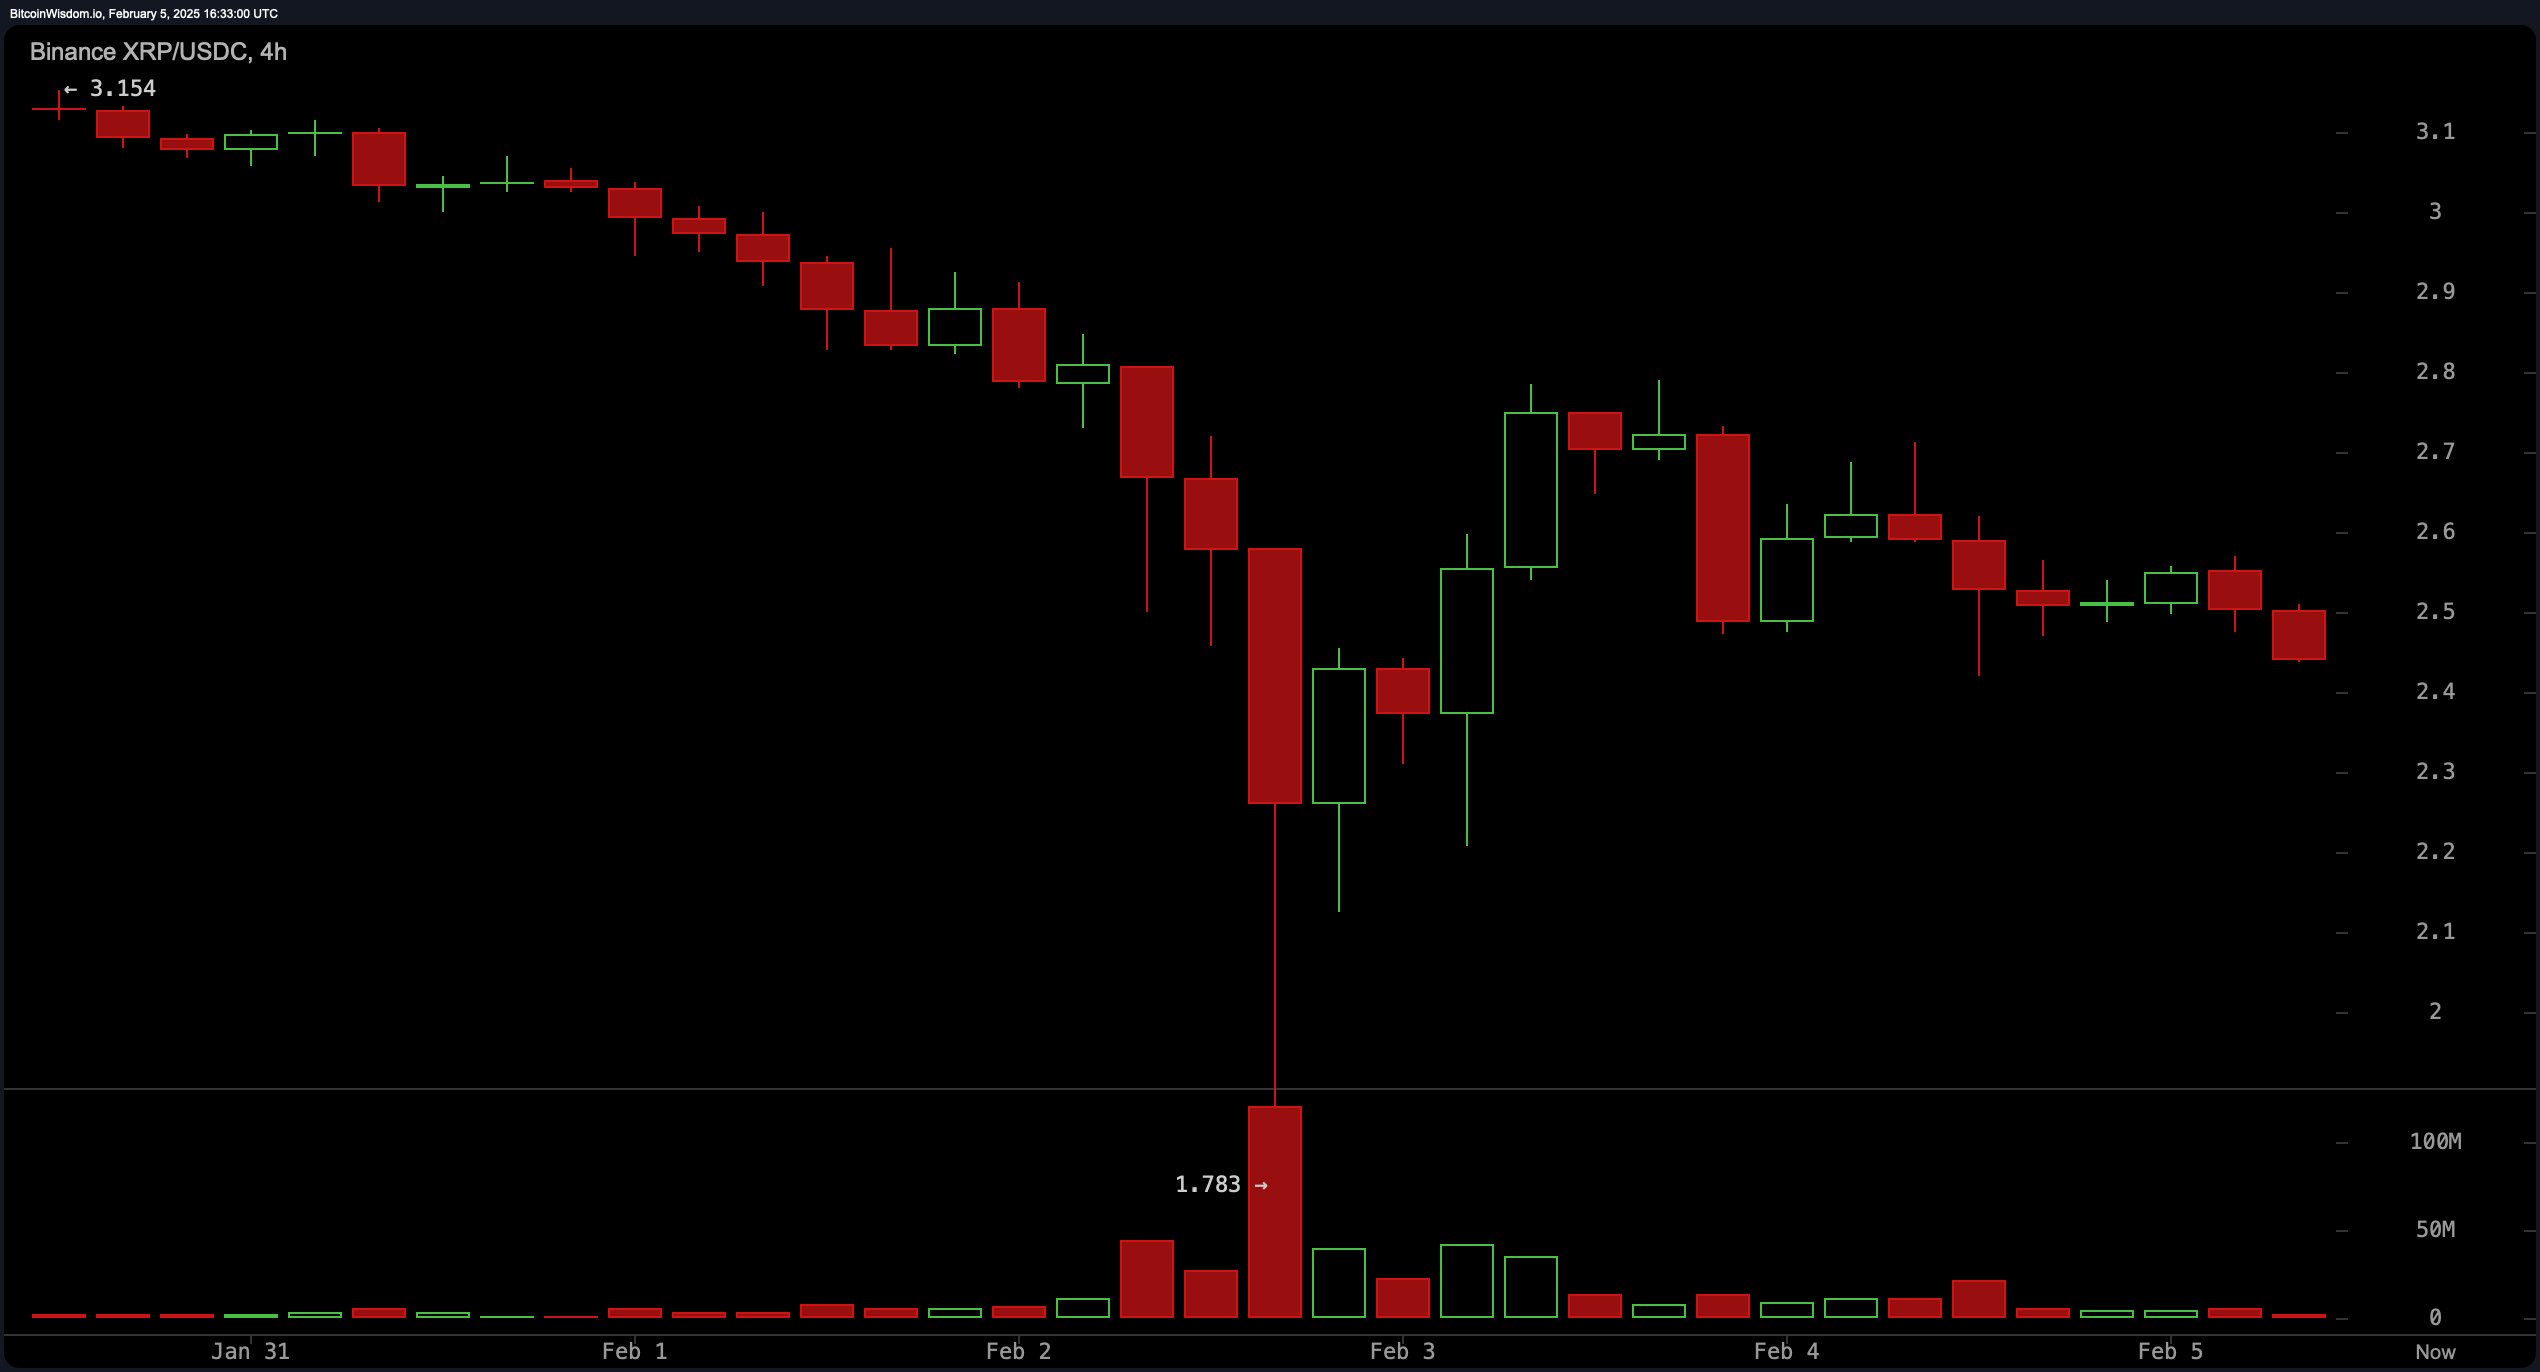
The 4-hour chart demonstrates ongoing selling pressure following a recent decline, even though a brief recovery was noted. Considerable support is evident at $2.42, where a notable increase in volume signals buyer engagement, while resistance has coalesced between $2.70 and $2.80. The failure to hold $2.70 emphasizes the market’s difficulty in maintaining upward movement, bolstering bearish sentiment.

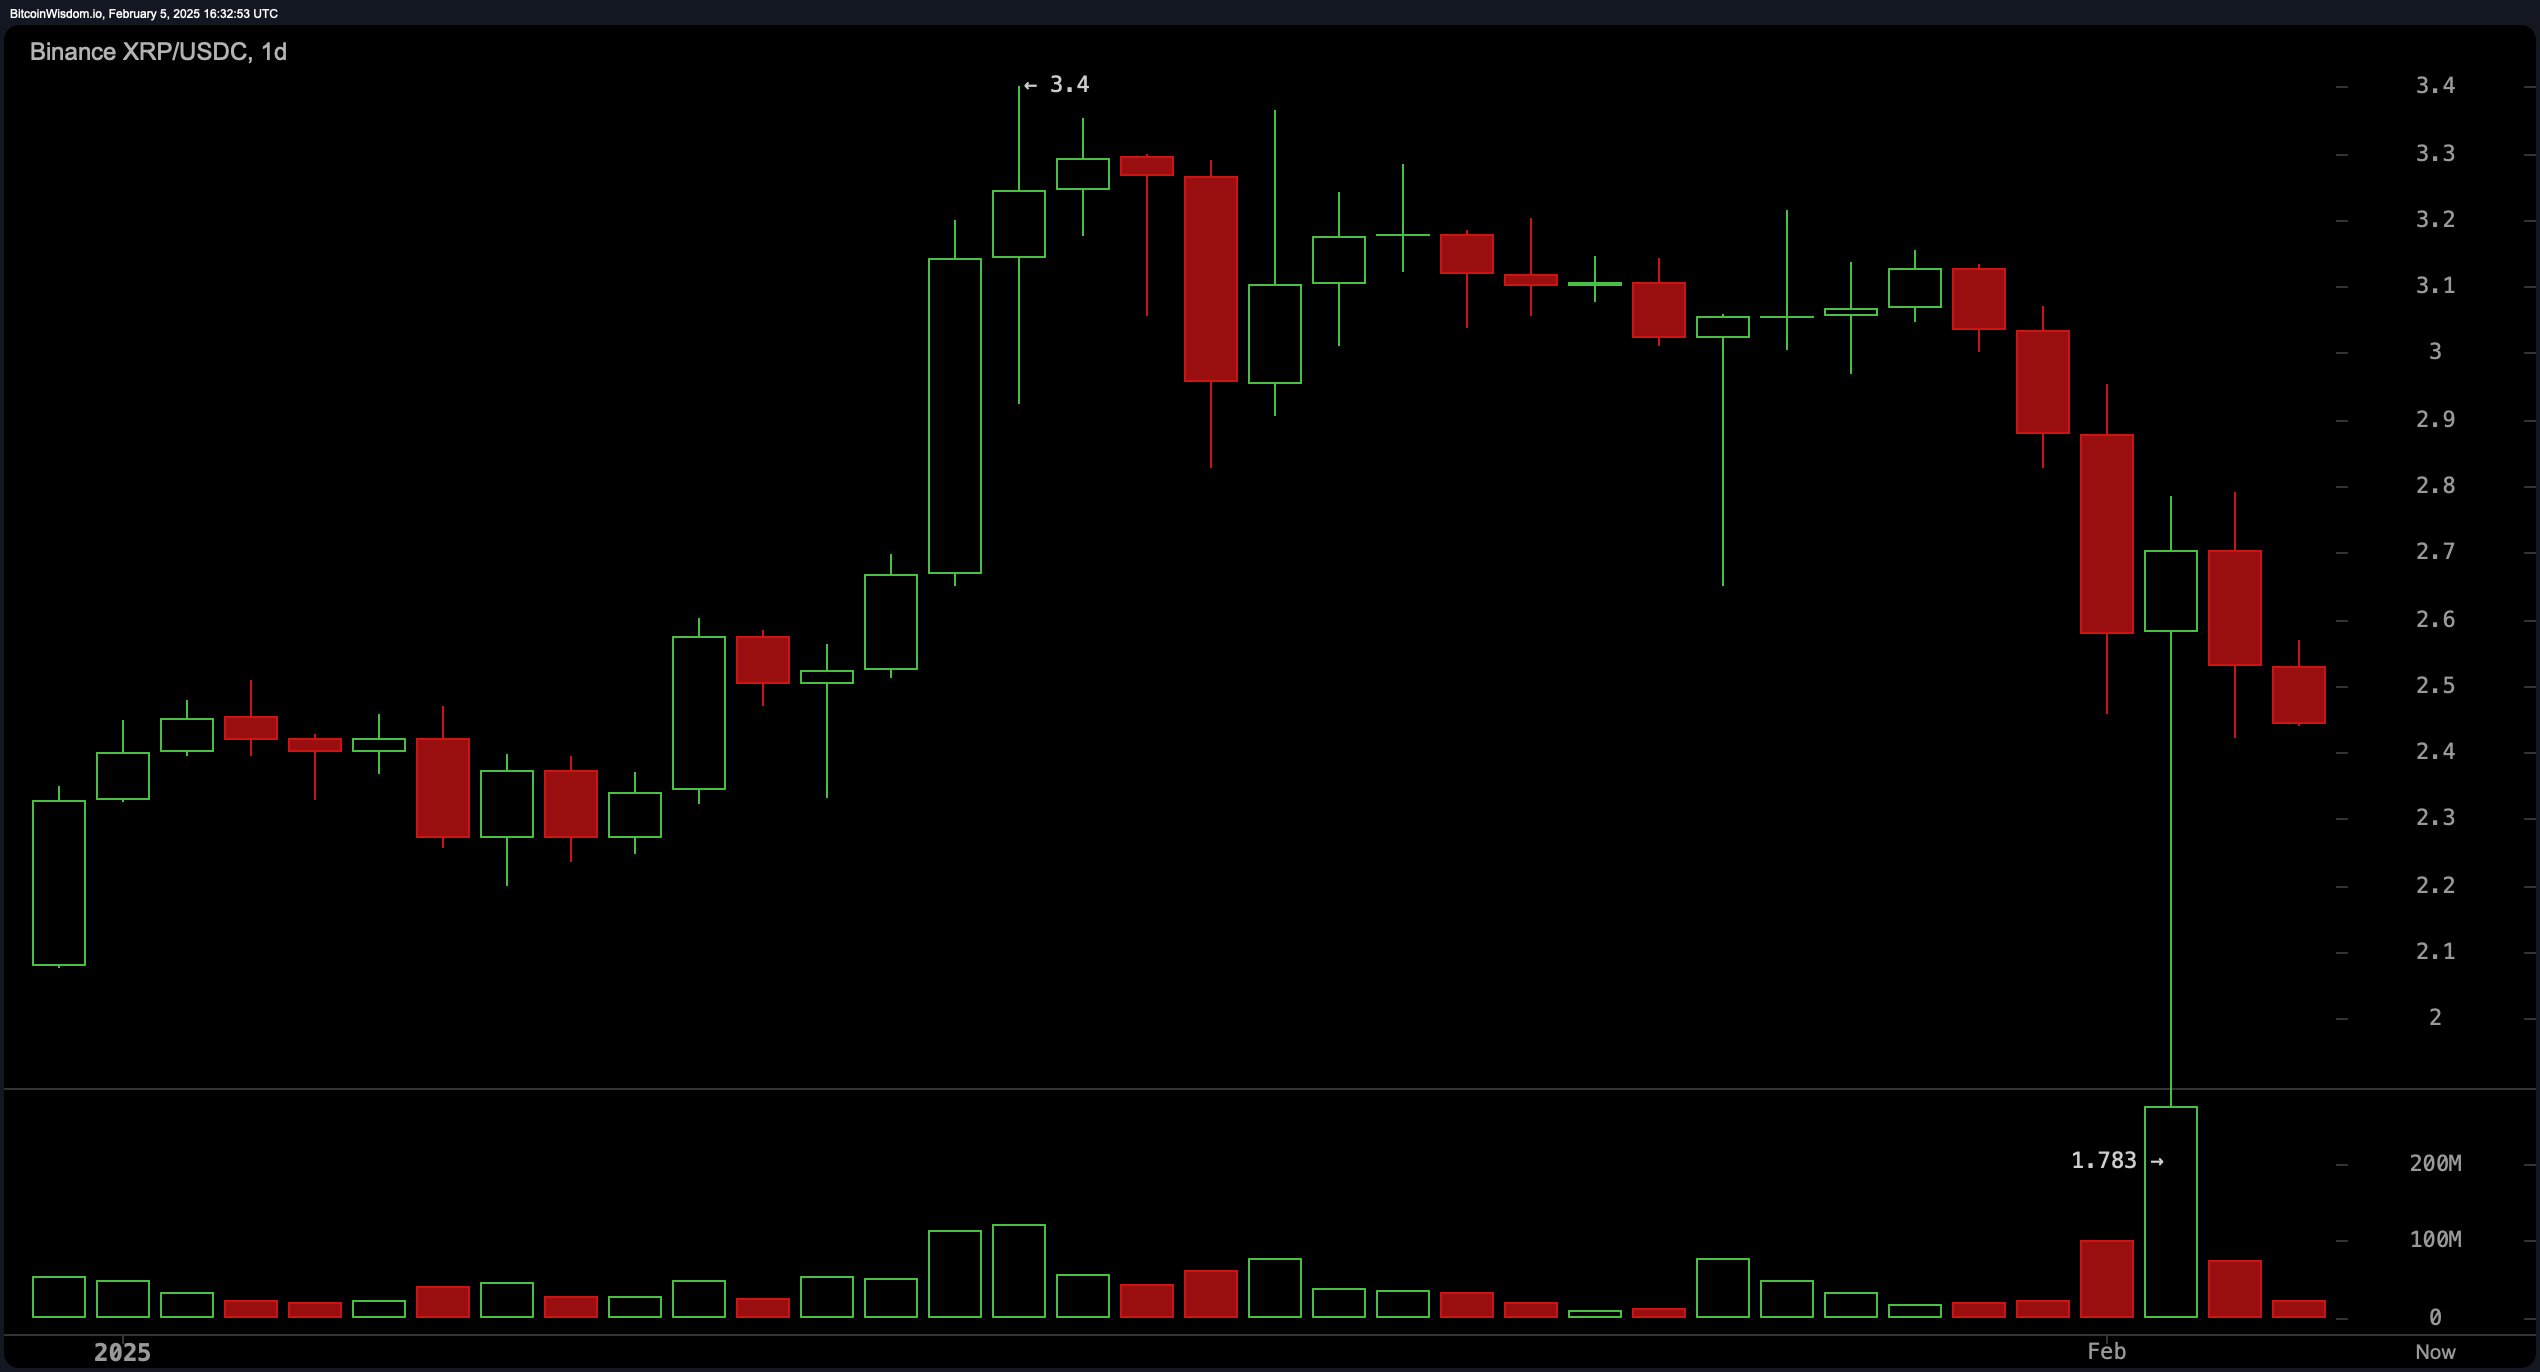
On the daily chart, XRP encountered a sharp rejection at $3.40, triggering a notable drop. The $2.42 mark has established itself as a vital support level, as substantial buying volume was recorded at that price. Yet, the failure to remain above key moving averages and ongoing selling pressure imply that the recent downtrend continues unabated. Resistance at $3.00 and higher persists, and any lasting recovery will require advancing beyond the $2.80 to $3.00 range. Should support at $2.40 falter, XRP might experience further declines, whereas a rebound above $2.70 could pivot sentiment toward a more balanced stance.

Oscillator metrics offer mixed signals, with the relative strength index (RSI) at 37.11 reflecting neutral momentum while the commodity channel index (CCI) at -172.72 points to a buy signal. The Stochastic remains at 53.17, maintaining a neutral position, and the average directional index (ADX) at 26.73 fails to reveal a pronounced trend. The awesome oscillator holds a negative reading at -0.17, bolstering bearish sentiment. Concomitantly, the momentum indicator at -0.56 intimates a buying opportunity, yet the moving average convergence divergence (MACD) at -0.01276 advocates a sell recommendation. These divergent signals illuminate the prevailing uncertainty in the market environment.
Moving averages predominantly reflect bearish sentiment, with every short-term average advocating a sell. Both the exponential moving average (EMA) and simple moving average (SMA) over 10, 20, and 30 periods exhibit a downward trajectory, reinforcing the current trend. The 50-period EMA and SMA, each at $2.61, further suggest selling pressure. Conversely, longer-term averages offer a more positive perspective, as the 100-period EMA and SMA at $2.16 and $2.03, respectively, signal buy recommendations. The 200-period EMA at $1.62 and SMA at $1.30 bolster long-term support, indicating that XRP’s overall trend persists despite short-term frailty.
Bull Verdict:
Despite short-term bearish pressure, XRP’s strong support at $2.42 and buying interest at key long-term moving averages suggest the potential for a rebound. If the price holds above $2.40 and reclaims the $2.70 to $3.00 range, bullish momentum could return, pushing XRP toward previous highs. A sustained move above $3.40 would confirm a renewed uptrend.
Bear Verdict:
XRP remains under strong selling pressure, with multiple moving averages signaling further downside. The failure to hold above $2.50 and repeated rejections near $2.70 indicate that bearish momentum is still dominant. If support at $2.40 fails, the next downside targets could be significantly lower, reinforcing the case for continued weakness in the short term.
免责声明:本文章仅代表作者个人观点,不代表本平台的立场和观点。本文章仅供信息分享,不构成对任何人的任何投资建议。用户与作者之间的任何争议,与本平台无关。如网页中刊载的文章或图片涉及侵权,请提供相关的权利证明和身份证明发送邮件到support@aicoin.com,本平台相关工作人员将会进行核查。


