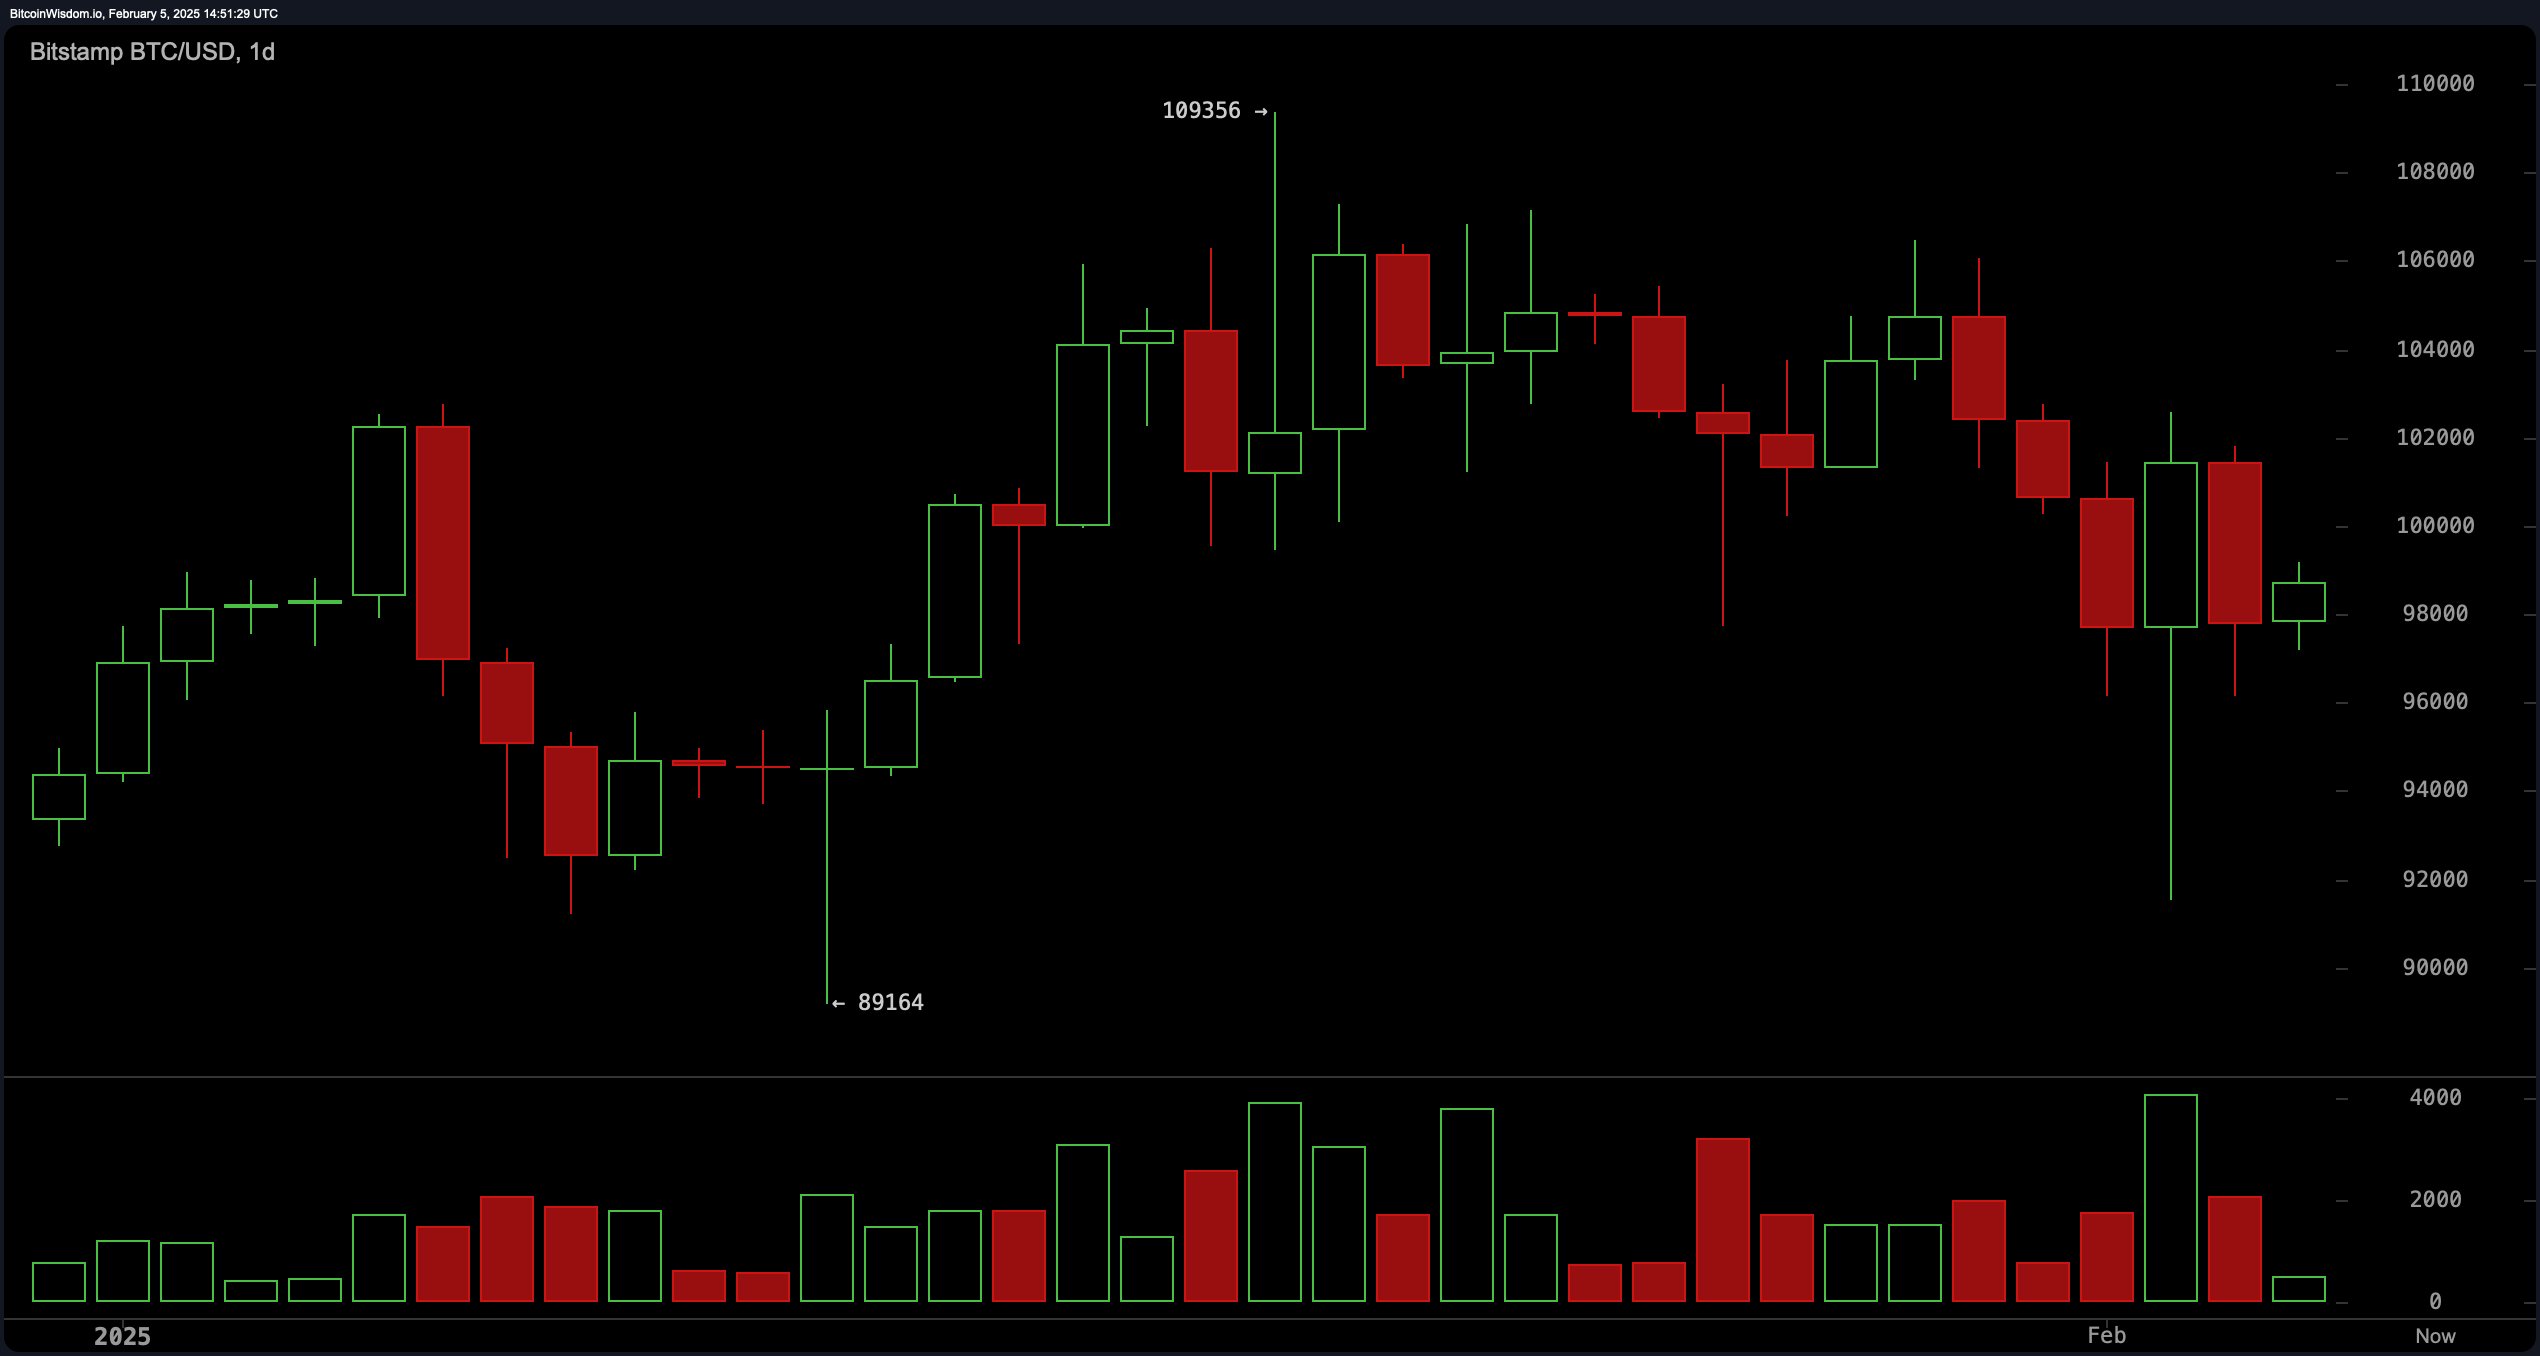
Bitcoin‘s daily price action paints a tempestuous tale: a precipitous drop followed by a valiant rebound. Support coalesced near $91,000—echoing past buying enthusiasm—while the $104,000-$109,000 per bitcoin barrier stands as an unyielding fortress. Momentum oscillators offer conflicting cues: the commodity channel index (CCI) at -140 whispers of bargain-hunting prospects, while the MACD’s 117 reading hums a cautionary tune of bearish undertones.

BTC/USD via Bitstamp 1D chart on Feb. 5, 2025.
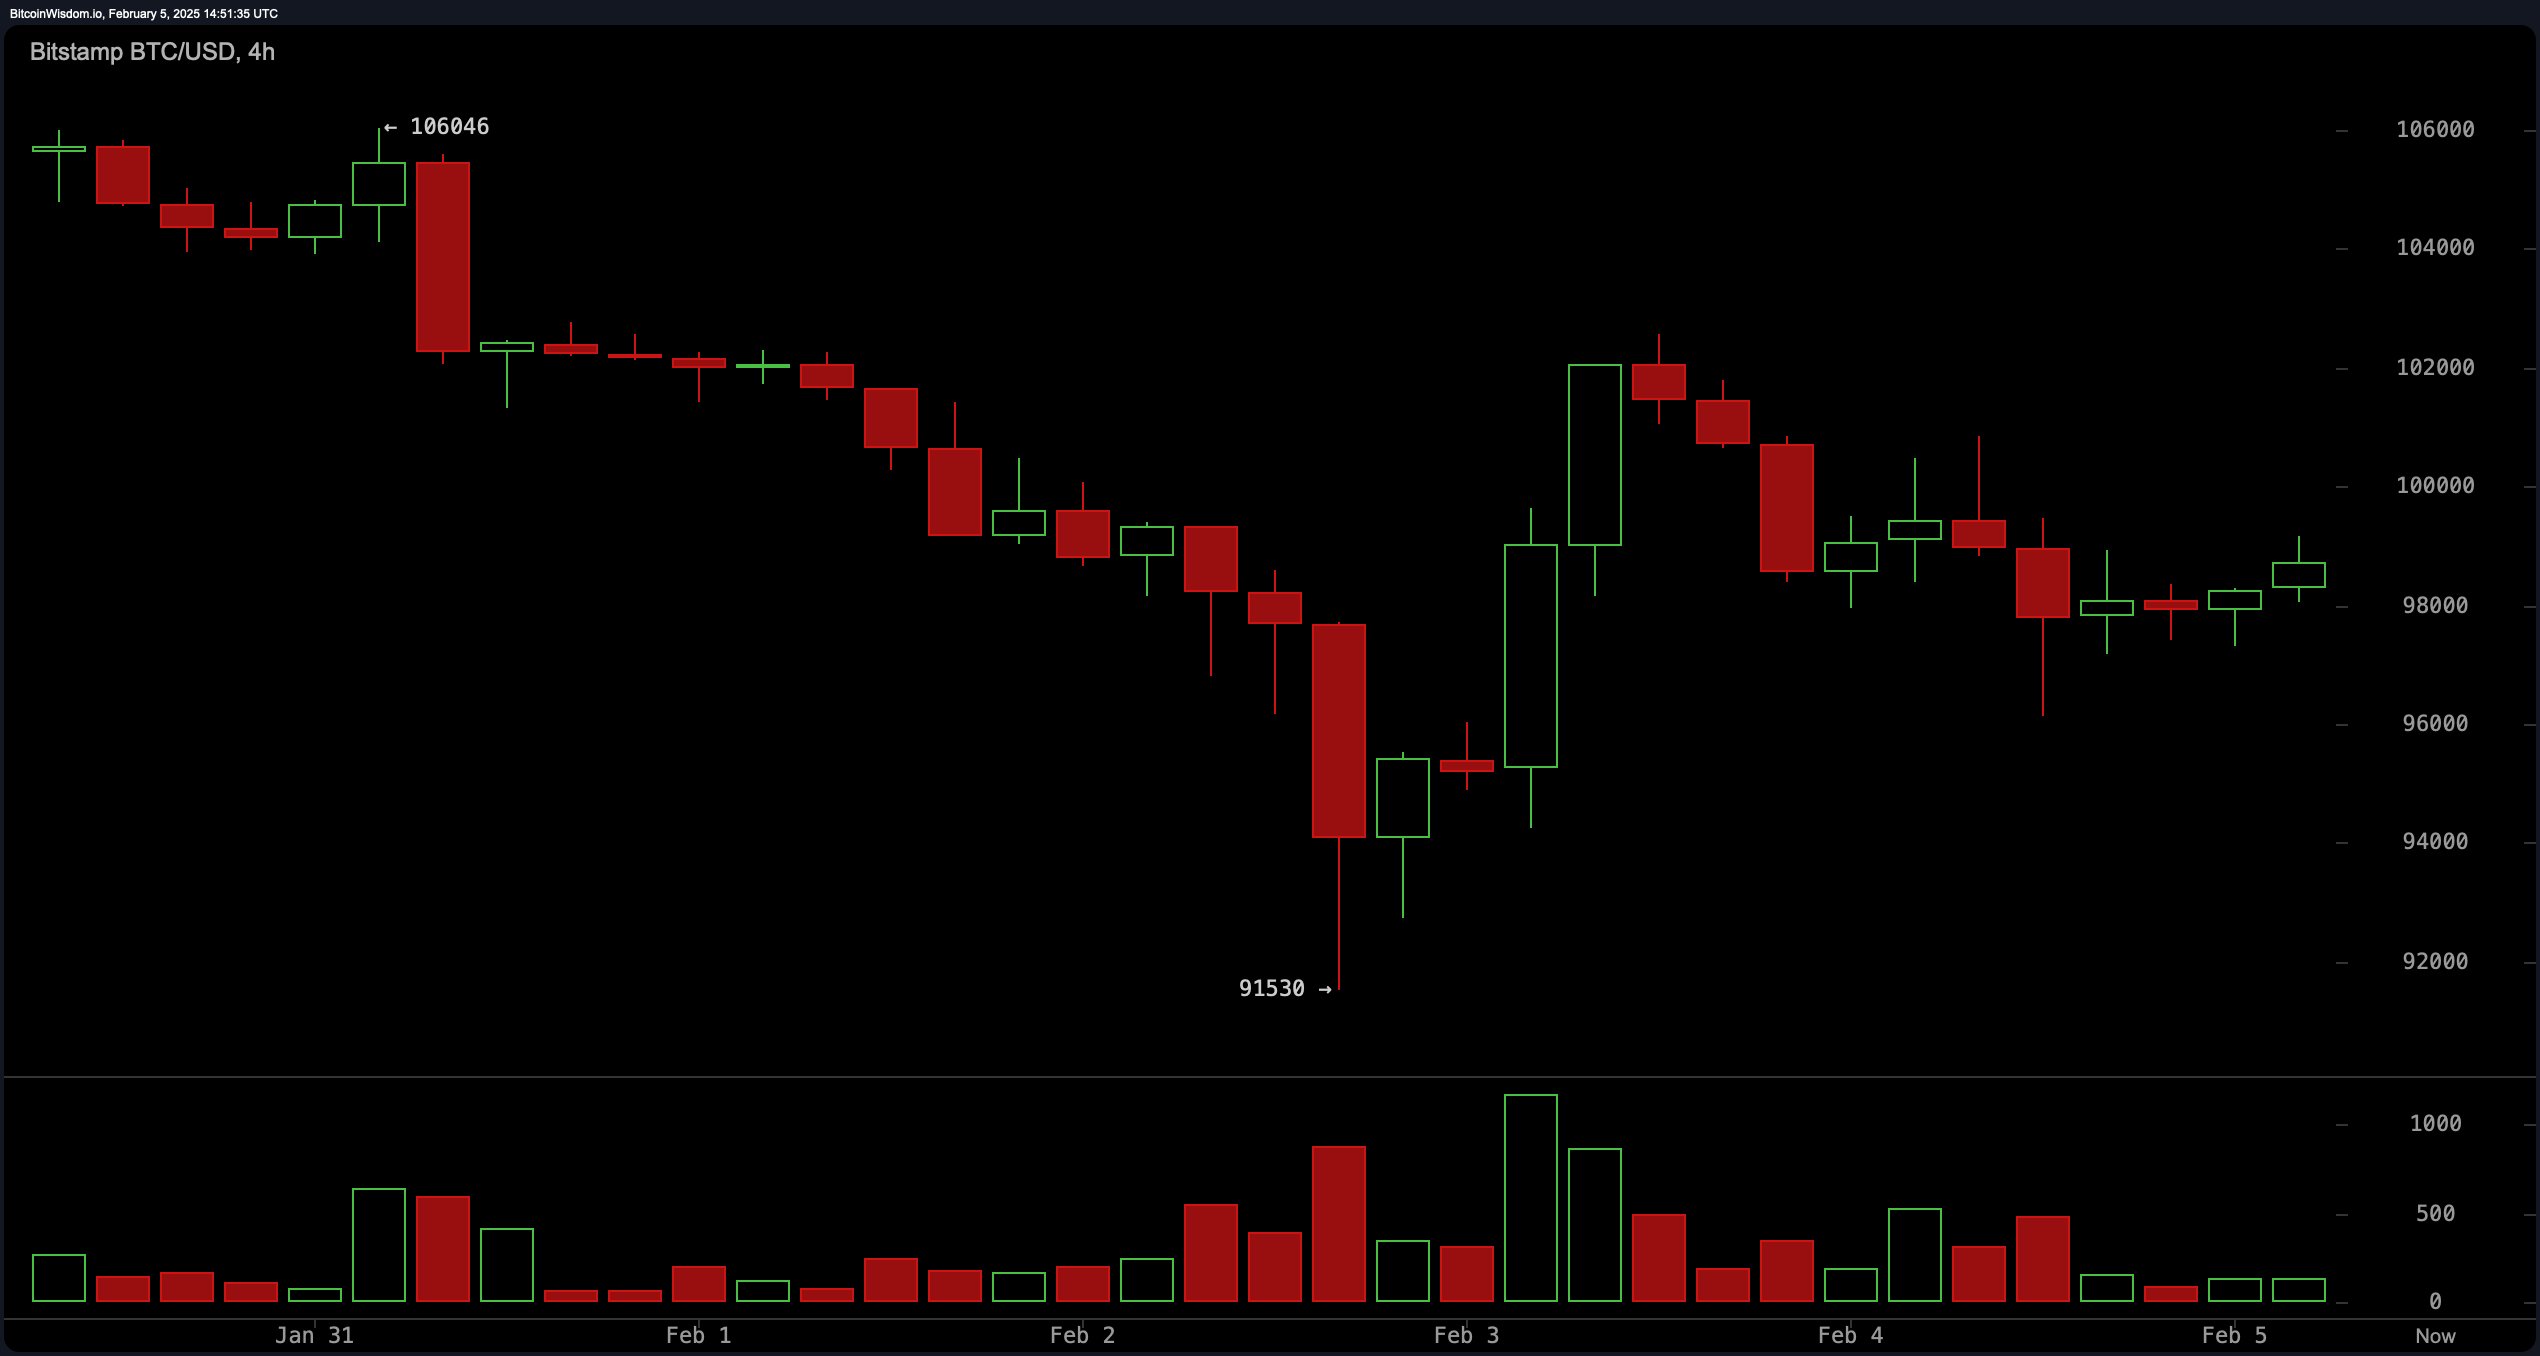
Zooming to the four-hour view, bitcoin hovers near $98,000 after a dramatic plunge from $106,000 to $91,500. A fleeting rally flickers, yet the asset remains shackled beneath critical resistance. Holding above $96,000 could fuel a climb toward $102,000-$104,000; a slip below might reignite a descent toward $91,000. The ADX’s muted 20 reading hints at a market caught in indecision, favoring sideways drift over decisive motion.

BTC/USD via Bitstamp 4H chart on Feb. 5, 2025.
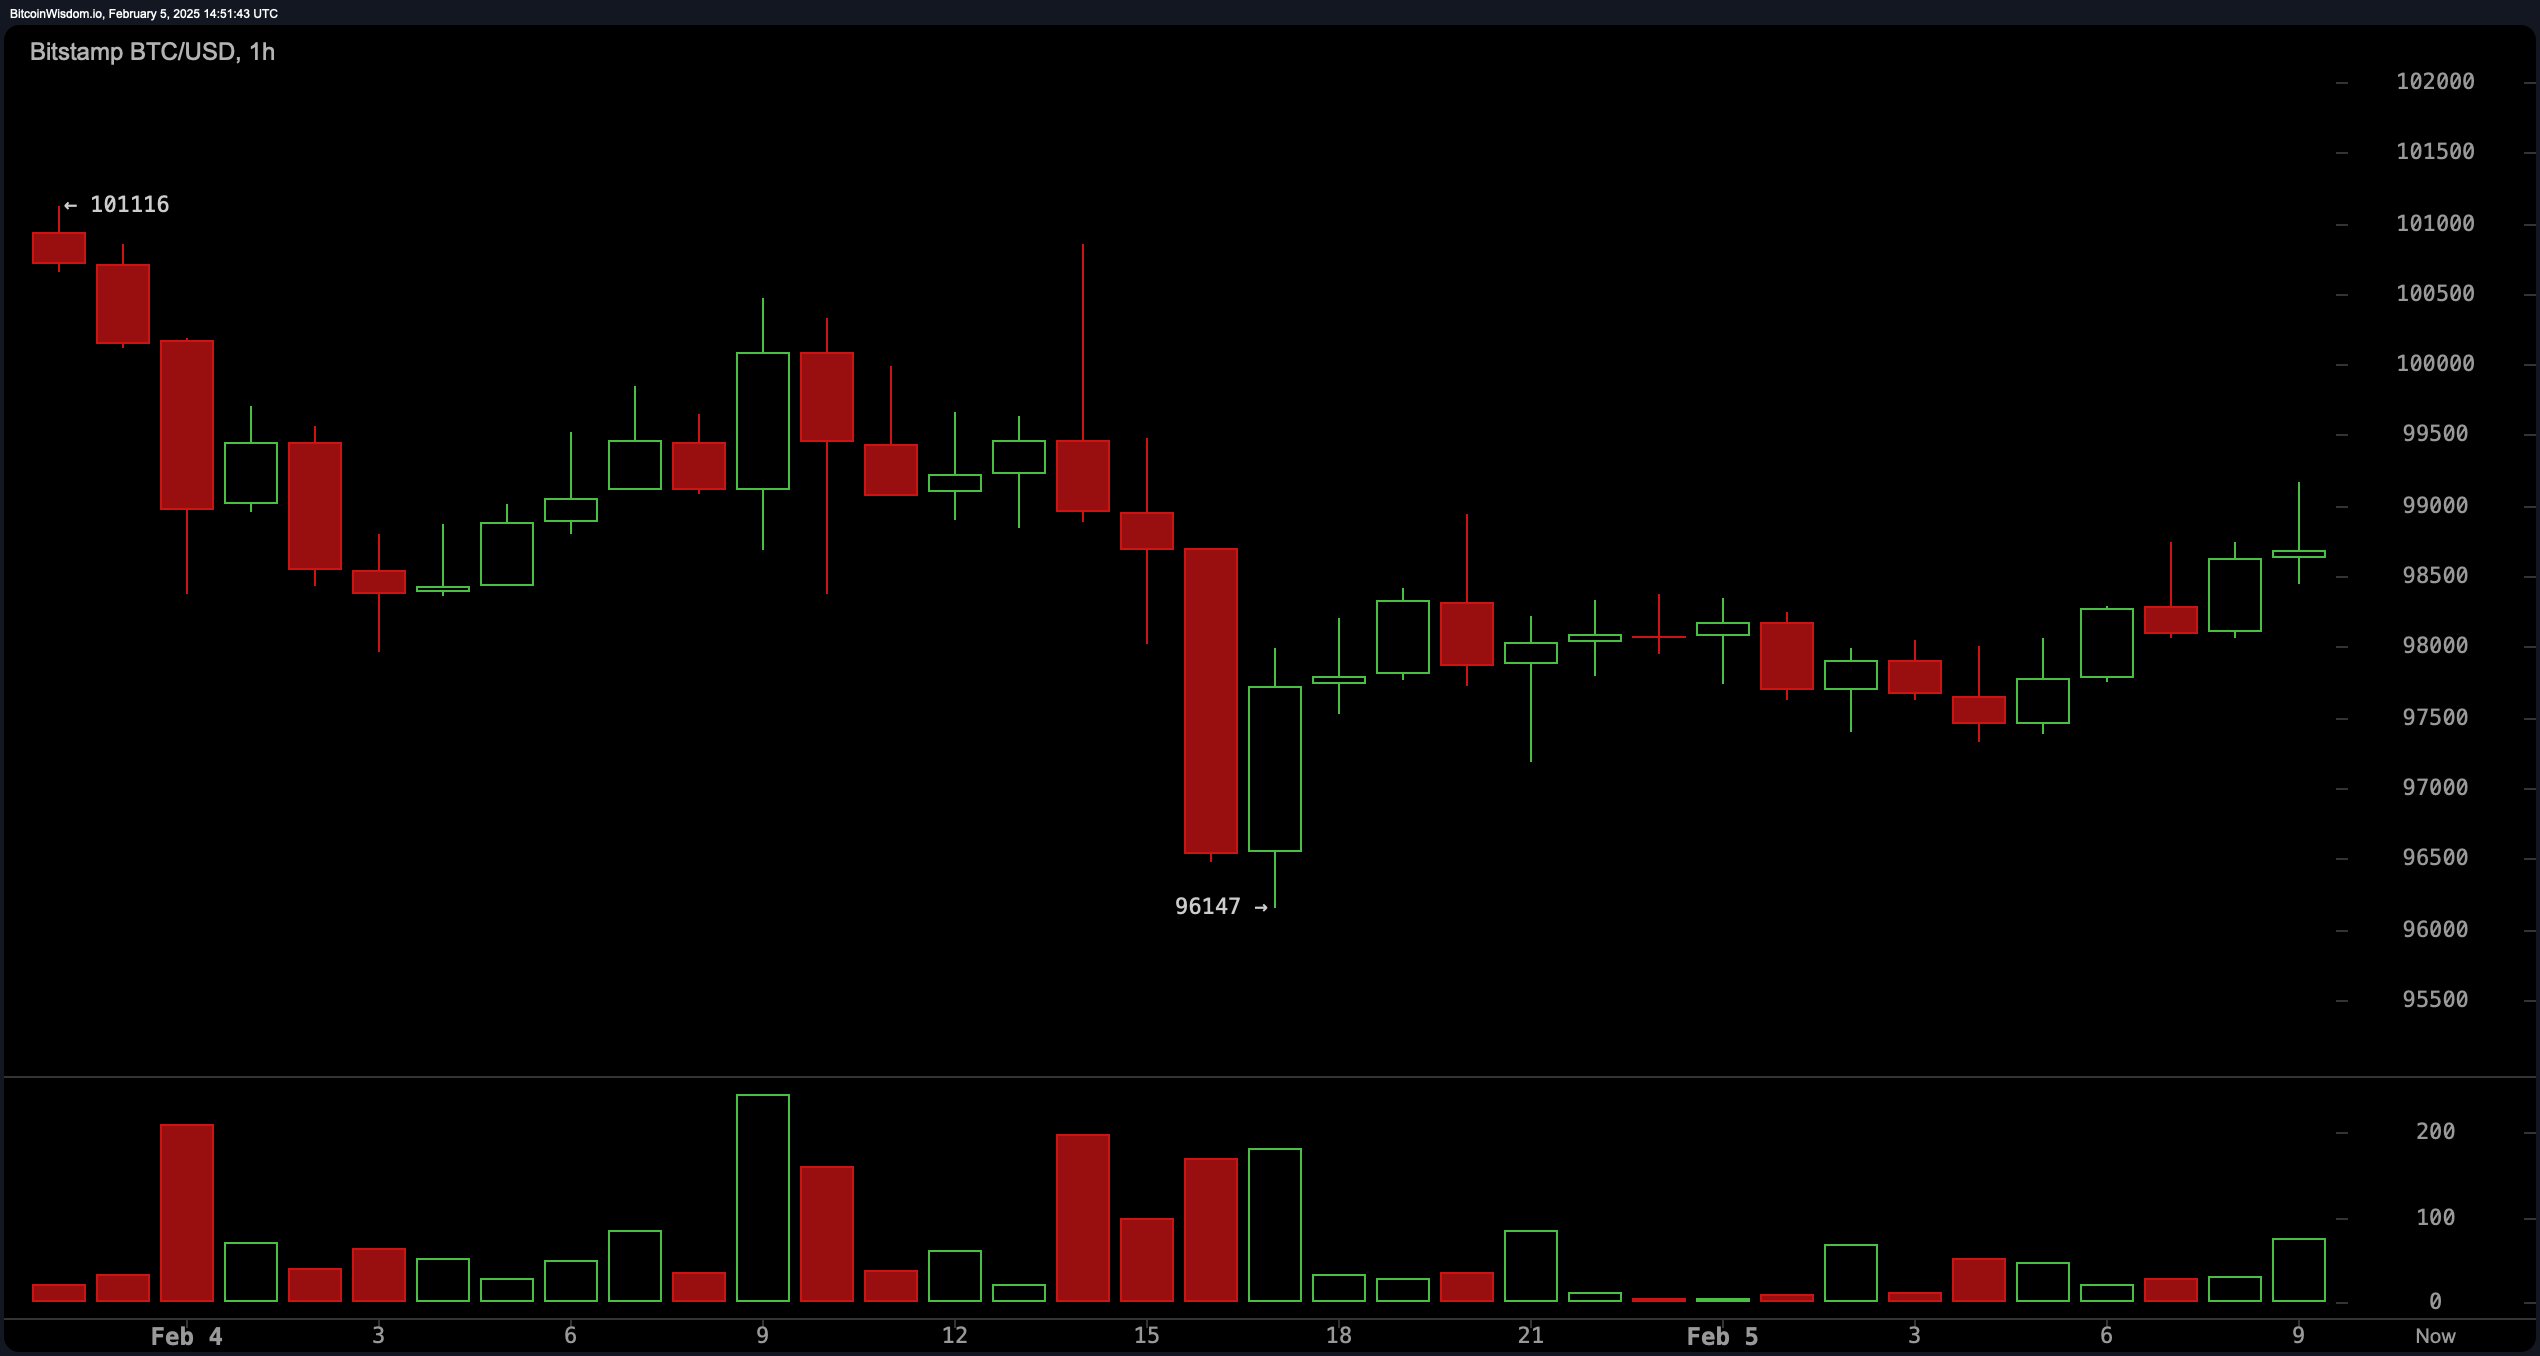
The one-hour lens reveals incremental troughs, hinting at possible recovery. A spirited rebound from $96,147 has anchored prices in a $98,500-$99,000 corridor. The RSI, parked at 47, mirrors trader ambivalence. Nimble traders eye $101,000-$102,000 if $98,500 holds, though rejection at $101,000 risks a retreat to $96,500.

BTC/USD via Bitstamp 1H chart on Feb. 5, 2025.
Shorter-term moving averages lean decisively bearish: the 10-period EMA (100,555) and SMA (101,072) flash sell signals, echoed by the 20-period EMA (100,845) and SMA (102,427). Longer horizons tell a brighter story: the 50-period EMA (98,844) and SMA (98,830) beckon buyers, harmonizing with bullish whispers from broader timeframes.
Bitcoin teeters at a crossroads. Sustained footing above $98,000 could catalyze an assault on $104,000-$109,000. Should this bastion crumble, the digital asset may tumble toward the $91,000-$93,000 lifeline—a battleground where bulls and bears have clashed before. The stage is set; the next act hinges on whether conviction or caution claims the spotlight.
Bull Verdict:
Bitcoin’s ability to hold above $98,000 and form higher lows on the short-term chart suggests growing buying pressure, with a potential breakout toward $104,000 to $109,000 if momentum strengthens. Long-term moving averages indicate bullish support, and if resistance levels are breached, a renewed uptrend could take bitcoin closer to its all-time high.
Bear Verdict:
The prevailing sell signals across short-term moving averages, alongside resistance at $101,000 and $104,000, suggest bitcoin may struggle to sustain upward momentum. A failure to hold above $98,000 could lead to a breakdown toward $96,000 and potentially $91,000, reinforcing a bearish outlook in the near term.
免责声明:本文章仅代表作者个人观点,不代表本平台的立场和观点。本文章仅供信息分享,不构成对任何人的任何投资建议。用户与作者之间的任何争议,与本平台无关。如网页中刊载的文章或图片涉及侵权,请提供相关的权利证明和身份证明发送邮件到support@aicoin.com,本平台相关工作人员将会进行核查。


