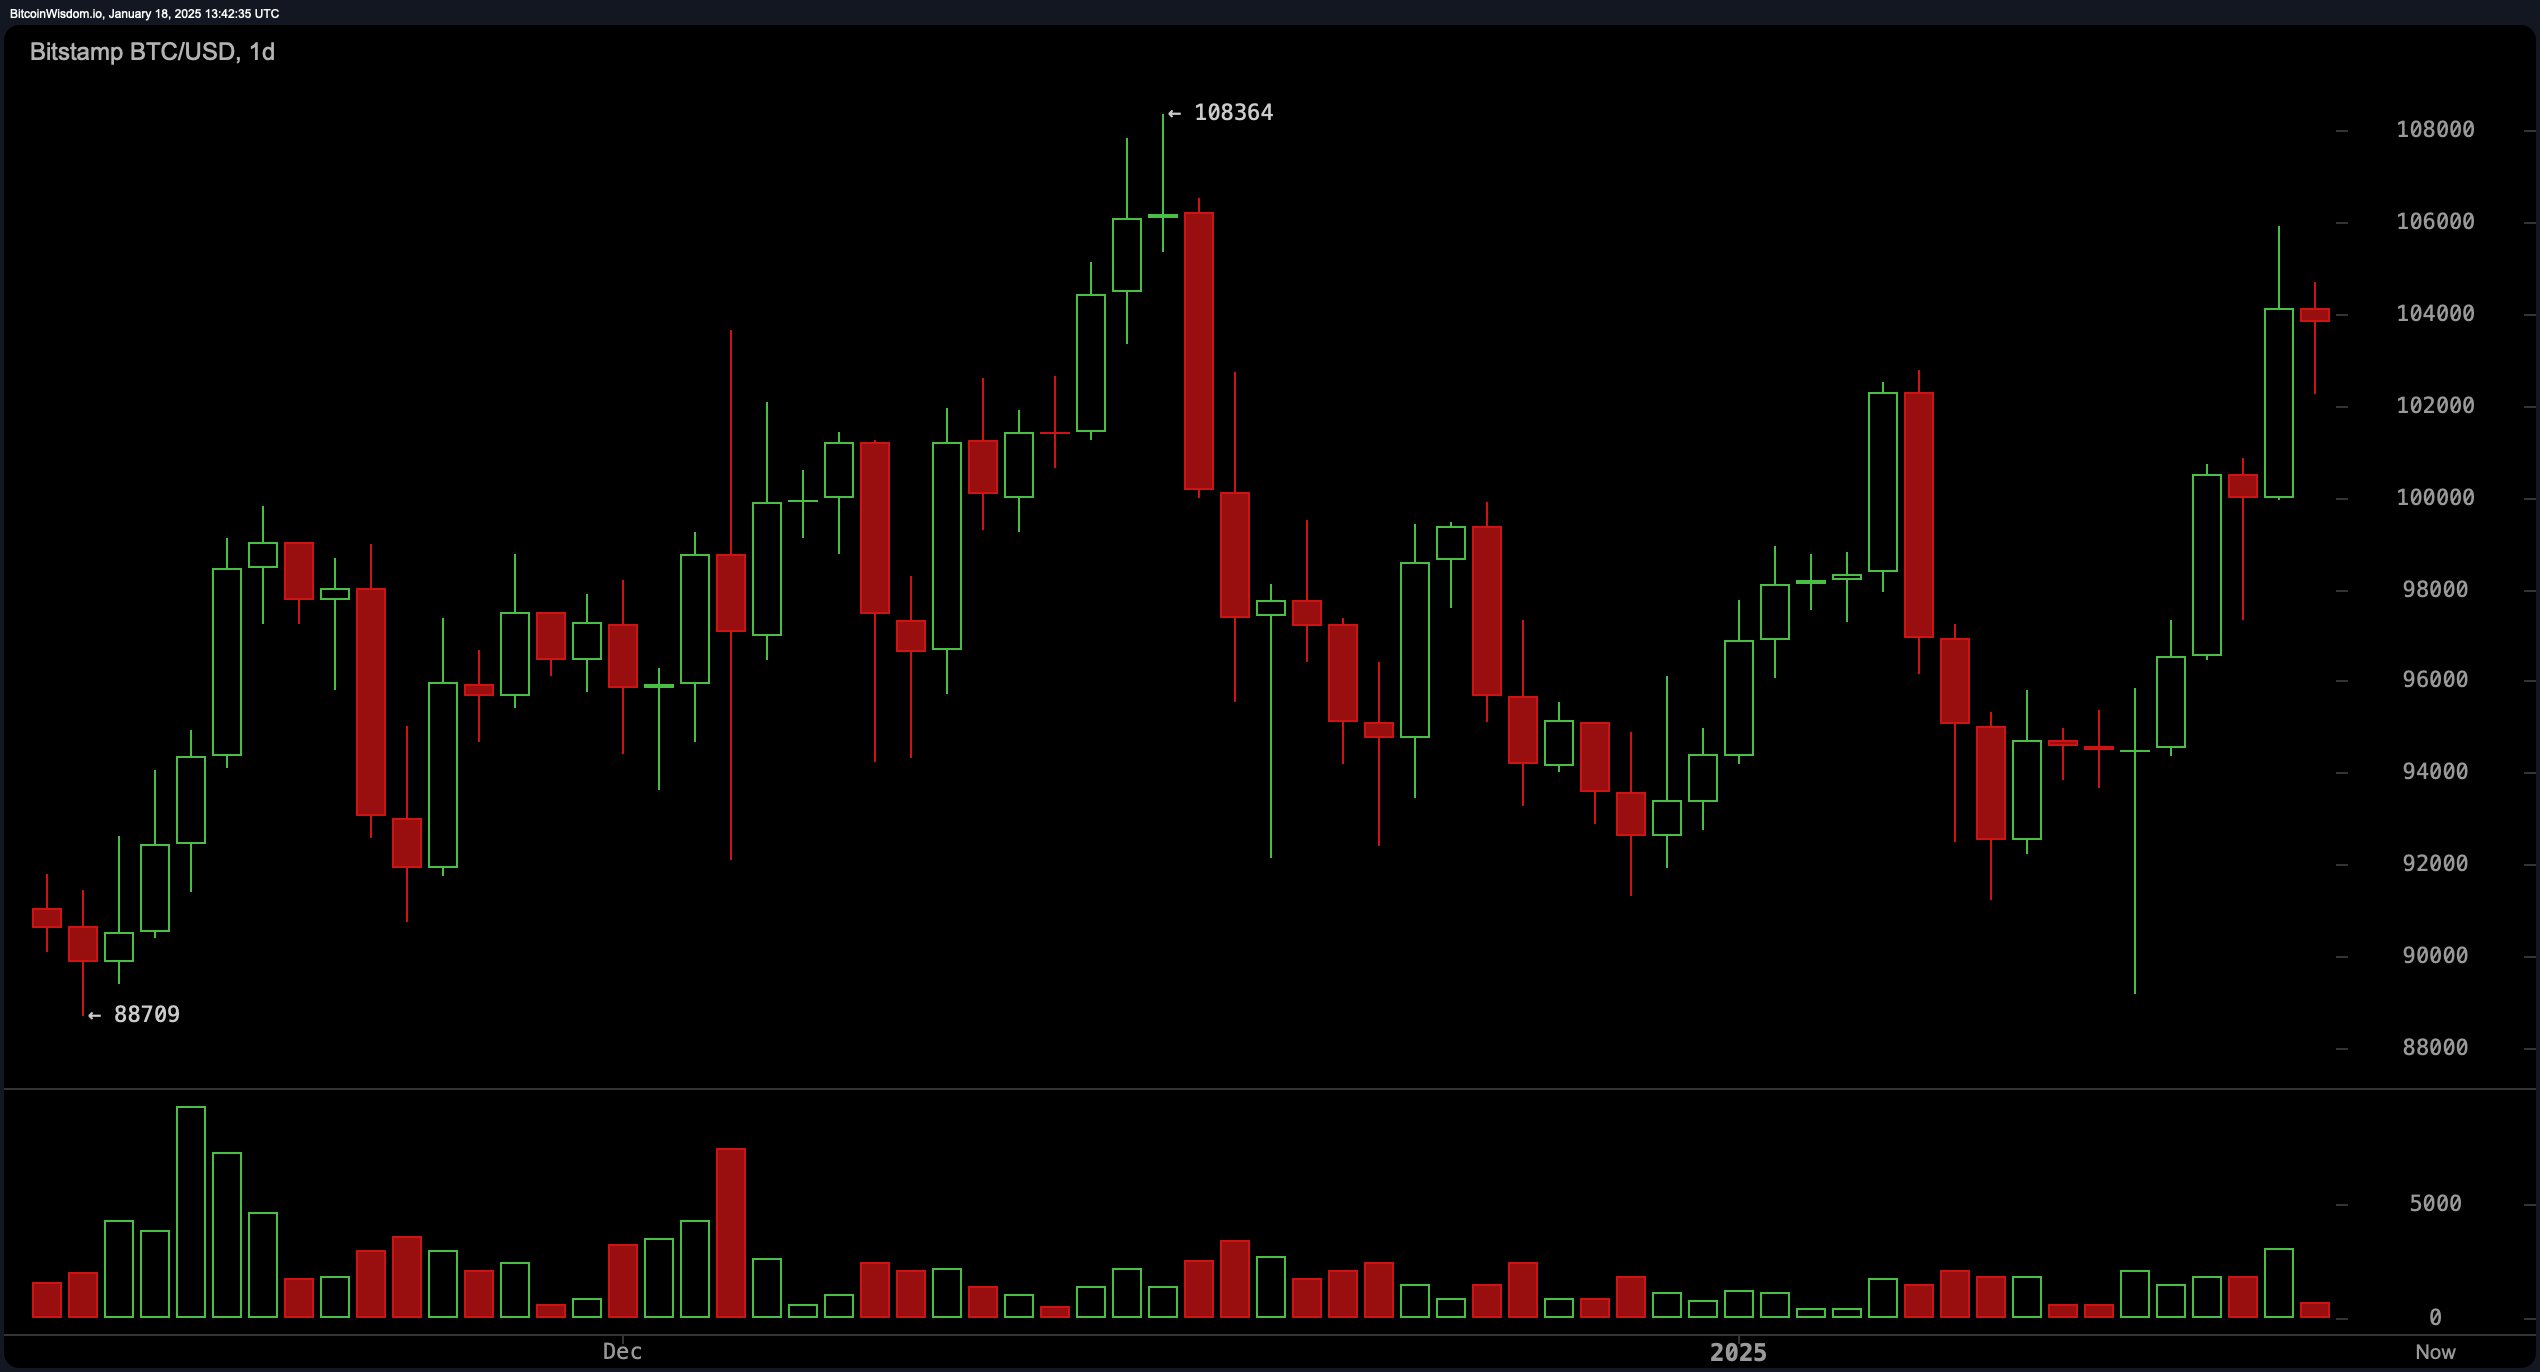
From the perspective of the daily chart, bitcoin’s trajectory remains resolutely upward, characterized by the formation of progressively higher highs and higher lows following its recovery from a plunge below $90,000. The asset recently reached an apex at $108,000 before undergoing a measured retracement, now consolidating within a structurally supportive zone near $103,000. Increased trading volumes accompanying upward price movements indicate intensified demand, while the reduced activity during price corrections points to a waning of selling pressure. Key thresholds to observe include the $108,000 resistance level and a support zone centered around $98,000.

BTC/USD via Bitstamp on the 1D chart on Jan. 18, 2025.
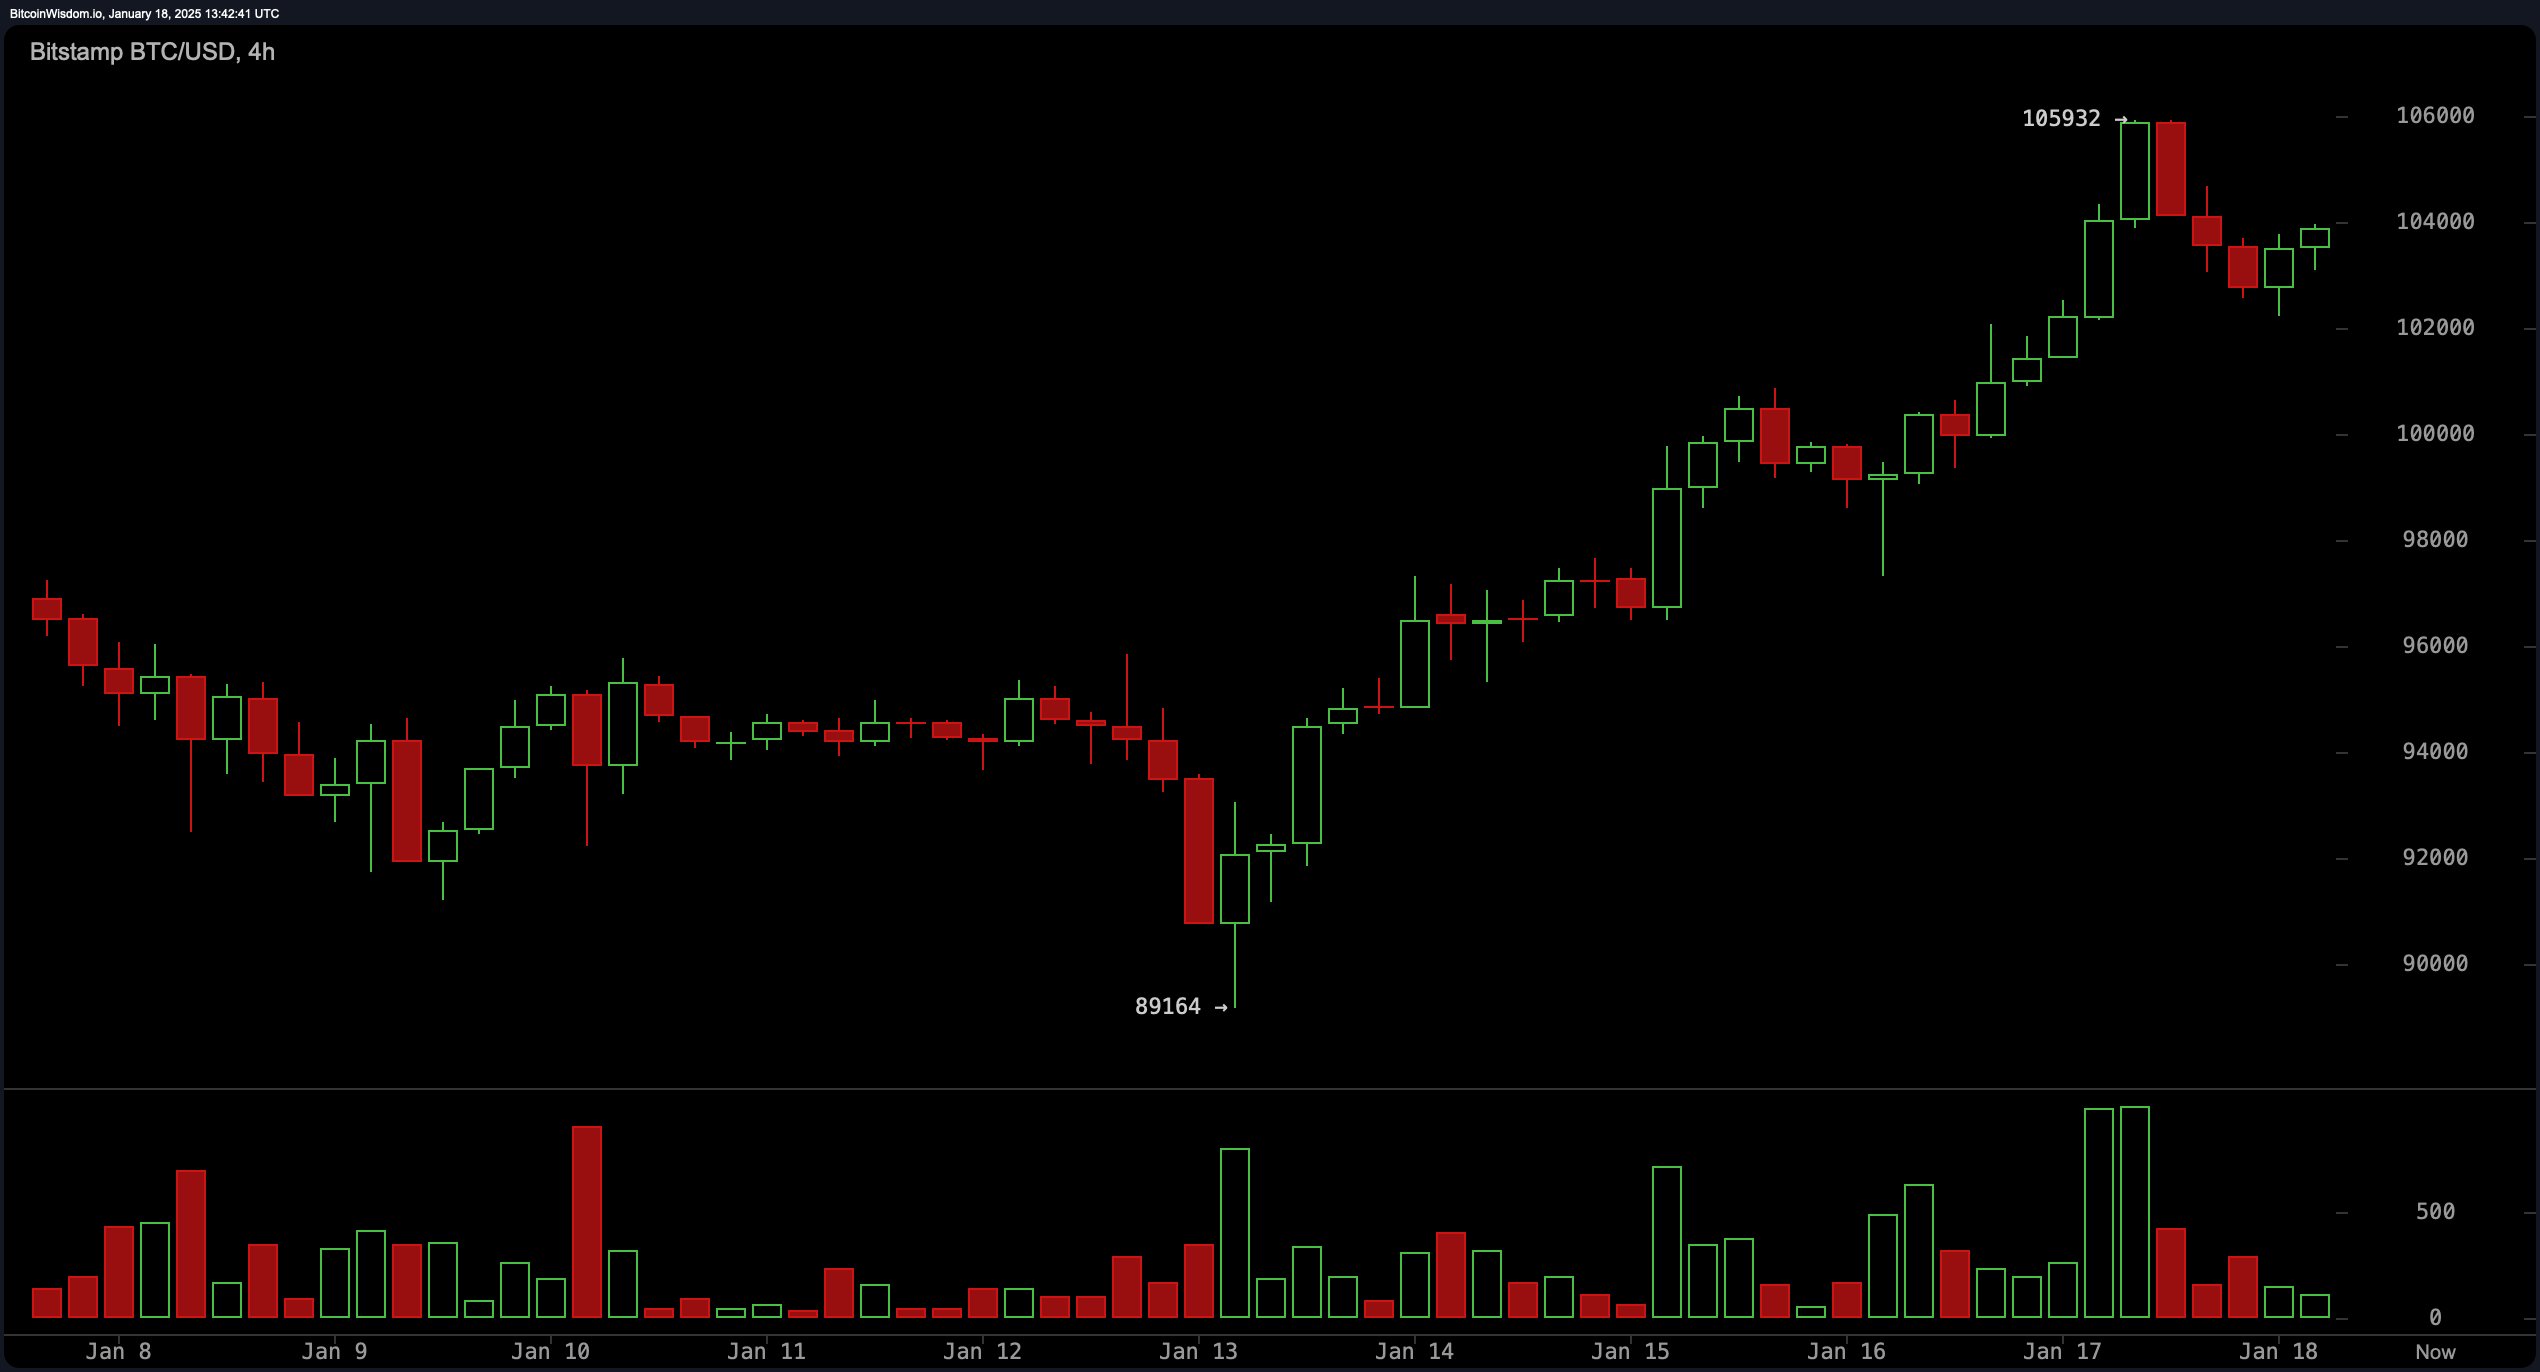
Zooming in on the 4-hour chart, the asset’s bullish momentum persists, underscored by a phase of consolidation subsequent to achieving $105,932. This interval reveals a support level around $102,000, which correlates with prior resistance, alongside the emergence of a fresh resistance boundary at $106,000. Elevated purchasing activity from Jan. 14–16 suggests an ongoing accumulation phase. Traders focusing on shorter time horizons might find opportunities to enter positions near $102,000, with $106,000 serving as a potential profit-taking target.

BTC/USD via Bitstamp on the 4H chart on Jan. 18, 2025.
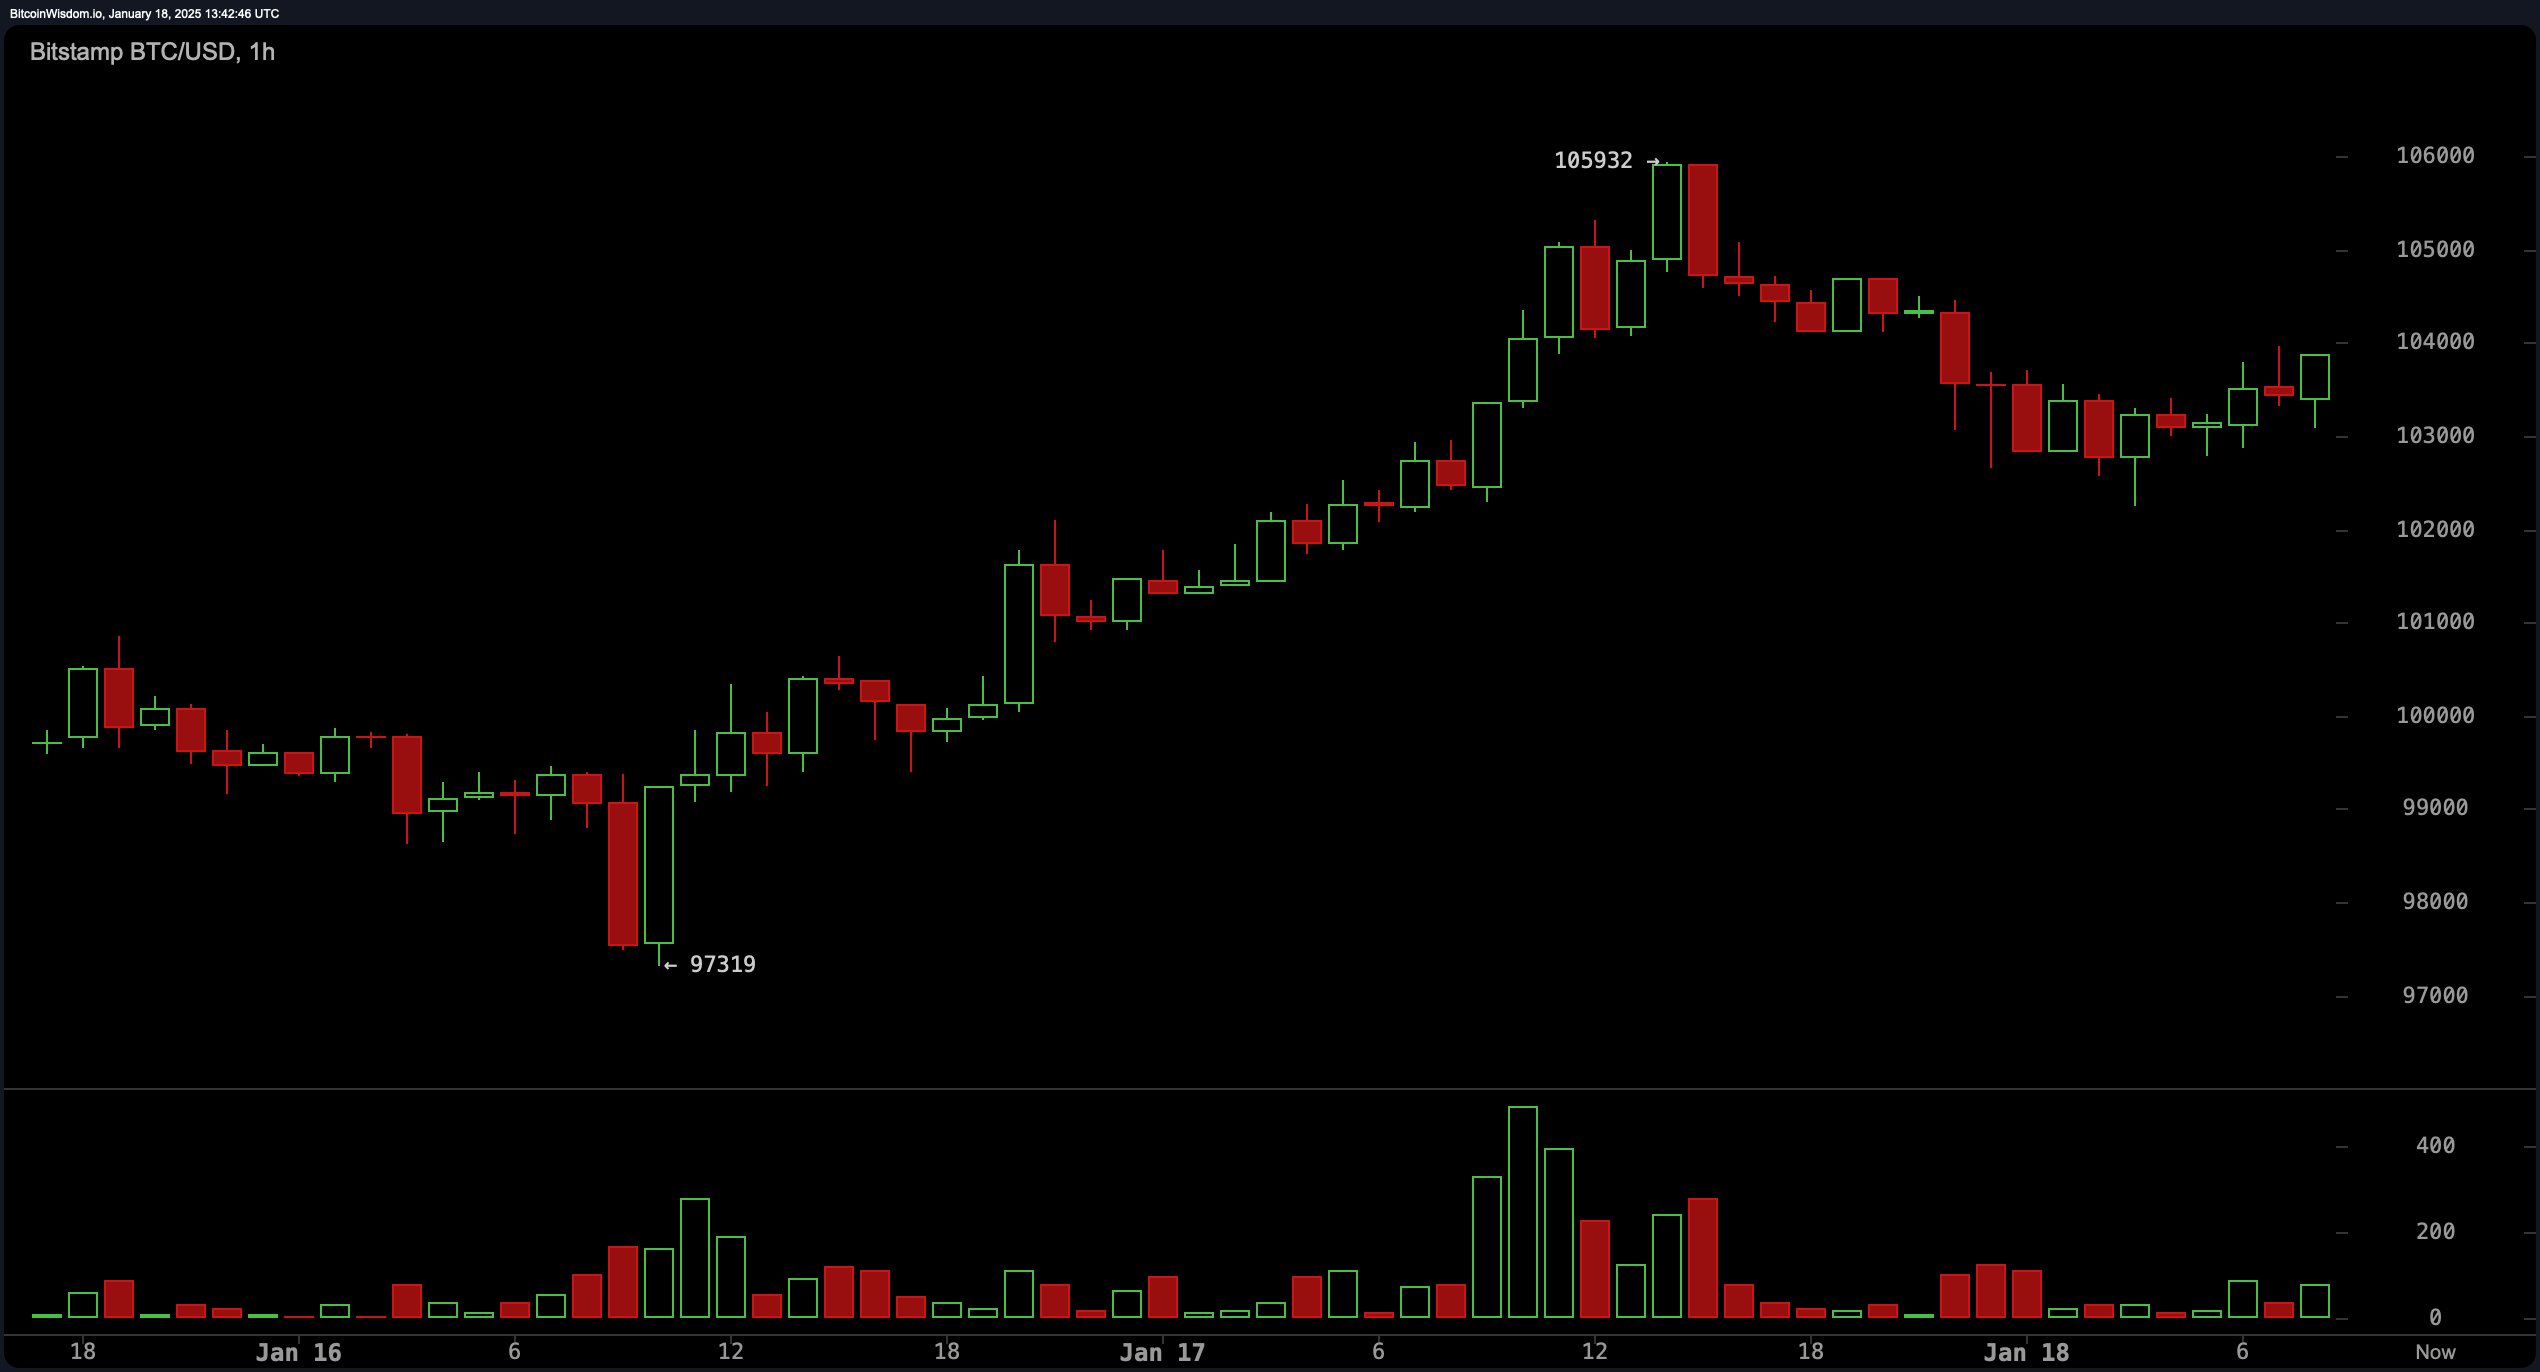
On the 1-hour chart, bitcoin’s short-term momentum exhibits signs of moderation after a pronounced advance to $105,932. The subsequent pullback into the $103,000 consolidation zone may present favorable entry points, contingent upon the integrity of critical support levels. The uptick in trading volumes near $105,000 points to increased selling activity, yet the broader trend remains constructive. Intraday traders may consider targeting $105,000 while employing disciplined stop-loss measures to mitigate risk.

BTC/USD via Bitstamp on the 1H chart on Jan. 18, 2025.
Technical oscillators present a nuanced picture: the relative strength index (RSI) at 64 indicates neutrality, while the stochastic %K at 85 similarly reflects a balanced stance. The momentum indicator, registering 8,761, supports a bullish bias, as does the moving average convergence divergence (MACD) at 1,219. Furthermore, the alignment of multiple moving averages—both exponential (EMA) and simple (SMA) across 10, 20, 50, 100, and 200 periods—continues to favor sustained upward pressure.
In sum, bitcoin’s price structure reveals a compelling bullish configuration, though traders would be prudent to monitor pivotal resistance levels and adhere to rigorous risk management protocols, particularly amid the anticipated market volatility surrounding Trump’s impending inauguration.
Bull Verdict:
Bitcoin’s current market structure, supported by consistent higher highs and lows, strong buying momentum, and favorable technical indicators, suggests that the bullish trend is firmly intact. As long as key support levels, particularly around $102,000 and $98,000, are maintained, the asset remains poised for further upward movement. A sustained breach above $108,000 could unlock additional upside potential, particularly with heightened activity expected in the coming days.
Bear Verdict:
While bitcoin’s overall trend leans bullish, caution is warranted as the asset approaches critical resistance levels at $108,000 and $106,000. Any failure to hold support near $103,000 or $102,000 could signal a deeper retracement, especially given the signs of cooling short-term momentum and increased selling pressure near recent highs. Traders should remain vigilant, as intensified market activity ahead of Trump’s inauguration could amplify volatility and disrupt the current uptrend.
免责声明:本文章仅代表作者个人观点,不代表本平台的立场和观点。本文章仅供信息分享,不构成对任何人的任何投资建议。用户与作者之间的任何争议,与本平台无关。如网页中刊载的文章或图片涉及侵权,请提供相关的权利证明和身份证明发送邮件到support@aicoin.com,本平台相关工作人员将会进行核查。


