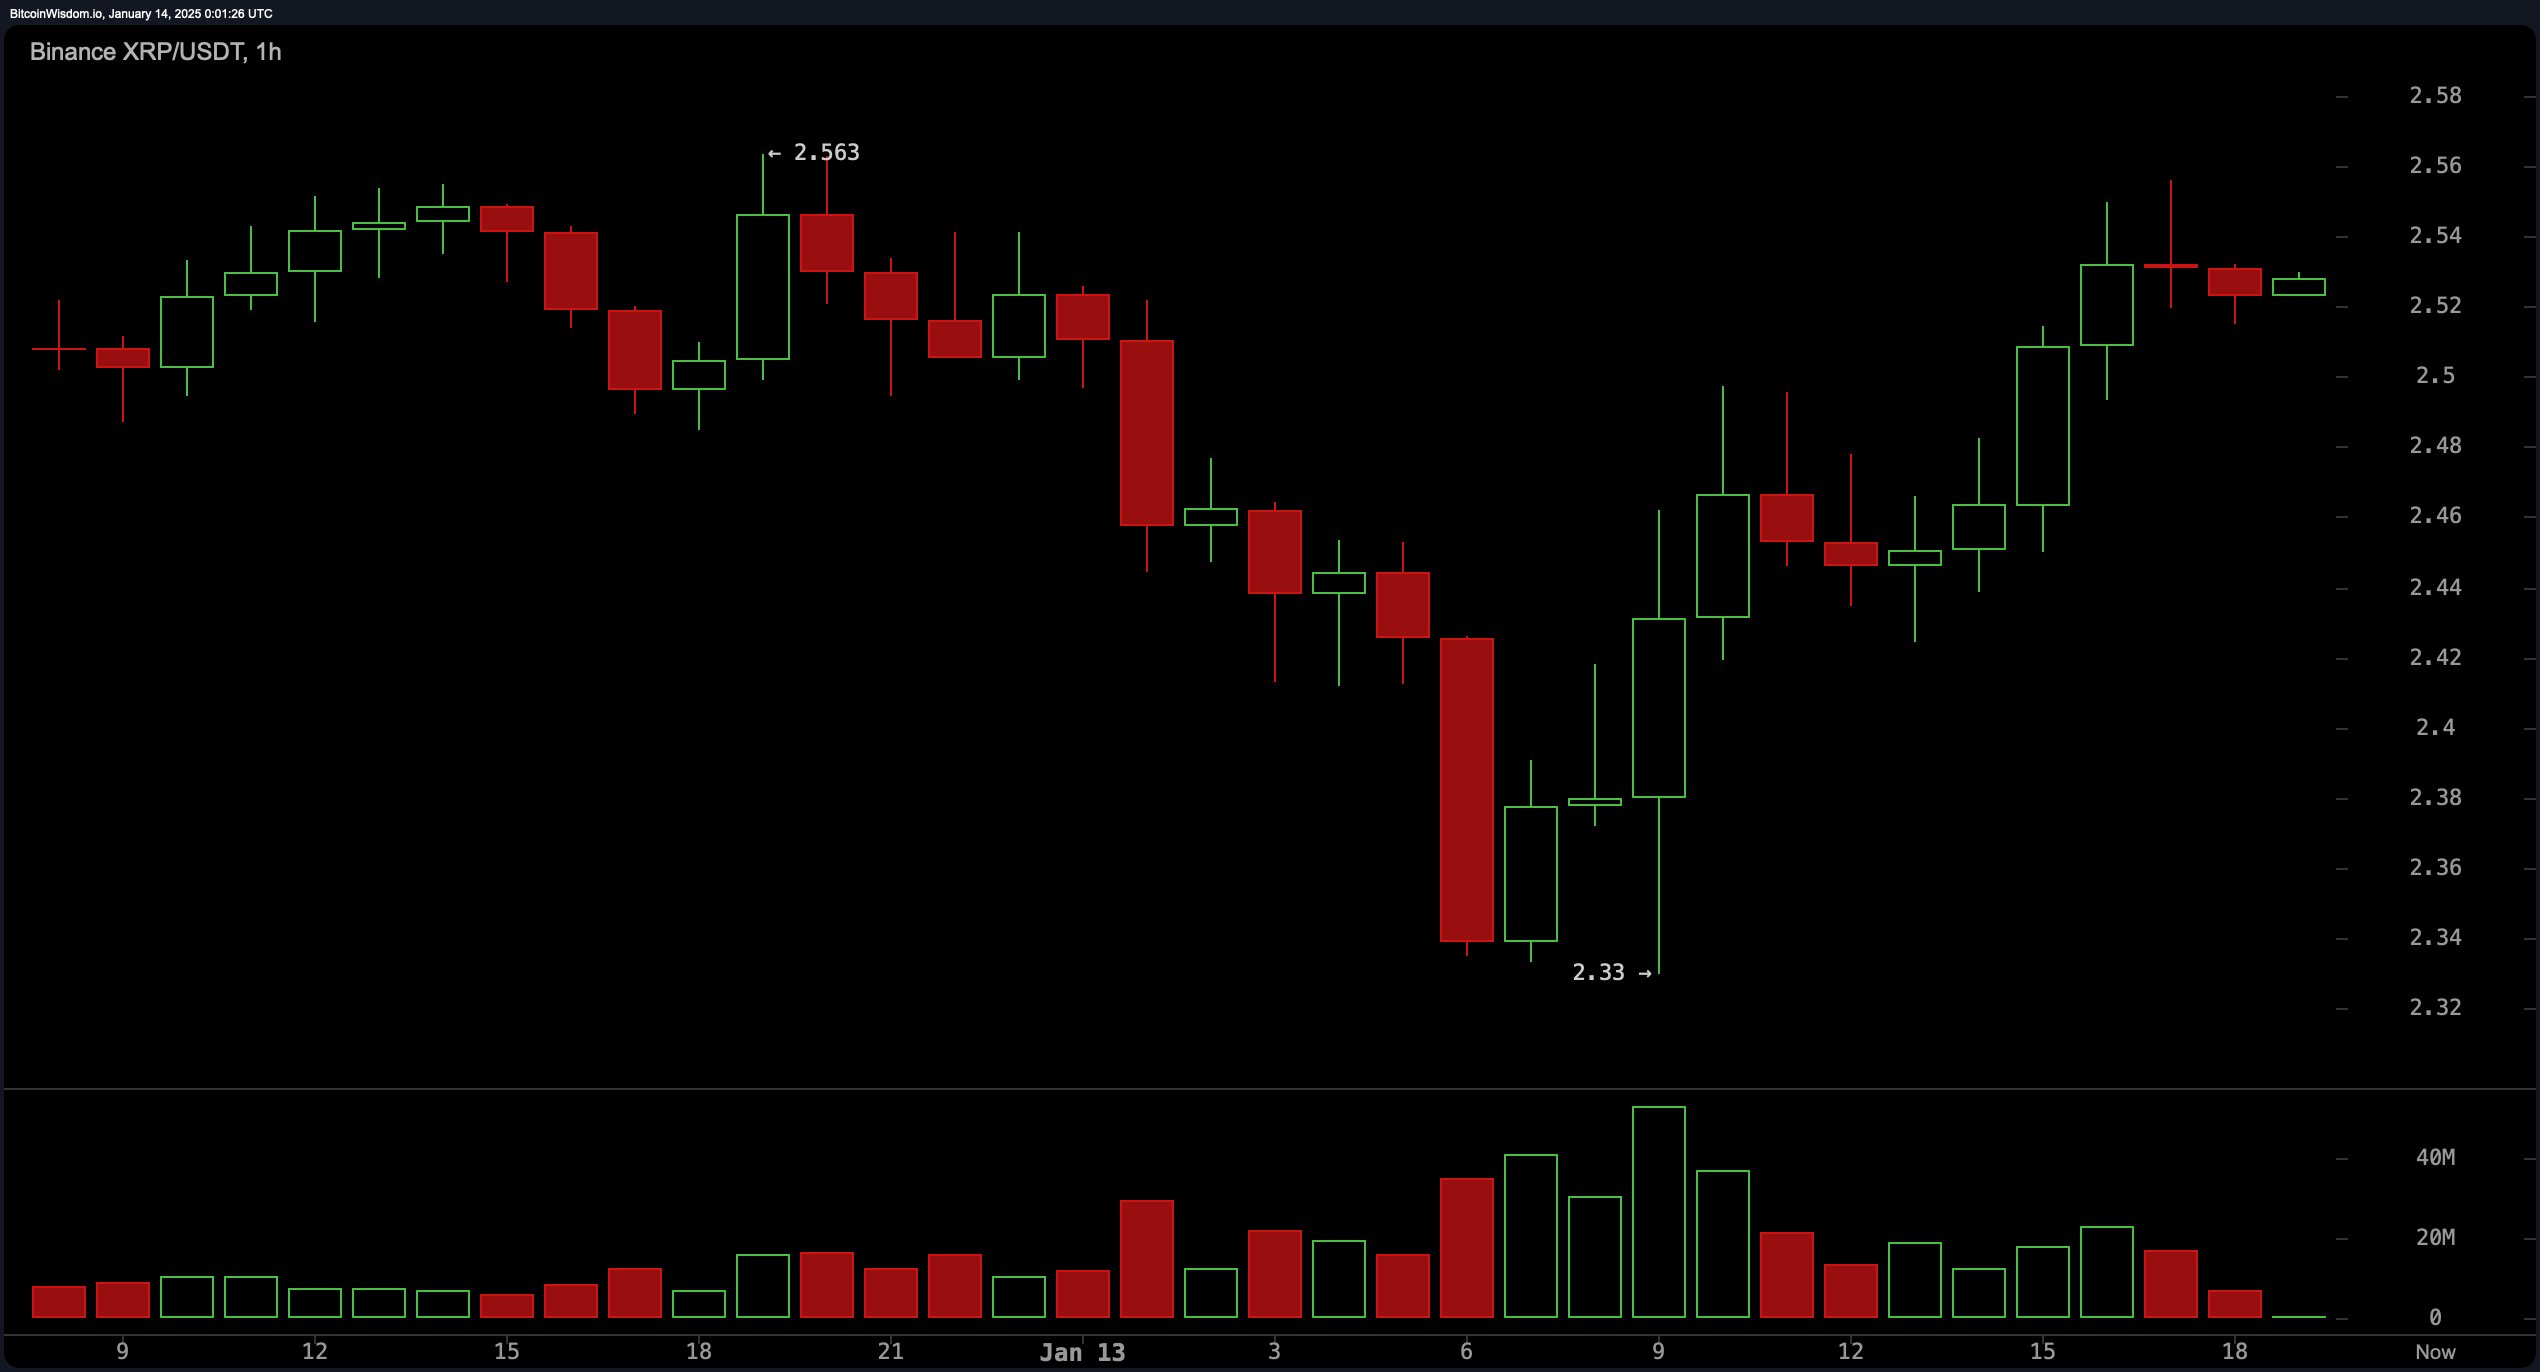
XRP’s 1-hour chart reflects a period of consolidation near $2.50-$2.55 after a recent recovery, with oscillators such as the moving average convergence divergence (MACD) indicator in a buy zone at 0.08662, indicating upward momentum. Meanwhile, declining volume highlights trader caution as the market evaluates the strength of this move. Entry opportunities near $2.48-$2.50 with a stop-loss below $2.45 could offer favorable setups for intraday strategies, while resistance at $2.55-$2.60 presents a potential exit zone.

XRP/USDT 1H chart on Jan. 13, 2025.
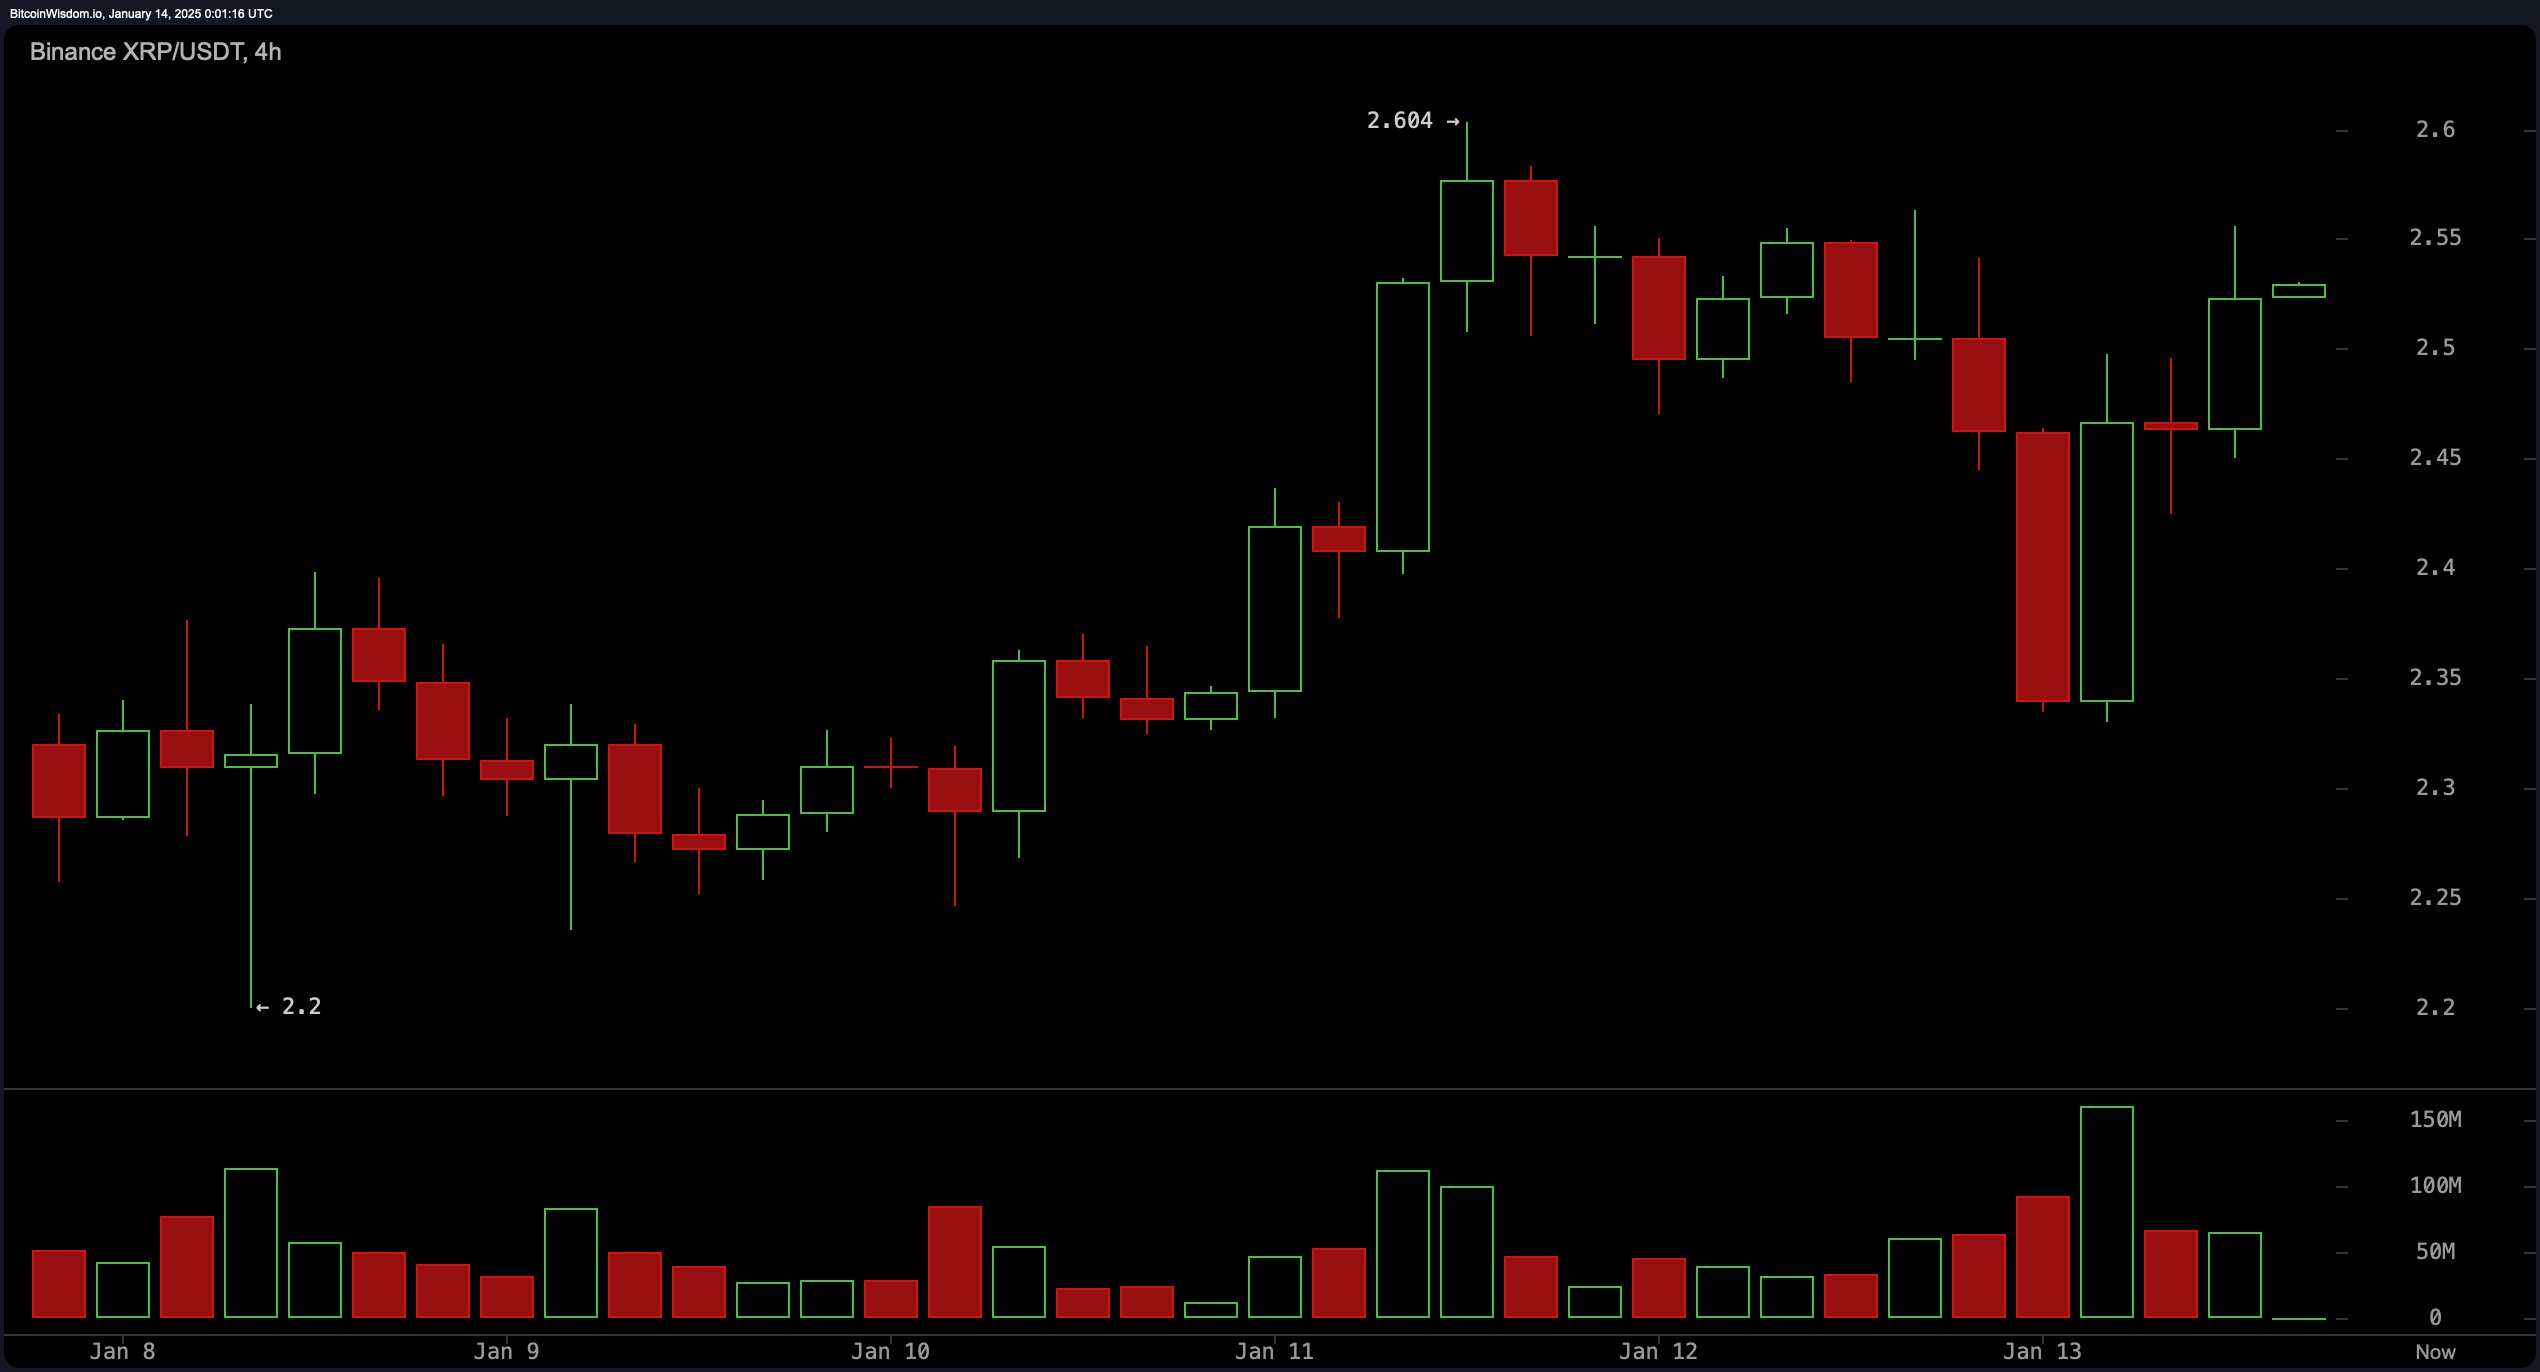
On the 4-hour chart, XRP has established higher lows, signaling an uptrend despite resistance near the $2.60 range. Key moving averages, including the exponential moving average (EMA) at $2.43729 and the simple moving average (SMA) at $2.42029, support the bullish outlook. However, volume has begun to decrease near resistance, emphasizing the need for confirmation before expecting a breakout. Retests of $2.45-$2.50 could provide ideal entry points, with stops placed conservatively below $2.40.

XRP/USDT 4H chart on Jan. 13, 2025.
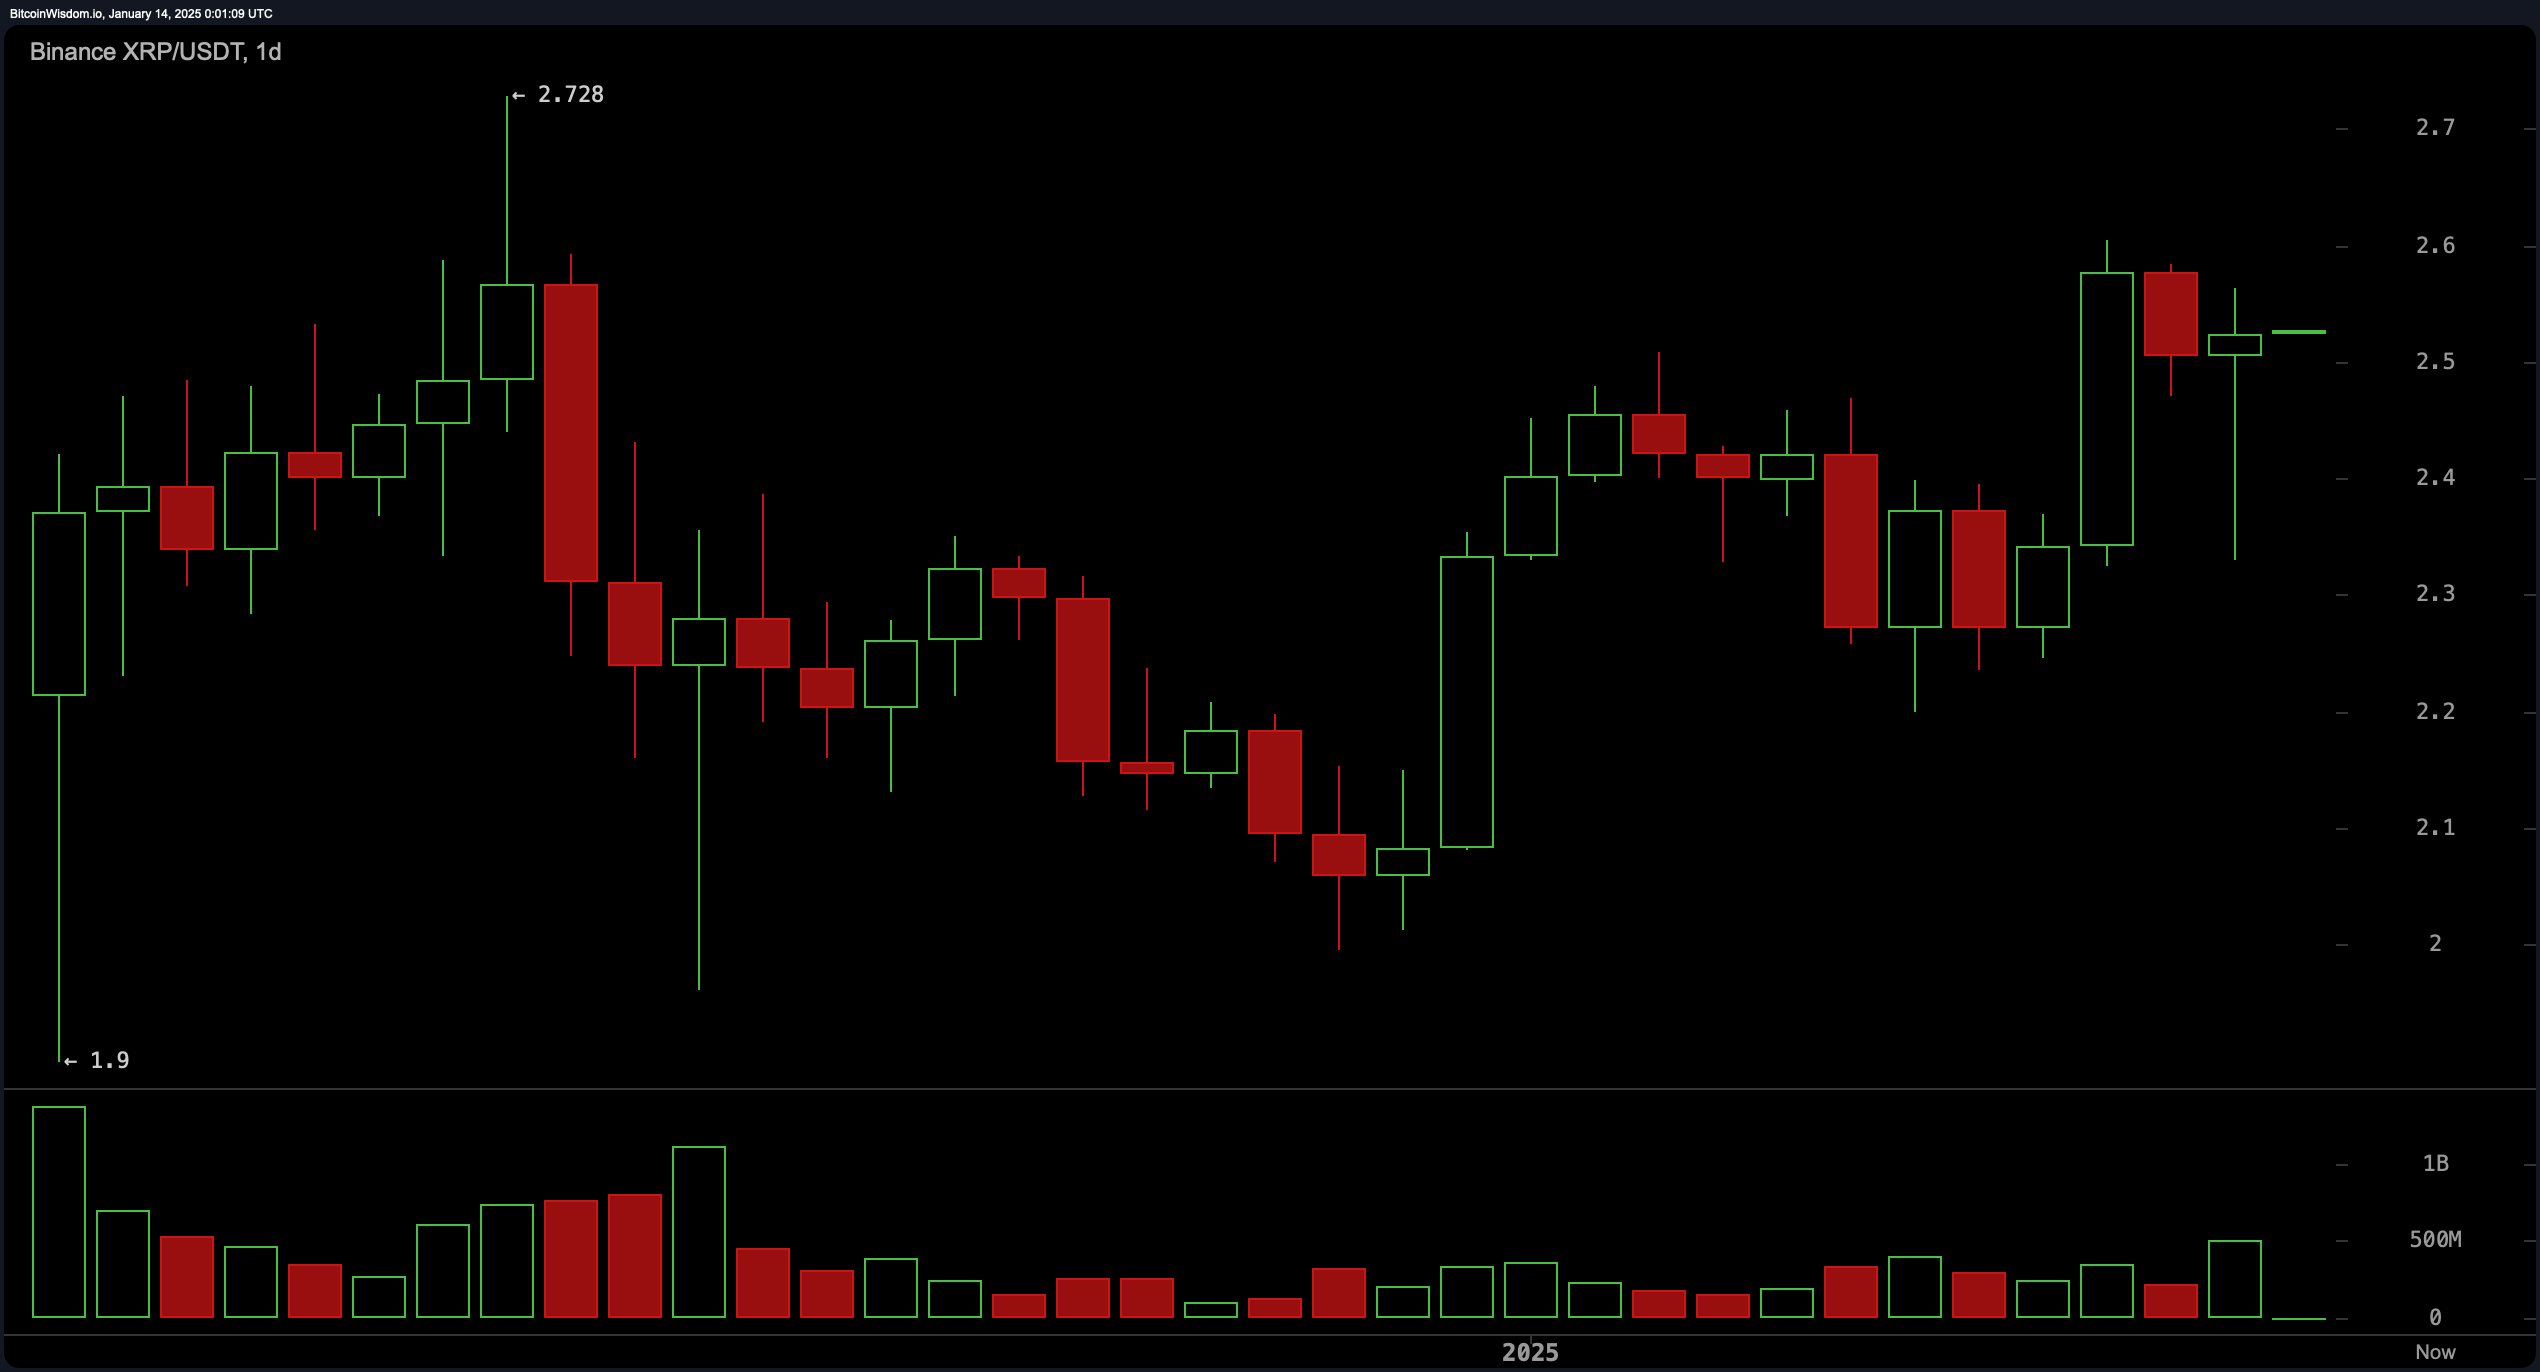
XRP, the third-largest cryptocurrency by market cap, shows a clearer picture on its daily chart, revealing a strong rebound after a recent dip. All moving averages (MAs)—ranging from the EMA (20) at $2.37322 to the SMA (200) at $1.02419—are signaling a buy. The relative strength index (RSI) at 59.39 remains neutral, suggesting room for further upside if momentum builds. Resistance at $2.70 could act as a barrier unless sustained volume drives the price higher.

XRP/USDT 1D chart on Jan. 13, 2025.
Oscillator signals across timeframes present a mixed but generally optimistic picture, with the Stochastic oscillator signaling a sell at 85.07, while the momentum indicator remains firmly in buy territory at 0.10585. These divergences underline the importance of volume as a confirming factor for directional moves at the moment.
XRP’s MAs show strong bullish momentum, with all key indicators in buy territory. The exponential moving average (EMA 10-day) is at $2.43729, while the simple moving average (SMA 10-day) is at $2.42029, reflecting short-term strength. Longer-term signals, including the EMA (200-day) at $1.28300 and the SMA (200-day) at $1.02419, confirm a robust upward trend across timeframes.
Bull Verdict:
XRP’s consistent buy signals across all moving averages and the bullish alignment of key indicators, such as the moving average convergence divergence (MACD) and momentum, suggest strong potential for upward movement. A breakout above $2.60 on increasing volume could solidify a continued bullish trend, making it an attractive asset for traders seeking long opportunities.
Bear Verdict:
Despite the bullish signals, declining volume near resistance levels and the stochastic oscillator (%K) indicating overbought conditions raise caution. Failure to break above $2.60 or a drop below $2.50 could lead to retests of lower support levels, potentially signaling a reversal or extended consolidation for XRP.
免责声明:本文章仅代表作者个人观点,不代表本平台的立场和观点。本文章仅供信息分享,不构成对任何人的任何投资建议。用户与作者之间的任何争议,与本平台无关。如网页中刊载的文章或图片涉及侵权,请提供相关的权利证明和身份证明发送邮件到support@aicoin.com,本平台相关工作人员将会进行核查。


