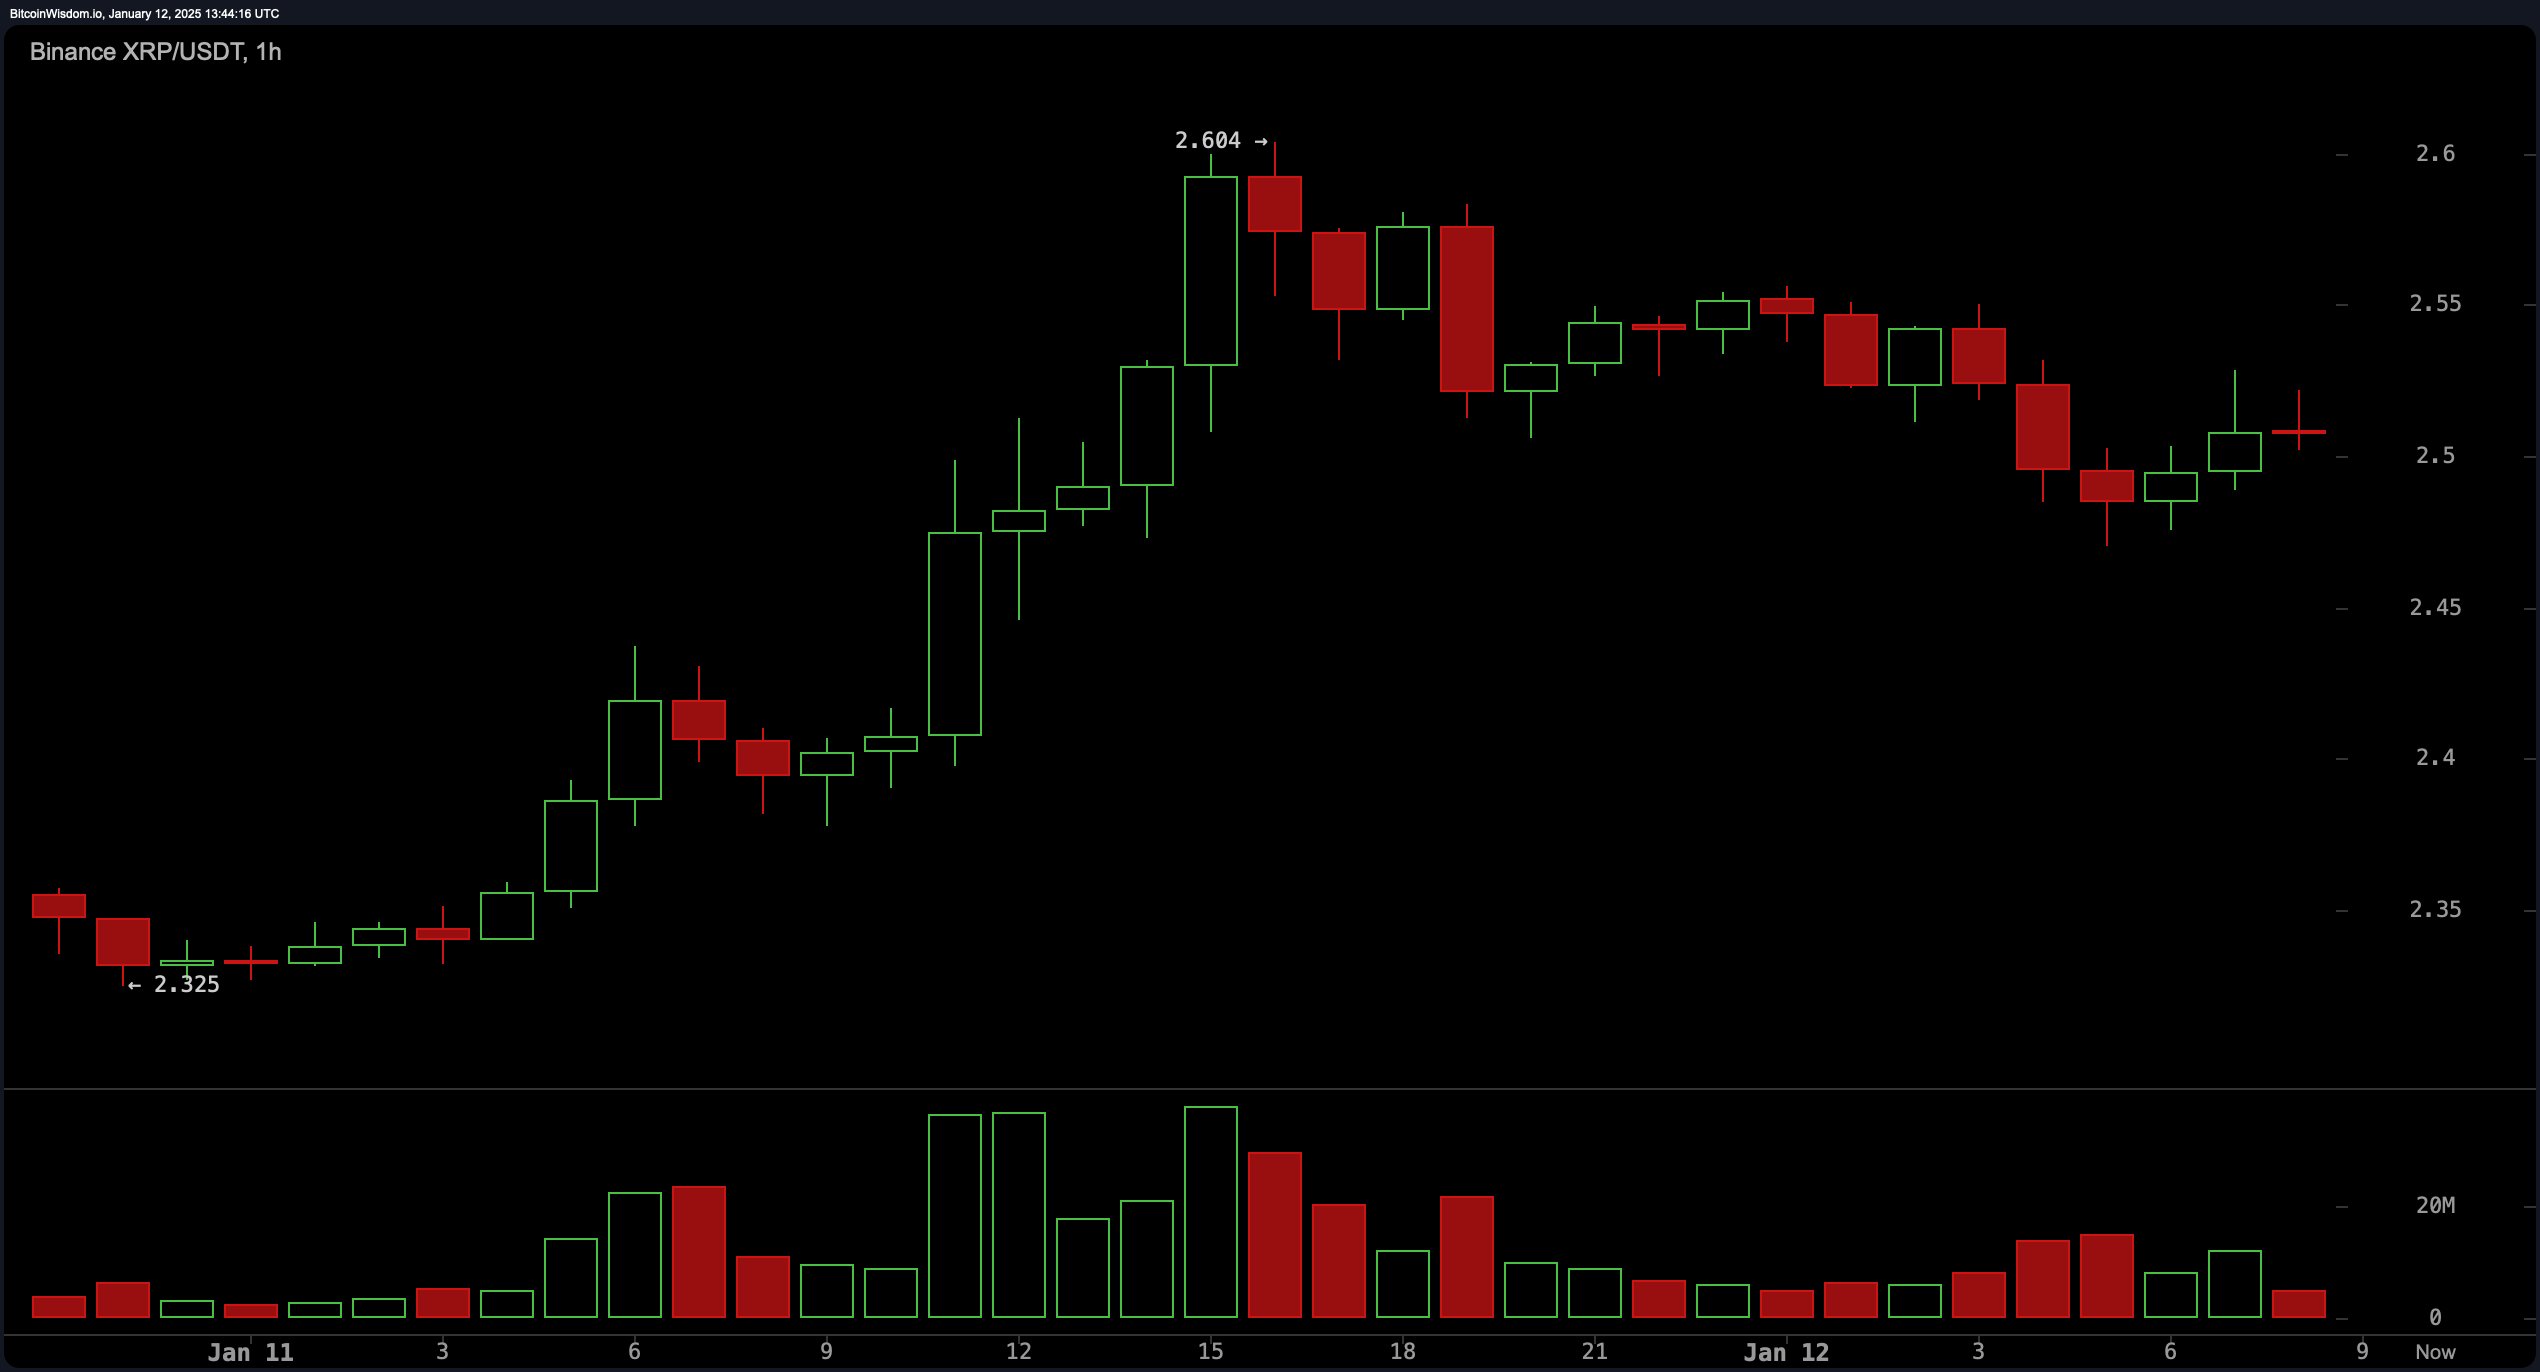
On the hourly chart, XRP appears to be in a phase of micro-consolidation, finding equilibrium near $2.50 after reaching a local peak of $2.604. Resistance emerges between $2.55 and $2.60, with support anchored at $2.45. This phase of declining volume suggests a measured correction rather than a bearish shift, presenting traders with potential short-term entry points near support levels, targeting exits between $2.60 and $2.65.

XRP/USDT 1H chart via Binance on Sunday, Jan. 12, 2025.
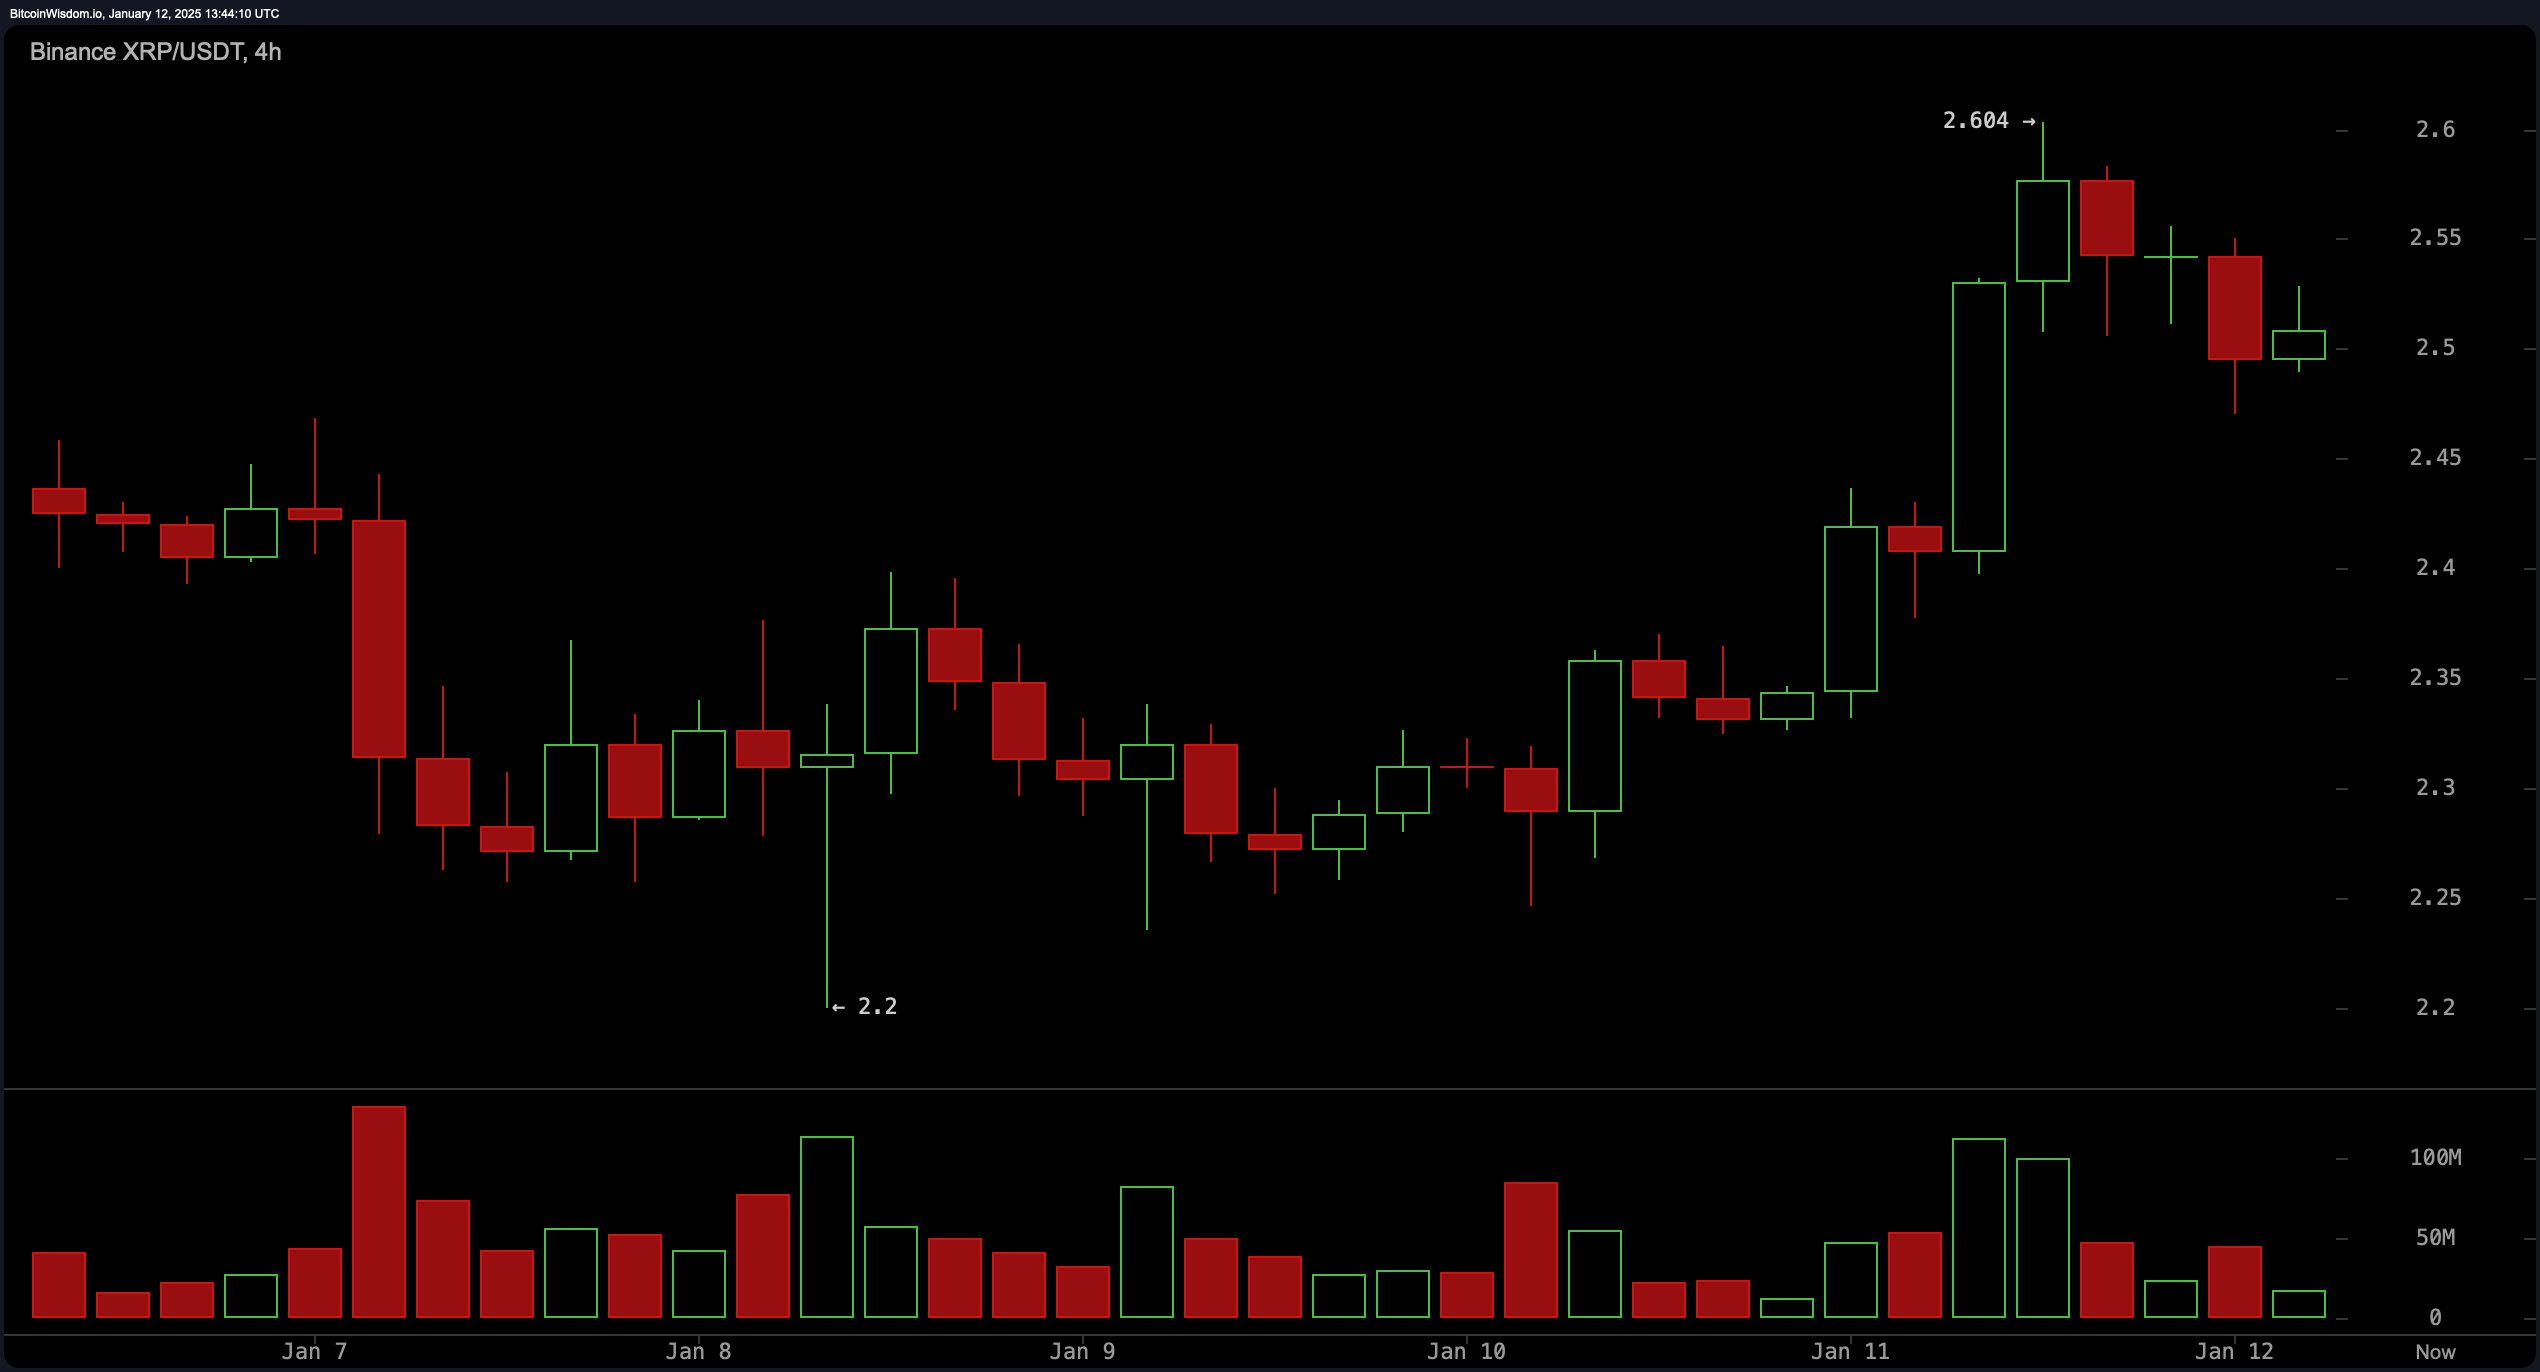
Zooming out to the 4-hour chart, XRP retains its upward trajectory following a substantial price rally earlier in the week, stabilizing near $2.50. Resistance zones lie at $2.60 and $2.70, with support reliably holding between $2.45 and $2.50. Strategically, traders might consider entry opportunities on a confirmed breakout above $2.60 or a retracement to $2.45, setting profit targets within the $2.60 to $2.70 range.

XRP/USDT 4H chart via Binance on Sunday, Jan. 12, 2025.
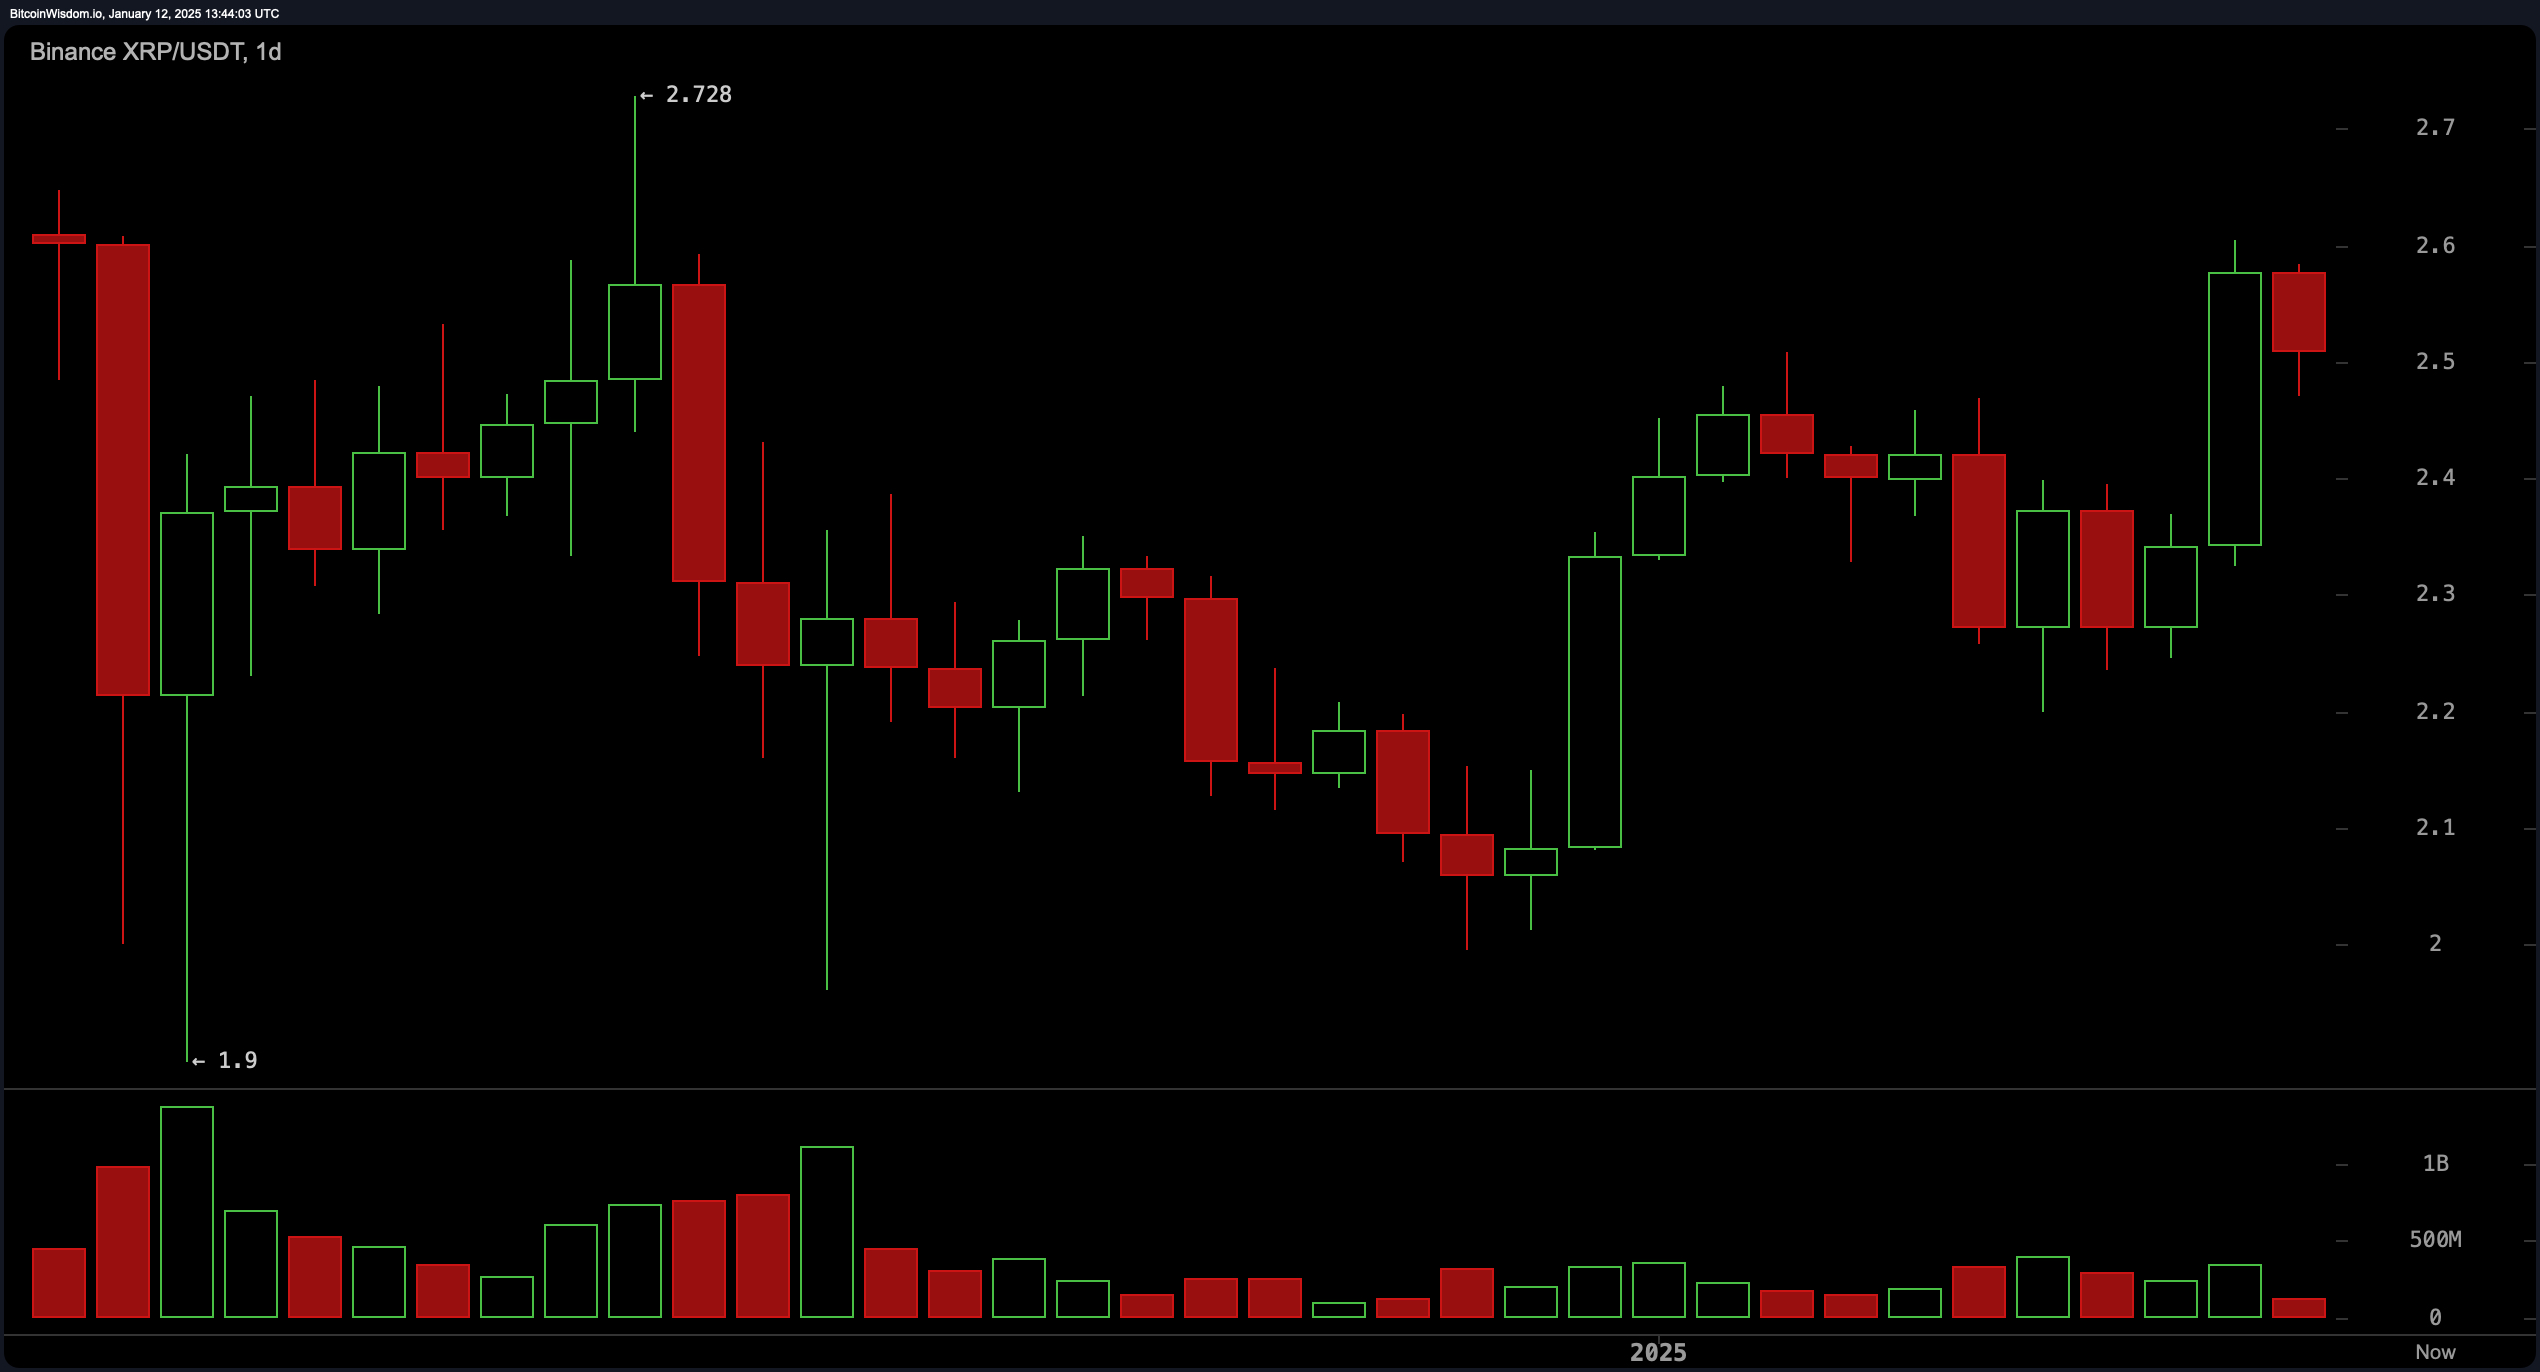
On the daily timeframe, XRP exhibits a broader recovery pattern, climbing from a recent low near $2.20 to an intraday high of $2.72 before slightly retracing. Notably, increased buying volume on bullish candles reflects renewed market interest. Resistance at $2.72 and support at $2.40 define key levels to watch for further price movement.

XRP/USDT 1D chart via Binance on Sunday, Jan. 12, 2025.
Technical oscillators reveal a nuanced outlook. The relative strength index (RSI) reads 58.99, signaling neutrality, while the Stochastic oscillator, at 82.71, leans toward overbought conditions. Meanwhile, the moving average convergence divergence (MACD) indicates a positive signal at 0.07805, counterbalanced by selling pressure suggested by the momentum oscillator at 0.10760 and the commodity channel index (CCI) at 137.10.
Across all timeframes, moving averages remain bullish. Both exponential and simple moving averages across 10, 20, 50, 100, and 200 periods align to reflect favorable buy conditions. This alignment signals that market sentiment for XRP remains optimistic, contingent on the asset surpassing critical resistance thresholds.
Bull Verdict:
XRP’s current technical setup paints a picture of optimism, with bullish signals from moving averages across all timeframes and buying interest reflected in recent volume patterns. A successful breakout above $2.6, accompanied by strong volume, could pave the way for further gains toward $2.7 and beyond. The broader recovery trend suggests that XRP is well-positioned for potential upside if resistance levels are decisively breached.
Bear Verdict:
Despite the upward momentum, XRP faces significant hurdles at resistance zones between $2.6 and $2.7, while oscillators signal caution with overbought conditions and selling pressure creeping in. A failure to hold support at $2.45 could lead to further downside, testing levels below $2.4. Traders should remain vigilant for signs of a deeper correction if buying momentum falters.
免责声明:本文章仅代表作者个人观点,不代表本平台的立场和观点。本文章仅供信息分享,不构成对任何人的任何投资建议。用户与作者之间的任何争议,与本平台无关。如网页中刊载的文章或图片涉及侵权,请提供相关的权利证明和身份证明发送邮件到support@aicoin.com,本平台相关工作人员将会进行核查。


