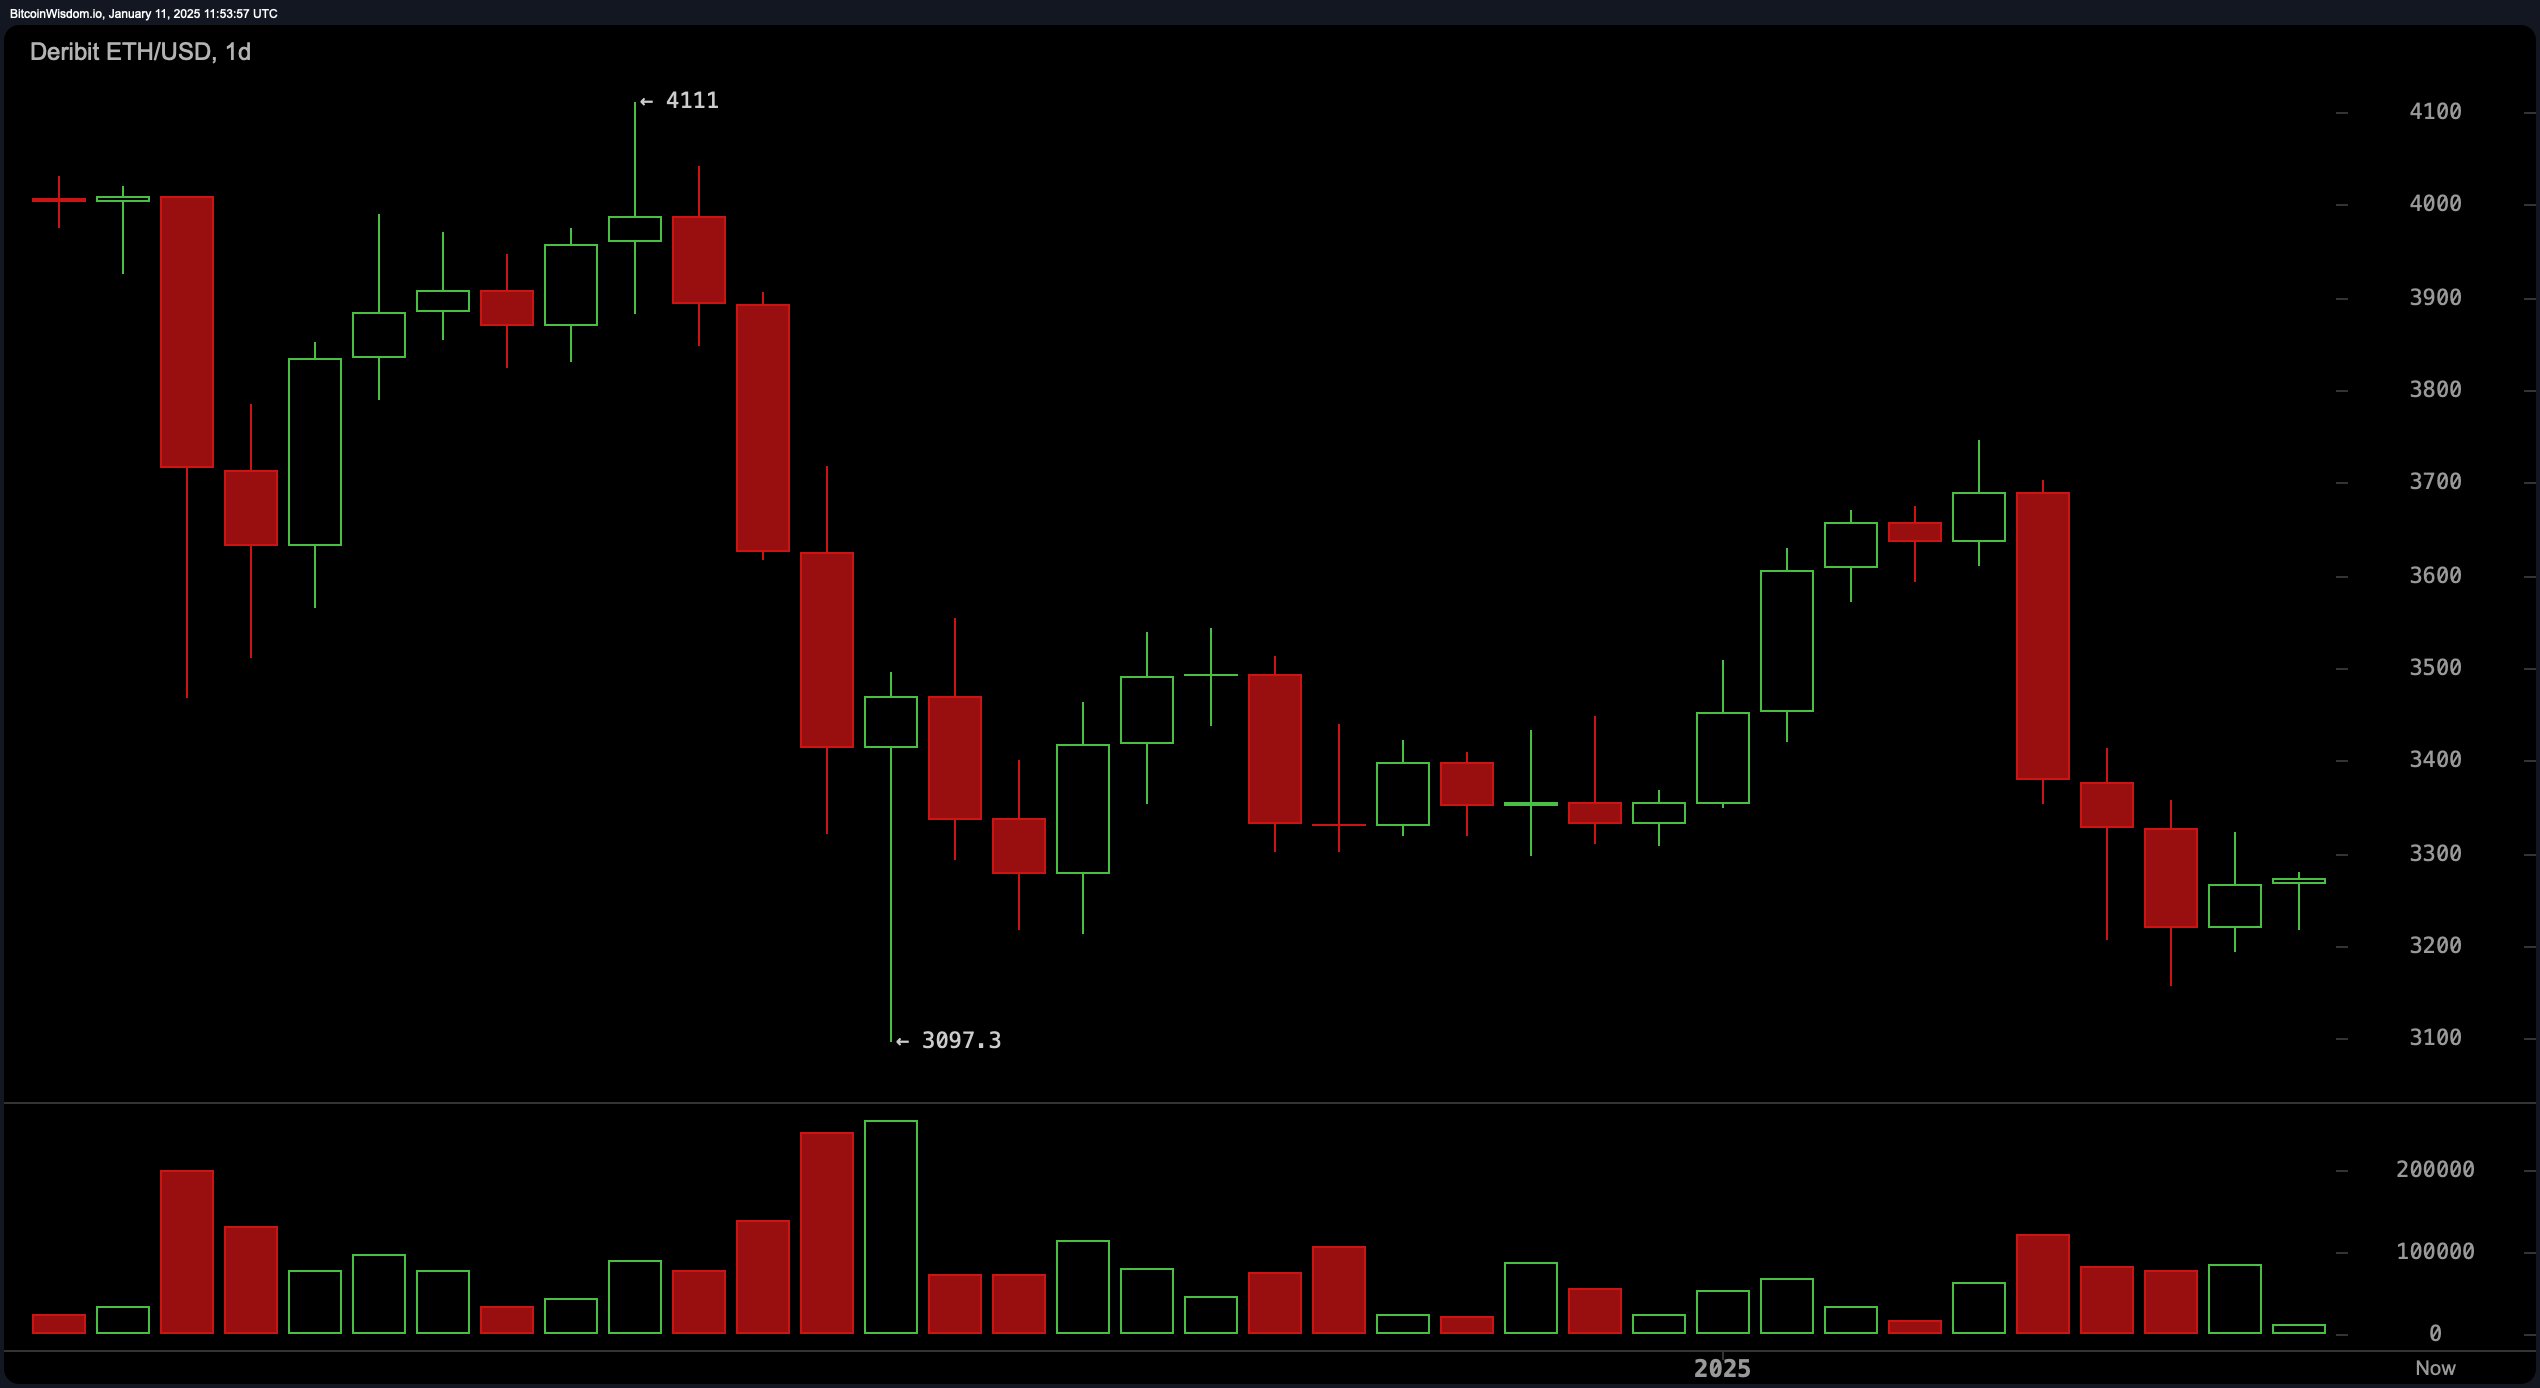
Ethereum’s daily chart highlights ethereum’s consolidation phase between $3,200 and $3,300, following a steep descent from $4,111 to $3,097. The presence of smaller candlesticks coupled with diminished volatility signals waning selling pressure. However, the absence of a definitive buying impulse leaves the market direction ambiguous. A breakout above $3,400 accompanied by strong volume could pave the way for bullish prospects, whereas a decline beneath $3,100 would reinforce bearish momentum.

ETH/USD 1D chart on Jan. 11, 2025.
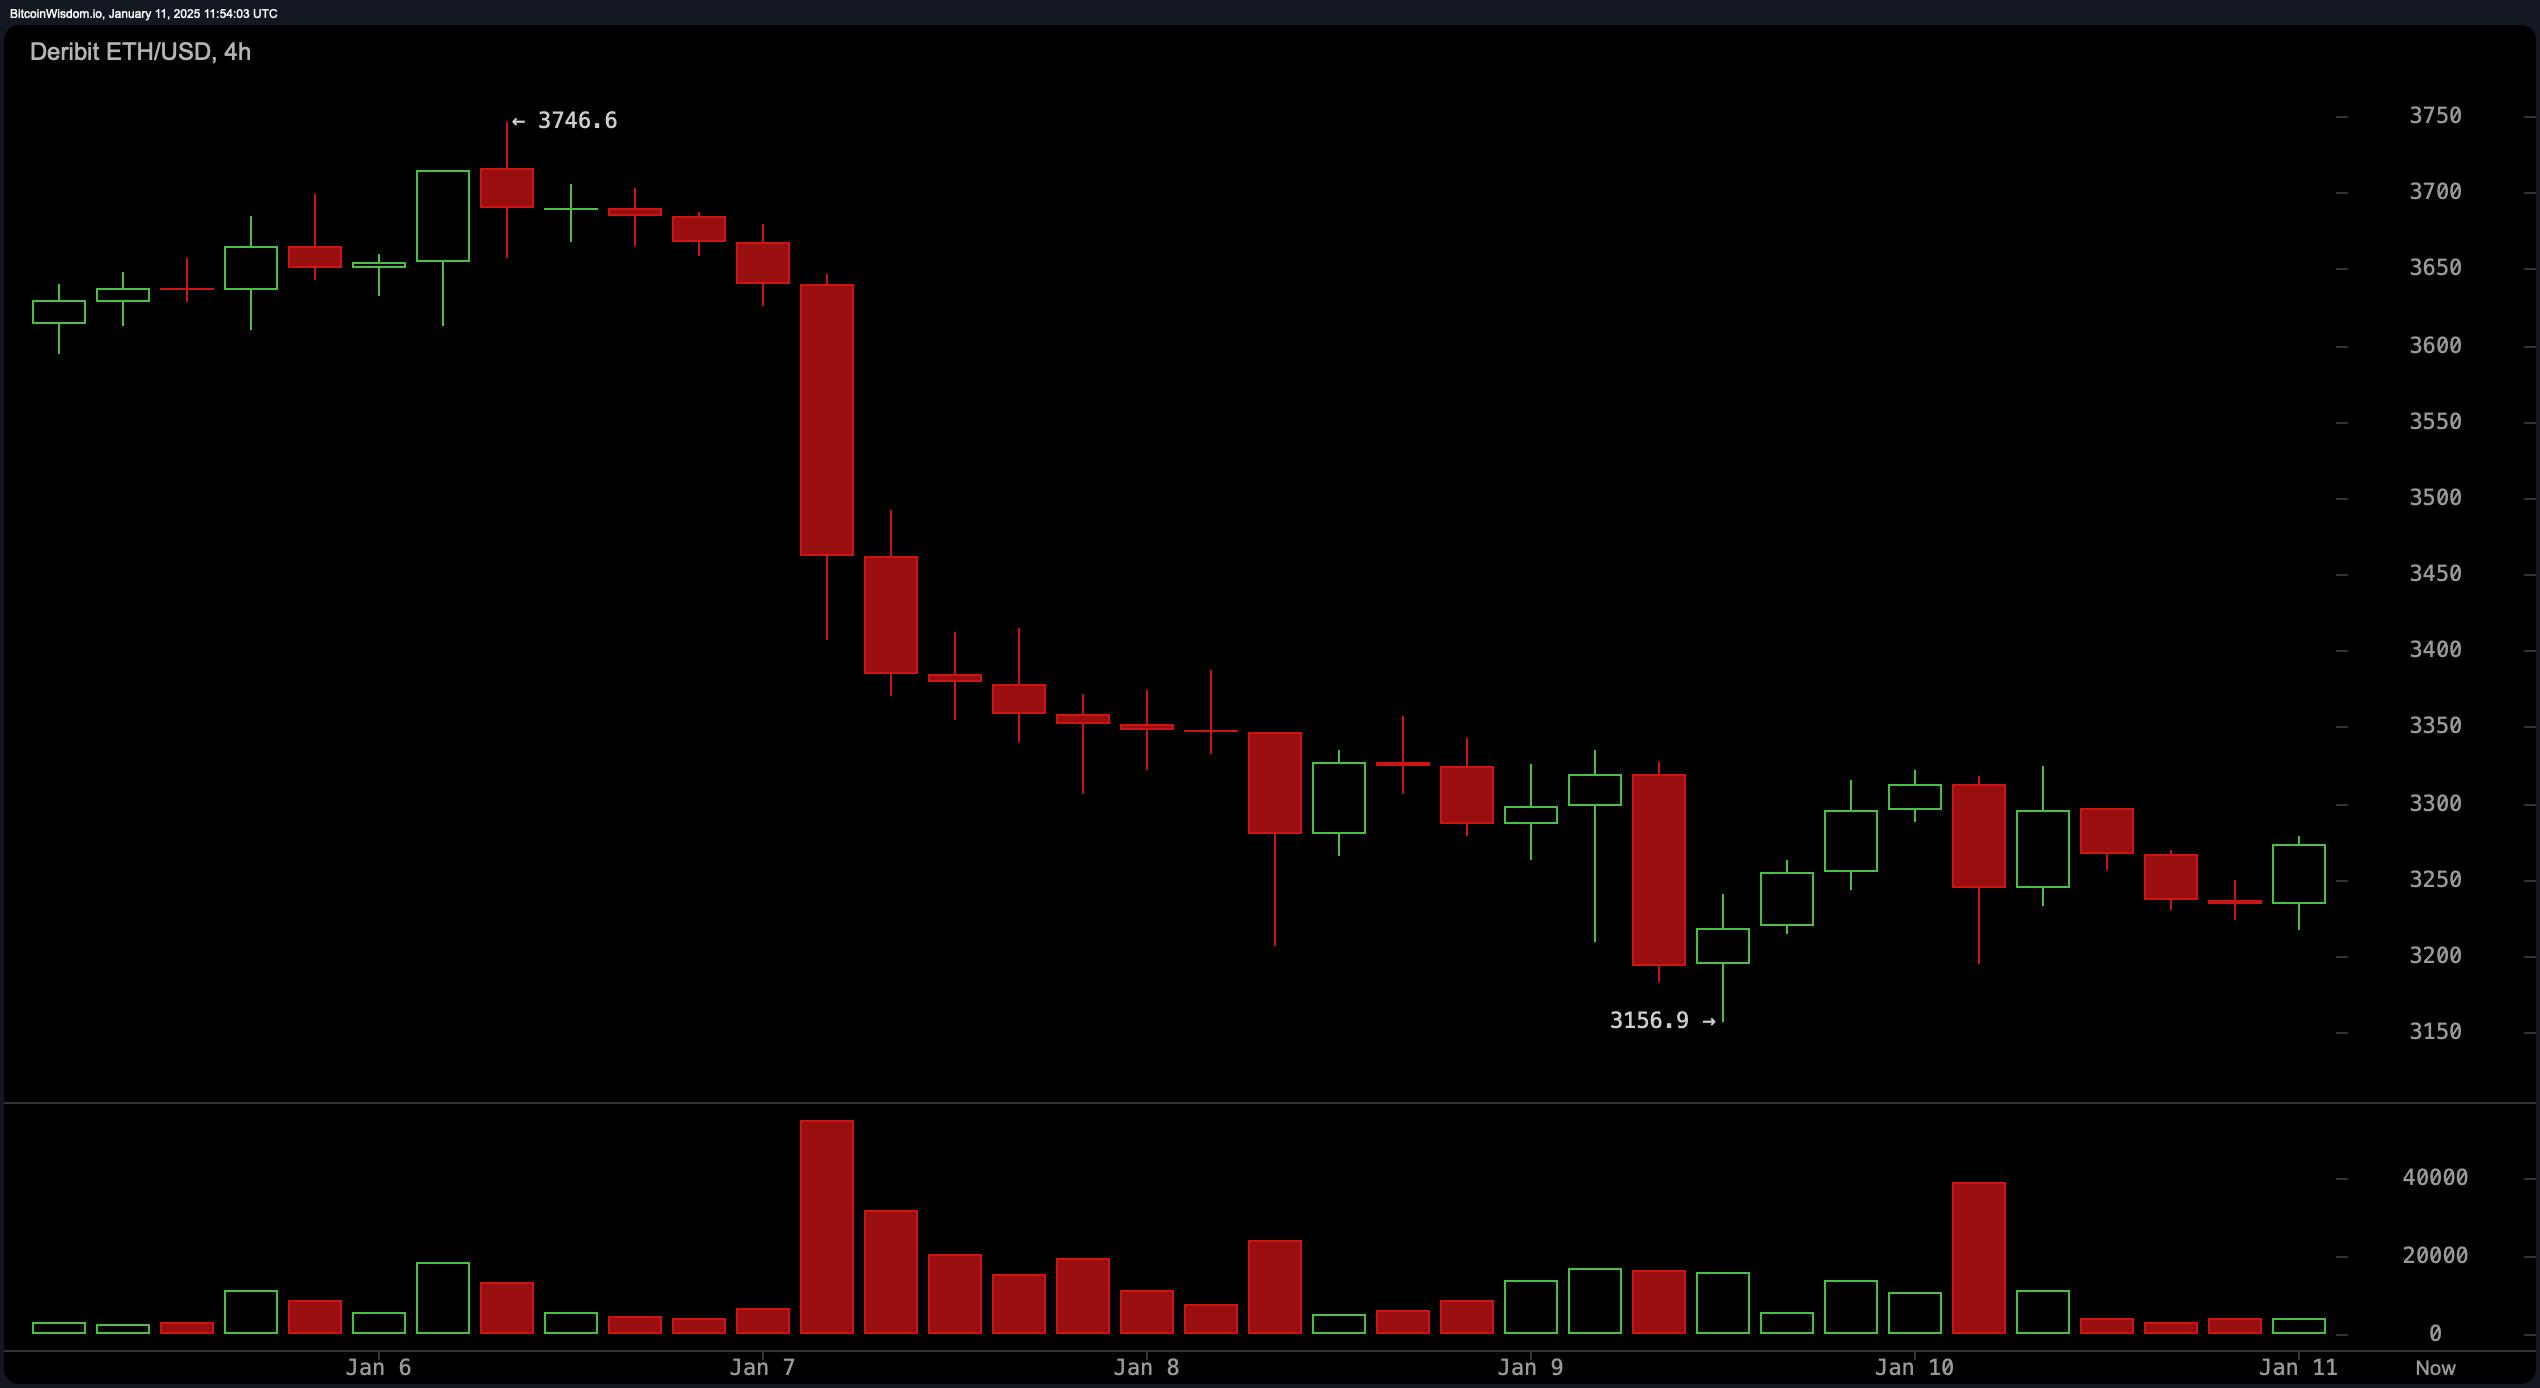
On the ETH/USD 4-hour chart, ethereum has shown minor attempts at recovery after its drop from $3,746 to $3,156. Price movements are largely confined, with alternating small green and red candles emphasizing market indecision. Resistance at $3,300 remains a pivotal barrier, while pronounced volume during earlier declines reflects persistent selling activity. A steady climb beyond $3,350 might signal upward momentum, but a fall below $3,150 could prompt a retest of the $3,000 level.

ETH/USD 4H chart on Jan. 11, 2025.
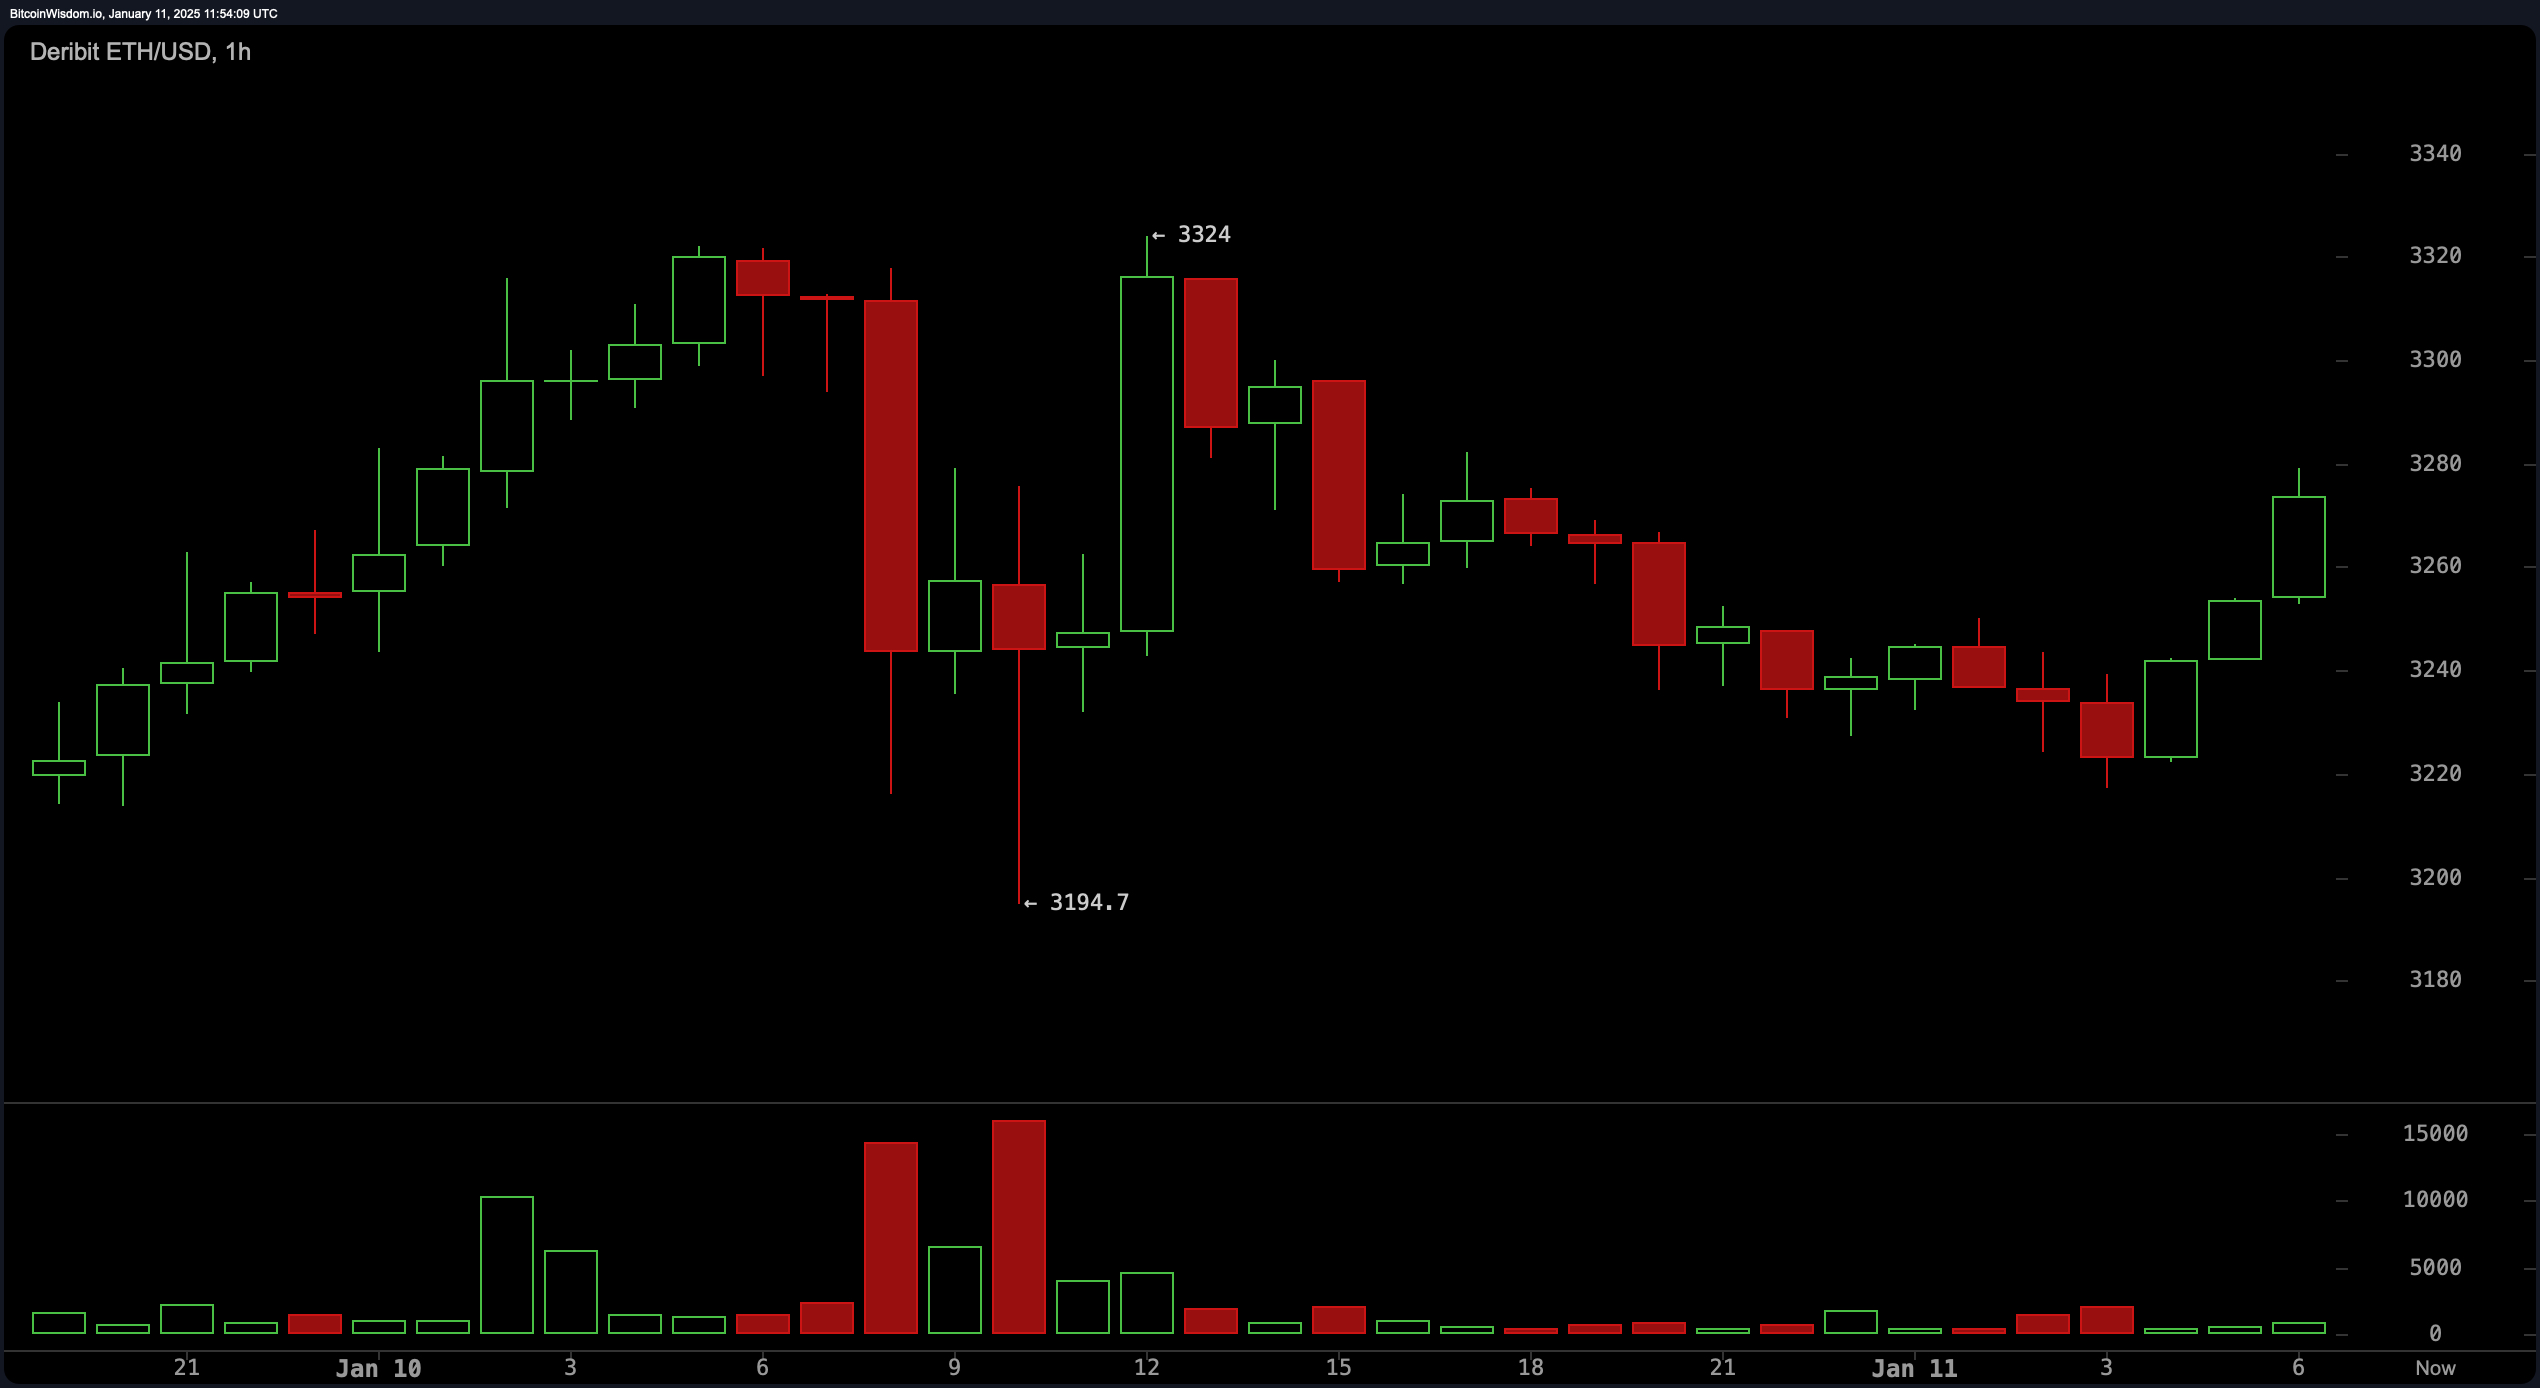
Ethereum’s hourly chart presents a similar narrative, where ethereum’s short-term recovery attempts are met with resistance near $3,300. Price consolidation around $3,250 suggests potential accumulation, though a lack of definitive buying signals persists. The tapering volume implies temporary exhaustion among sellers, positioning $3,300 as a critical threshold for determining the next price movement.

ETH/USD 1H chart on Jan. 11, 2025.
Technical oscillators, including the relative strength index (RSI), Stochastic oscillator, commodity channel index (CCI), and awesome oscillator, exhibit neutral readings, underscoring the lack of clear momentum. Meanwhile, indicators like the momentum oscillator and moving average convergence divergence (MACD) lean bearish, signaling selling activity.
Moving averages—both exponential (EMA) and simple (SMA)—align with a bearish trend over shorter timeframes. The 10-day and 20-day averages favor selling, while longer-term averages, such as the 100-day and 200-day SMAs, identify support zones near $3,265 and $3,109, respectively.
Bull Verdict:
If ethereum manages to surpass the critical $3,400 resistance with sustained volume, it could mark the beginning of a bullish phase, opening the door for higher highs and renewed investor confidence. Momentum would likely gain traction as buyers reclaim control, setting the stage for a potential rally.
Bear Verdict:
A decisive drop below $3,100, accompanied by increased selling pressure, would confirm further bearish momentum. This scenario could lead to ethereum retesting key support levels near $3,000 or lower, exacerbating pessimism and pushing prices into a deeper downtrend.
免责声明:本文章仅代表作者个人观点,不代表本平台的立场和观点。本文章仅供信息分享,不构成对任何人的任何投资建议。用户与作者之间的任何争议,与本平台无关。如网页中刊载的文章或图片涉及侵权,请提供相关的权利证明和身份证明发送邮件到support@aicoin.com,本平台相关工作人员将会进行核查。


