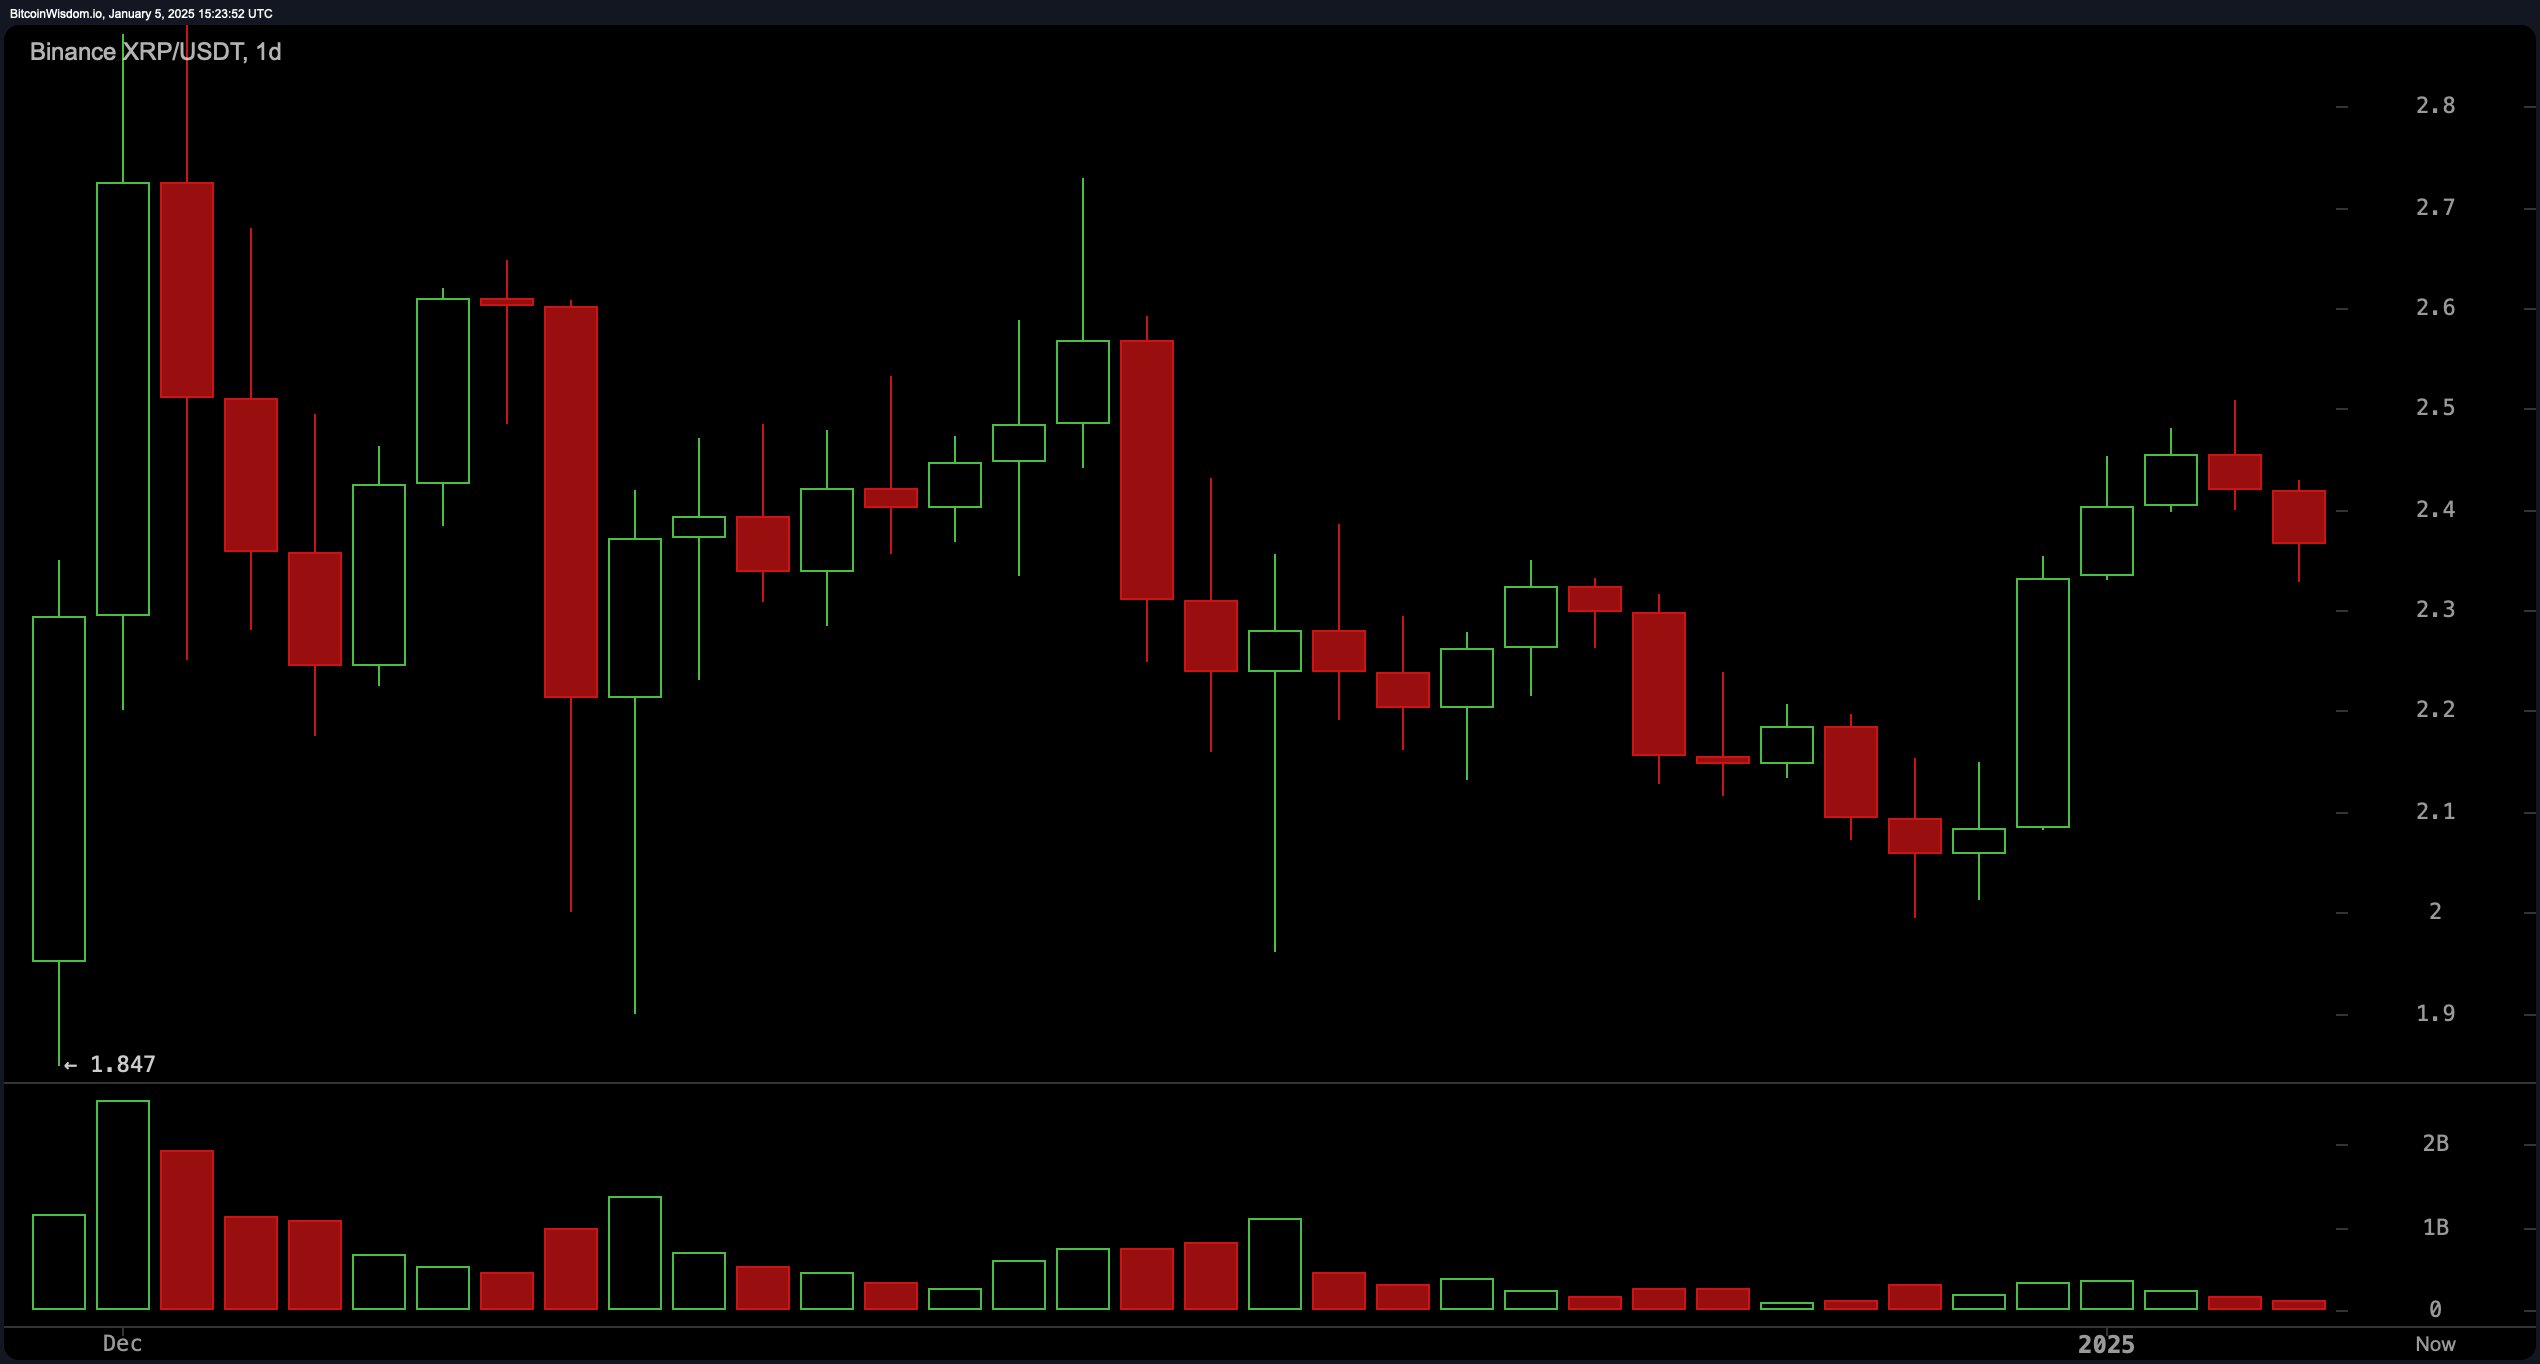
XRP’s daily chart reveals a period of stabilization after a recent upward trend that lifted the price from $2.00 to $2.50. Key support levels are noted at $2.20 and $2.00, while resistance persists at $2.50 and $2.65. Indicators like the moving average convergence divergence (MACD) and momentum (10) hint at sustained optimism, bolstered by encouraging buy signals from both exponential moving averages (EMAs) and simple moving averages (SMAs) across various timeframes.

XRP Daily chart.
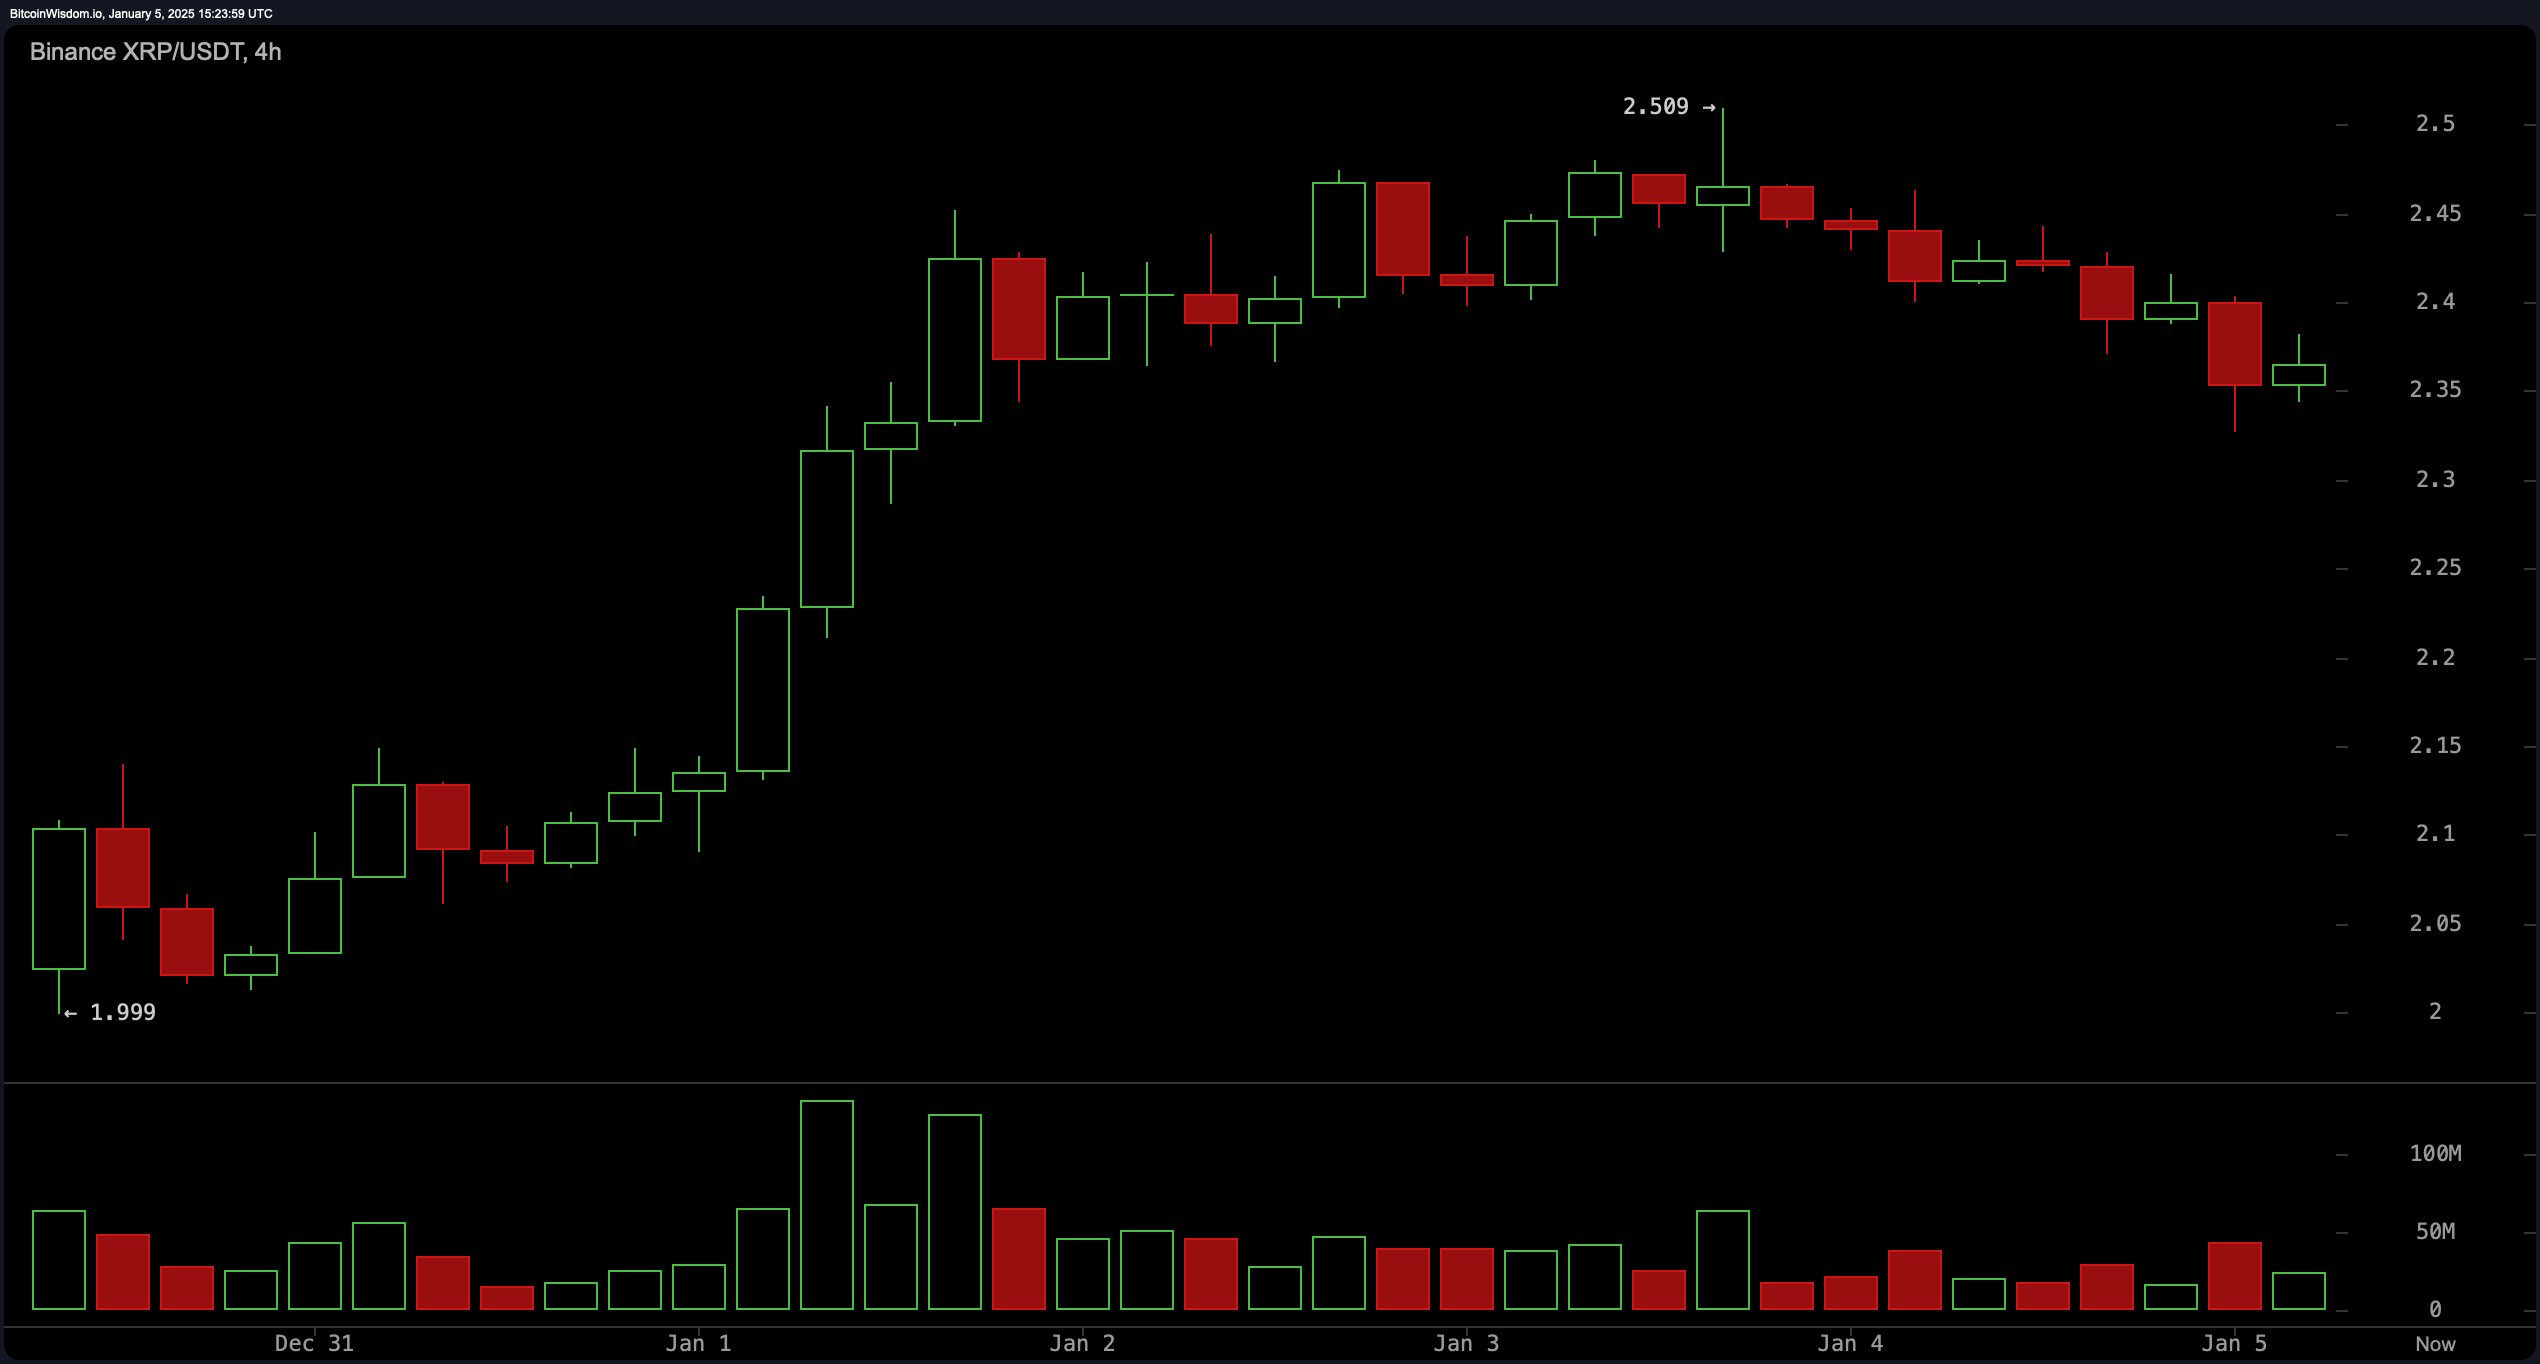
On XRP’s 4-hour chart, a lateral movement has set in post the recent peak of $2.50, with diminishing highs suggesting a possible retreat. Volume analysis shows a decline in activity at specific resistance points, signaling buyer fatigue. Support is confirmed at $2.35 and $2.20, providing potential for short-term long positions if the $2.35 support holds firm. While the Stochastic oscillator leans bearish, other tools like the awesome oscillator and MACD persist in offering buy signals.

XRP 4H chart.
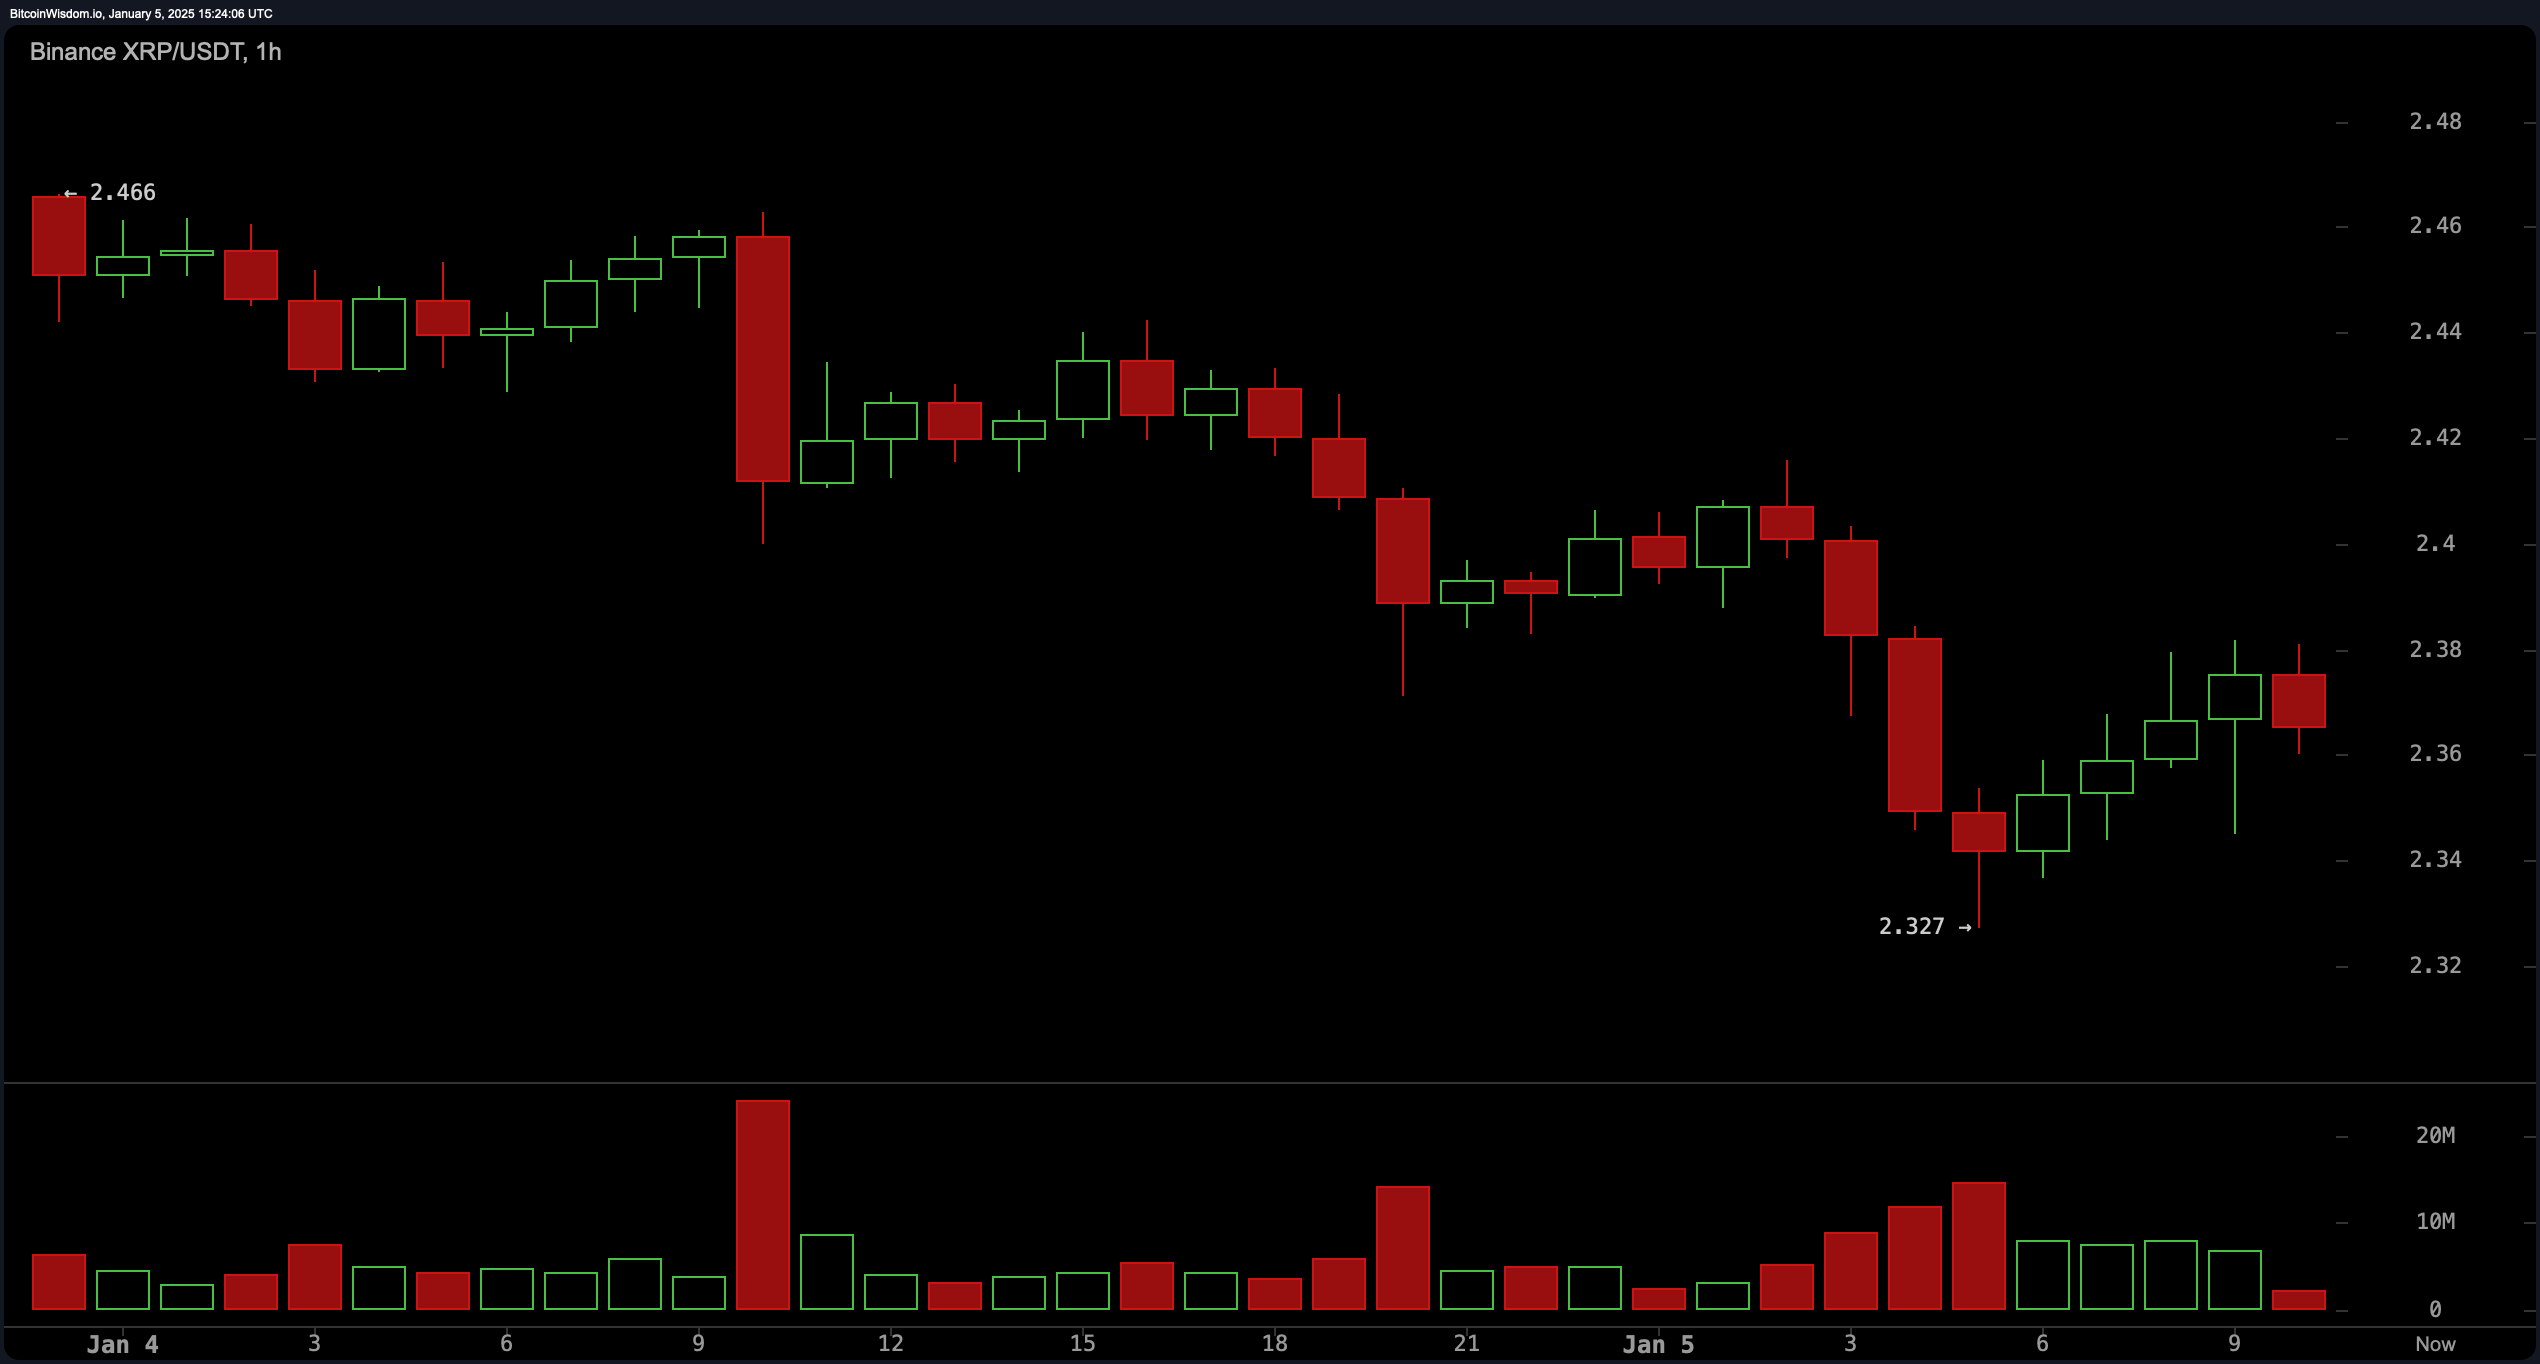
XRP’s hourly chart exhibits increased volatility, marked by a sharp fall from $2.50 to $2.35, followed by efforts to rebound. Resistance at $2.42 and $2.50 is pivotal, with the $2.35 level serving as a linchpin for short-term trading strategies. It’s prudent for traders to set stop-loss orders below $2.30 to manage risk exposure. Oscillators such as the relative strength index (RSI) (14) are neutral, while other momentum indicators display a mixed bag of sentiments.

XRP 1H chart.
XRP’s long-term moving averages, like the 100-period and 200-period EMAs and SMAs, continue to emit strong buy signals, reflecting a clear upward trajectory. The Ichimoku baseline indicates a market balance around the current price, instilling confidence in price stability near $2.35. However, the hull moving average (HMA) suggests selling pressure, calling for a measured approach.
Bull Verdict:
XRP’s overall trend remains bullish, supported by strong buy signals across long-term moving averages and momentum indicators. If the $2.35 support holds and the price breaks above the $2.50 resistance, the stage could be set for a rally toward $2.65 in the coming sessions.
Bear Verdict:
Despite longer-term bullish trends, short-term indicators show signs of exhaustion and selling pressure. A breakdown below $2.35 support could trigger a deeper pullback toward $2.20 or lower, driven by bearish signals from oscillators like the stochastic and hull moving average.
免责声明:本文章仅代表作者个人观点,不代表本平台的立场和观点。本文章仅供信息分享,不构成对任何人的任何投资建议。用户与作者之间的任何争议,与本平台无关。如网页中刊载的文章或图片涉及侵权,请提供相关的权利证明和身份证明发送邮件到support@aicoin.com,本平台相关工作人员将会进行核查。


