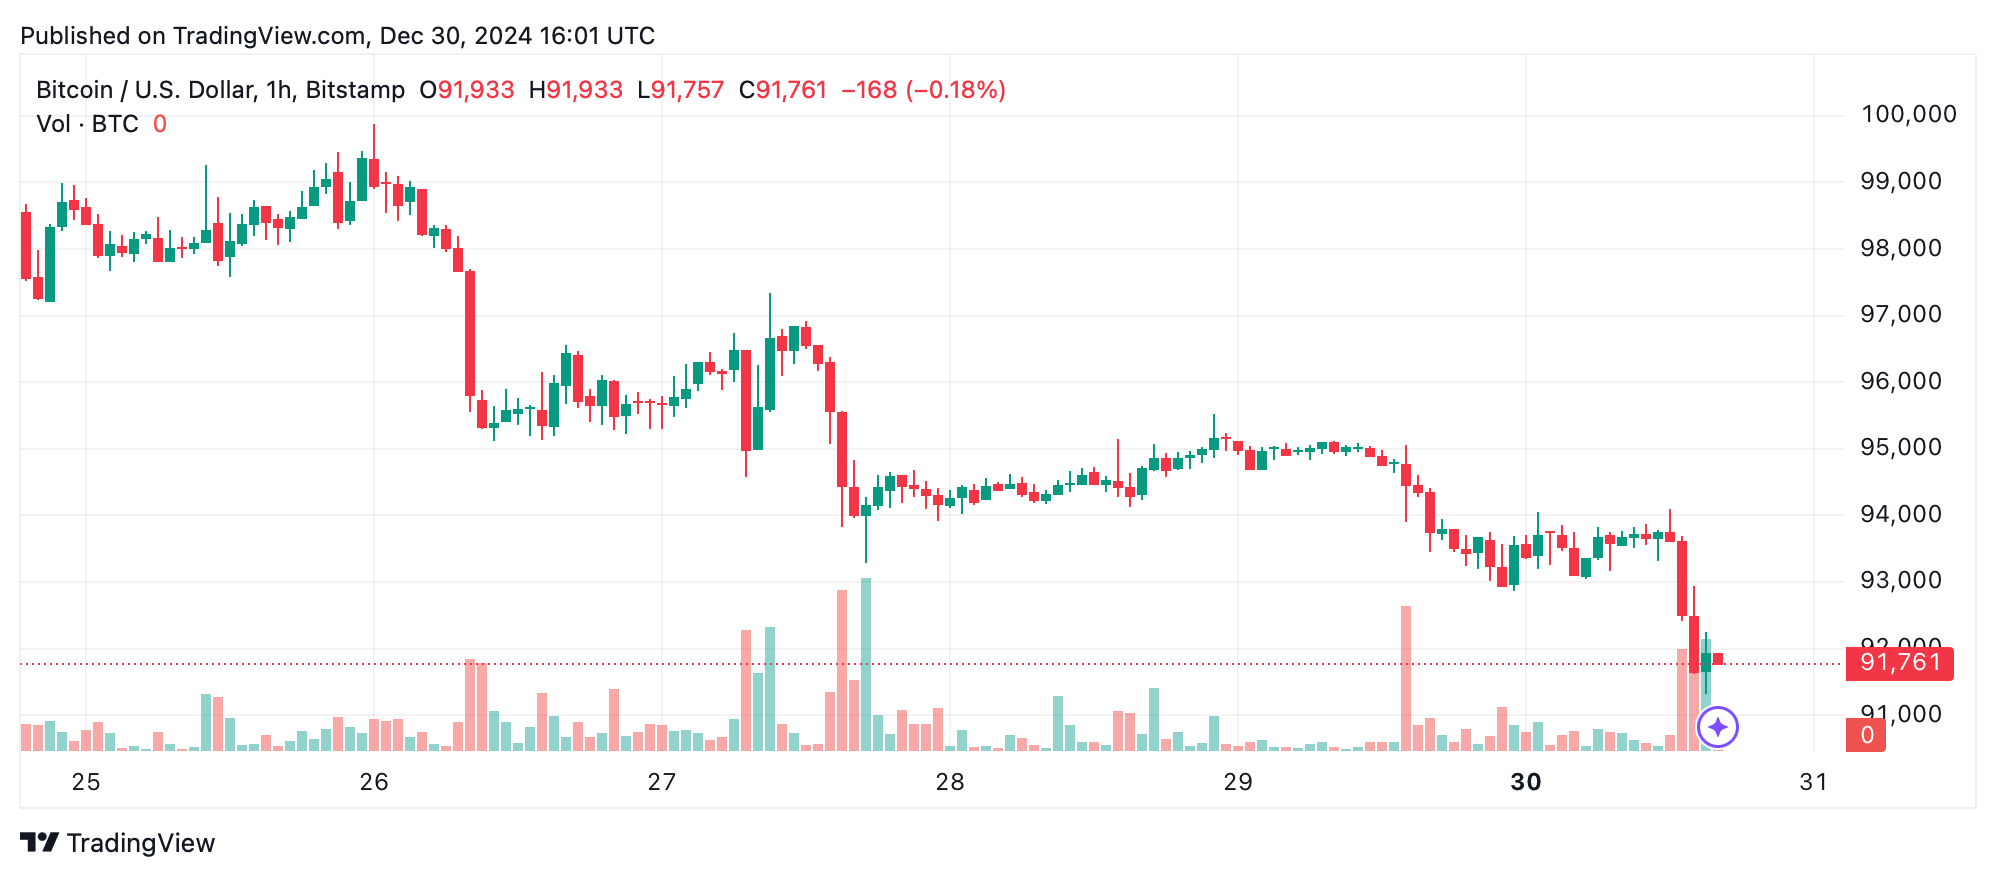
Bitcoin‘s 1-hour chart tells a tale of modest recovery from earlier dips, but bitcoin seems to lack the gusto to punch through the resistance hovering around $93,000. Indicators like the relative strength index (RSI) at 40 and the Stochastic at 10 are playing it cool, suggesting a market that can’t make up its mind. However, the MACD (moving average convergence divergence) at -613 clearly shows that sellers are still calling the shots.

BTC/USD 1H chart on Dec. 30, 2024.
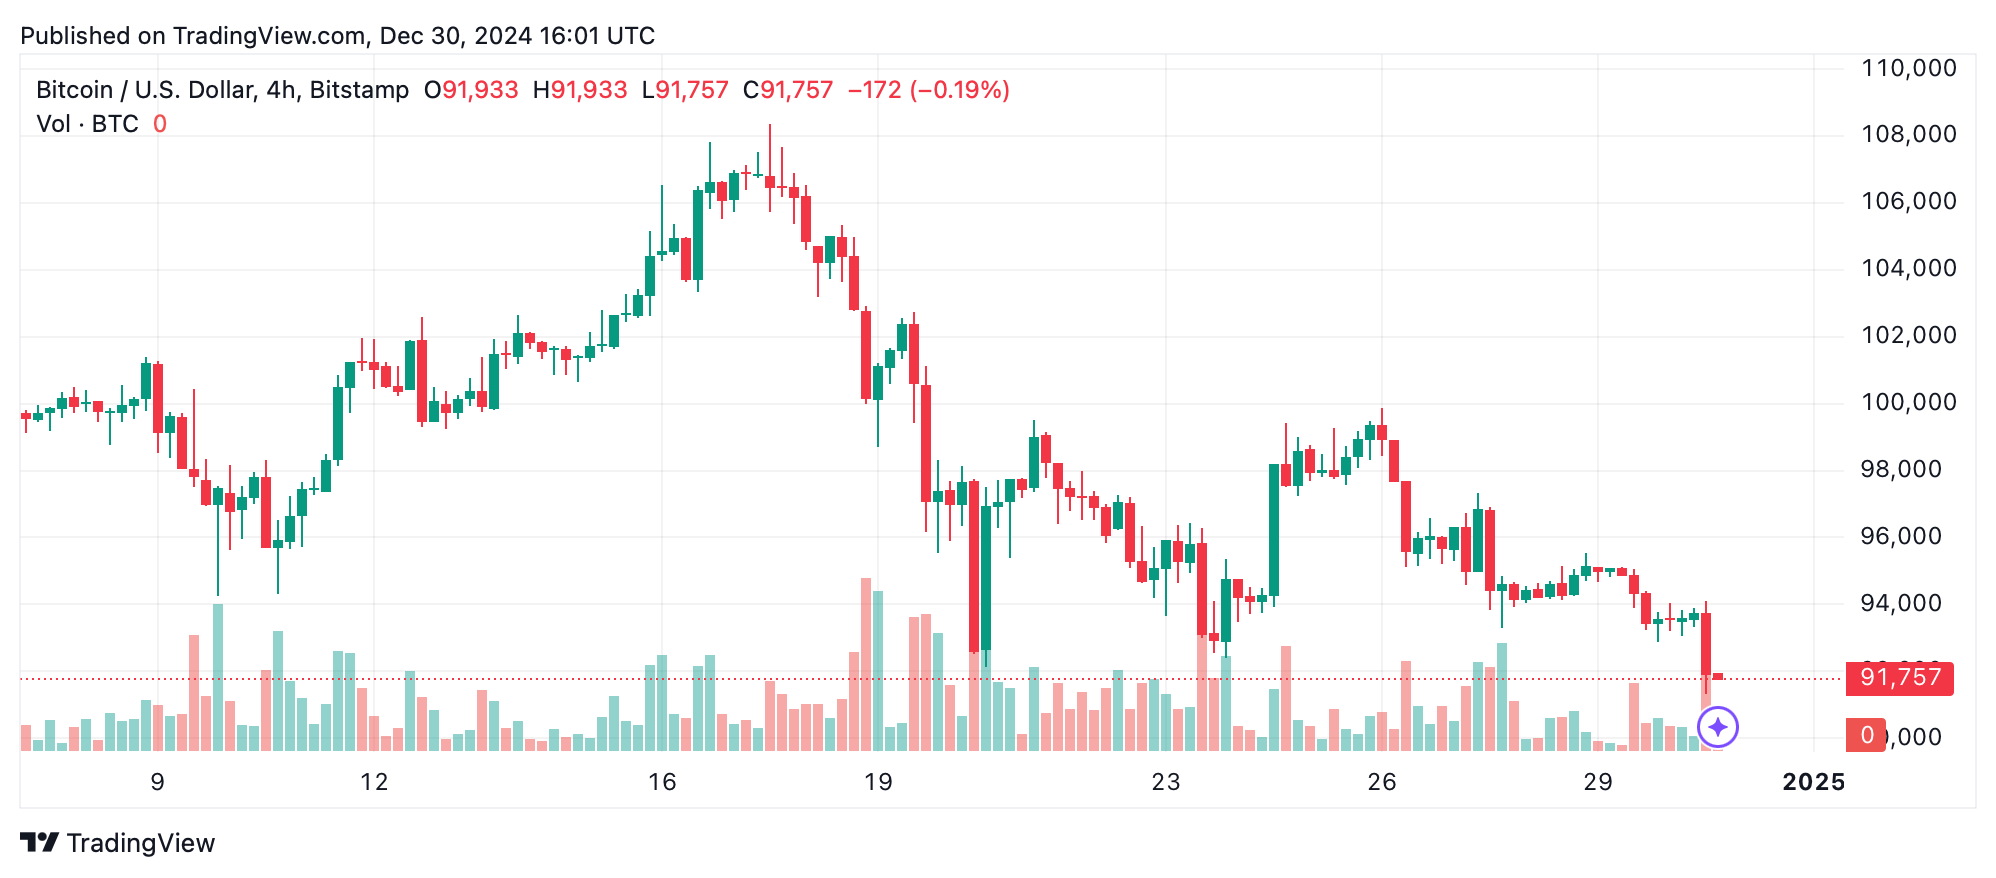
Zoom out to the 4-hour chart, and the downward trend becomes more dramatic, highlighted by bearish signals like the commodity channel index (CCI) at -127 and momentum at -5,766. The price nears a significant resistance at $94,000, with both the exponential moving averages (EMA) and simple moving averages (SMA) for shorter periods, including EMA (10) at $95,516 and SMA (10) at $95,557, indicating that selling pressure isn’t letting up.

BTC/USD 4H chart on Dec. 30, 2024.
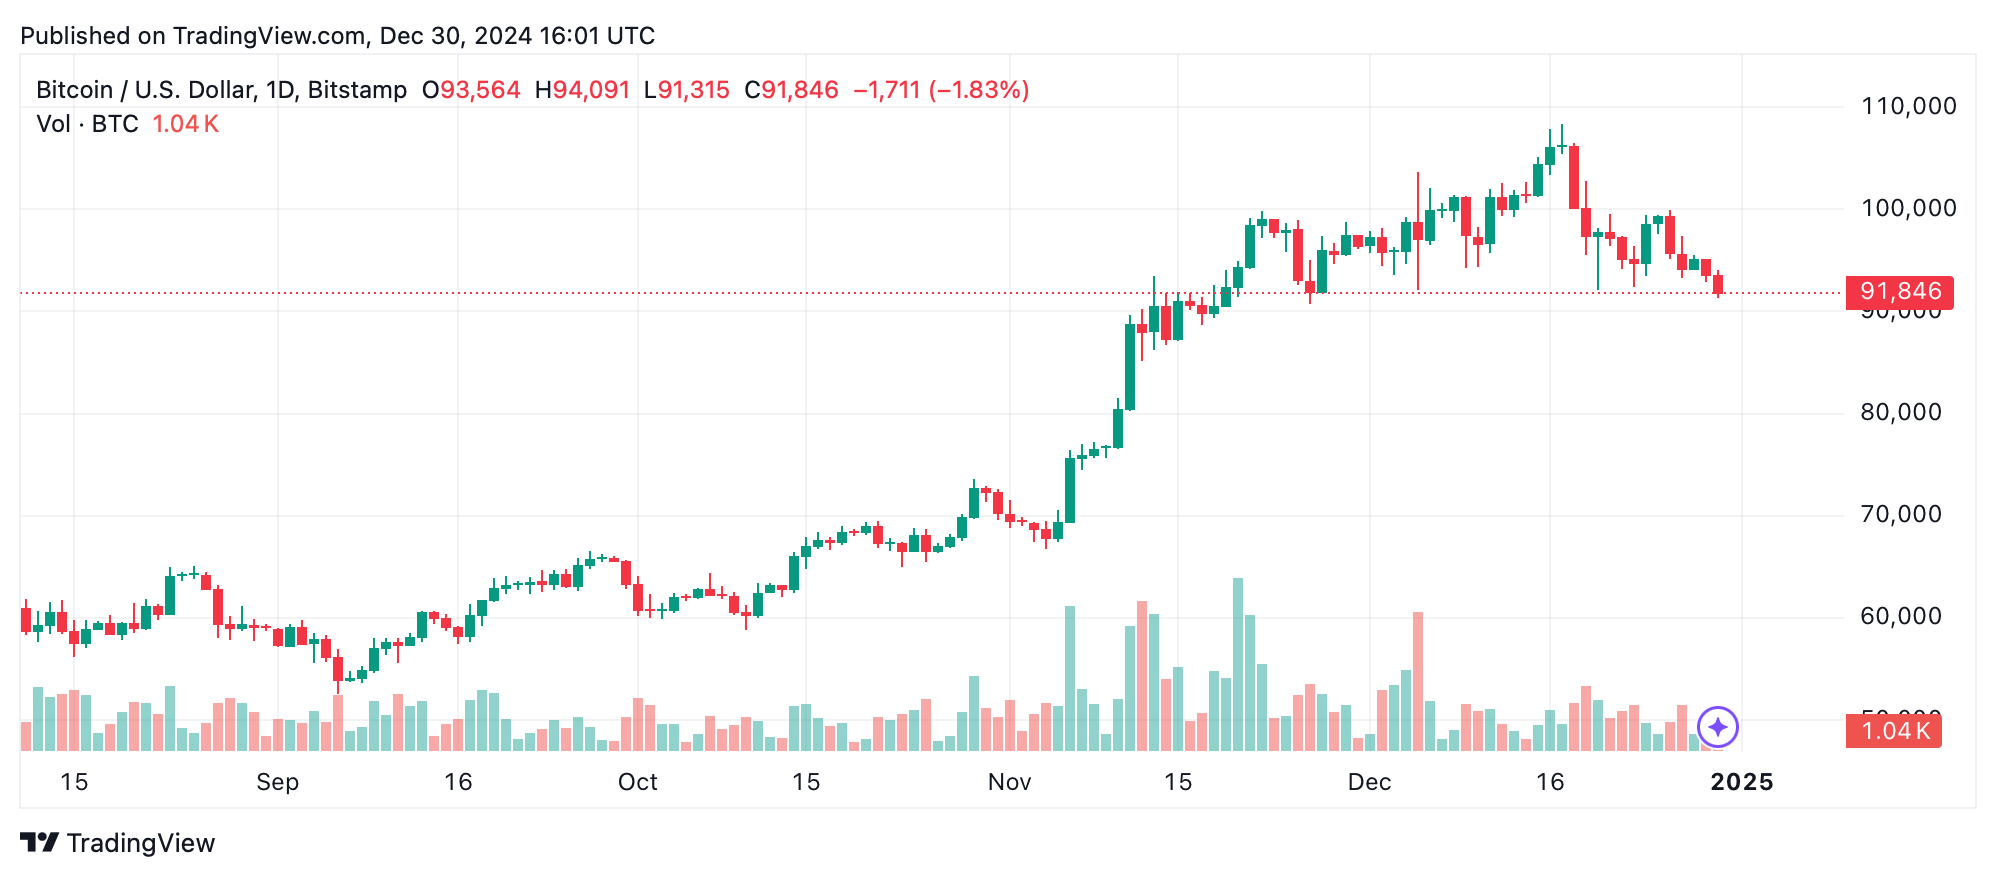
On the daily chart, the overarching bearish trend is clear, with a drop from recent peaks near $108,000 intensifying the downward push. Long-term indicators like EMA (100) at $85,297 and SMA (100) at $81,620 suggest there might be some buying support on the horizon. Yet, with the awesome oscillator at -3,168 and the average directional index (ADX) at 26, bullish power is clearly on a break.

BTC/USD Daily chart on Dec. 30, 2024.
Support is currently holding firm at $91,000-$92,000, but if that gives way, we might see a dive towards $88,000. Resistance at $94,000-$95,000 stands as a formidable wall for any hopeful bullish turnaround. The absence of a notable surge in volume or encouraging patterns like a double bottom hints at more potential drops.
Bull Verdict:
A sustained reclaim of $94,000 with strong volume and a bullish pattern, such as a double bottom or bullish engulfing candlestick, could signal a potential reversal. Long-term indicators like the exponential moving average (200) at $75,987 and the simple moving average (200) at $71,384 show that deeper support levels could provide a solid foundation for a recovery.
Bear Verdict:
The prevailing bearish momentum, as confirmed by the MACD at -613 and momentum at -5,766, alongside selling pressure from shorter-term moving averages, suggests that a failure to hold the $91,000-$92,000 support range may lead to a decline toward $88,000 or lower. Without a clear reversal signal, the bearish trend remains dominant.
免责声明:本文章仅代表作者个人观点,不代表本平台的立场和观点。本文章仅供信息分享,不构成对任何人的任何投资建议。用户与作者之间的任何争议,与本平台无关。如网页中刊载的文章或图片涉及侵权,请提供相关的权利证明和身份证明发送邮件到support@aicoin.com,本平台相关工作人员将会进行核查。


