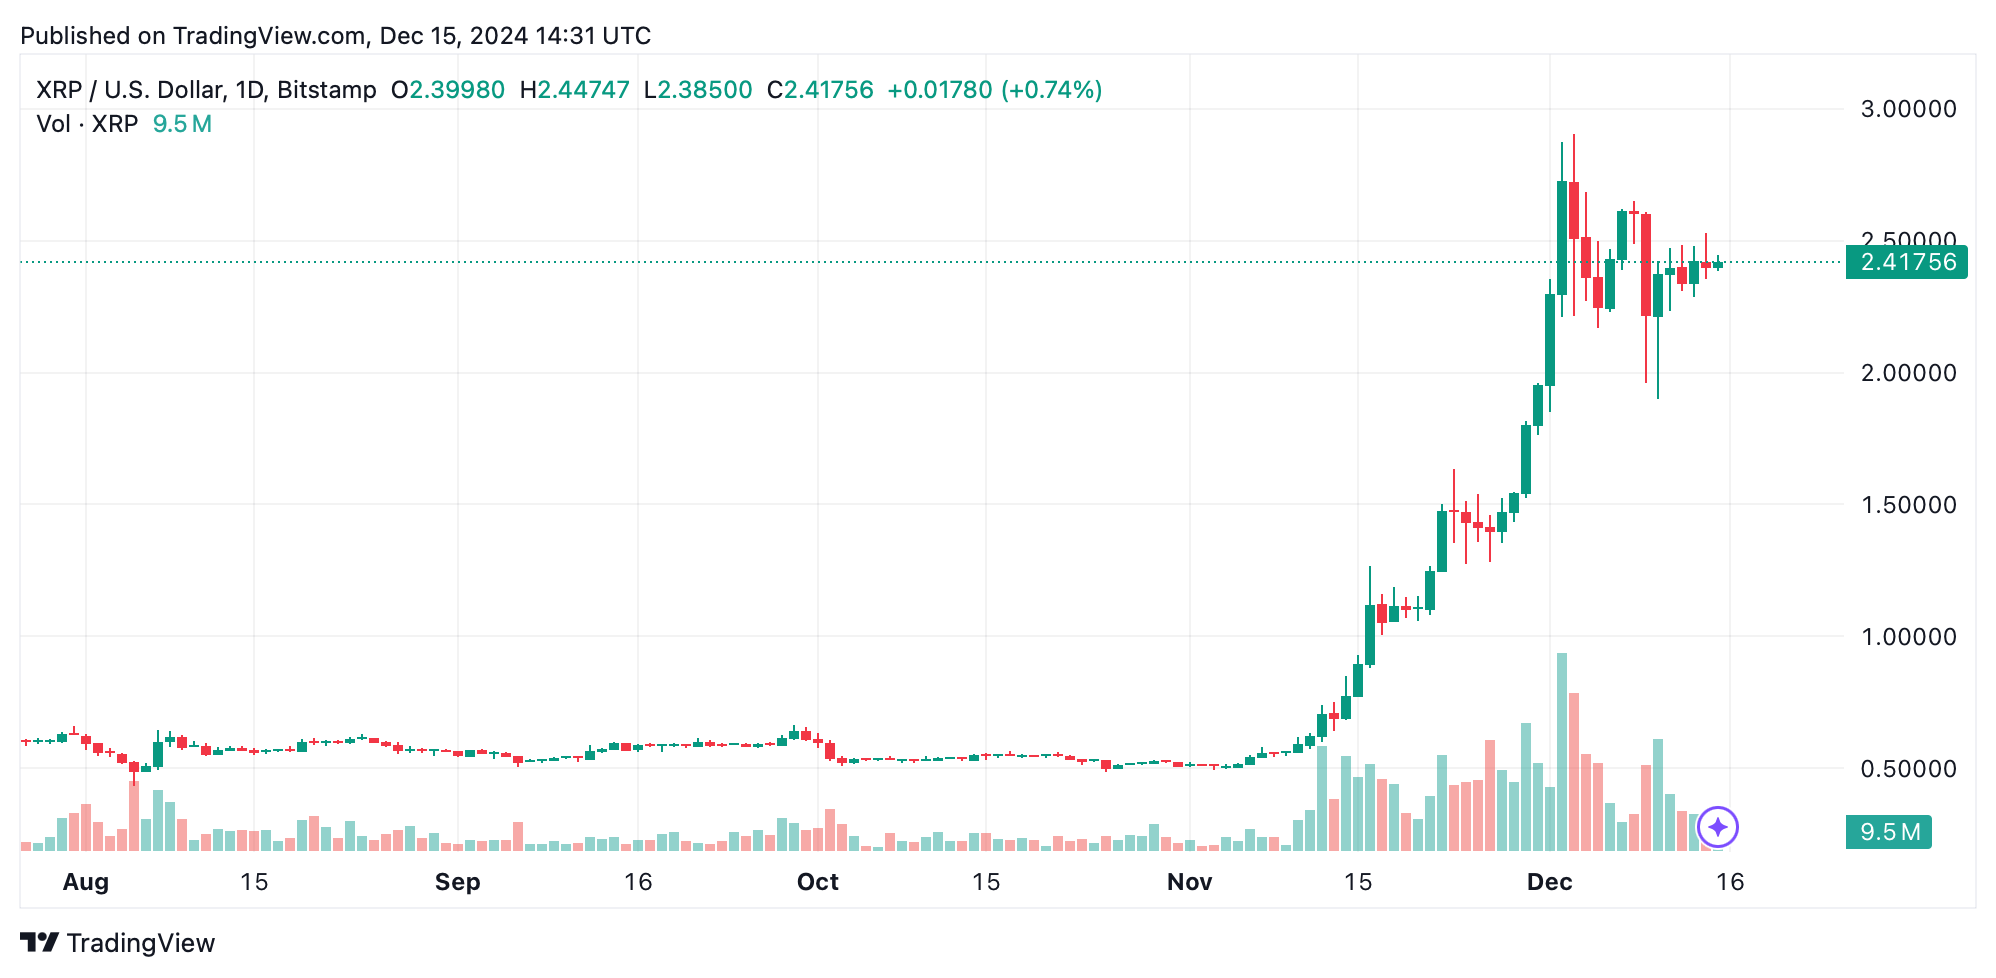
XRP’s daily chart shows a thrilling ascent from $0.57 to $2.90, followed by a cool-down and settling near $2.40. This spot has become a crucial support after a refreshing correction. The relative strength index (RSI) at 64.10 strikes a neutral chord, while the average directional index (ADX) at 54.68 shouts strong trend strength but whispers about its direction. With trading volumes taking a nap, it suggests a lull in the bullish charge. A leap over $2.90 could reignite the upward march, but dipping below $2.20 might invite more bearish pressure.

XRP Daily chart on Dec. 15.
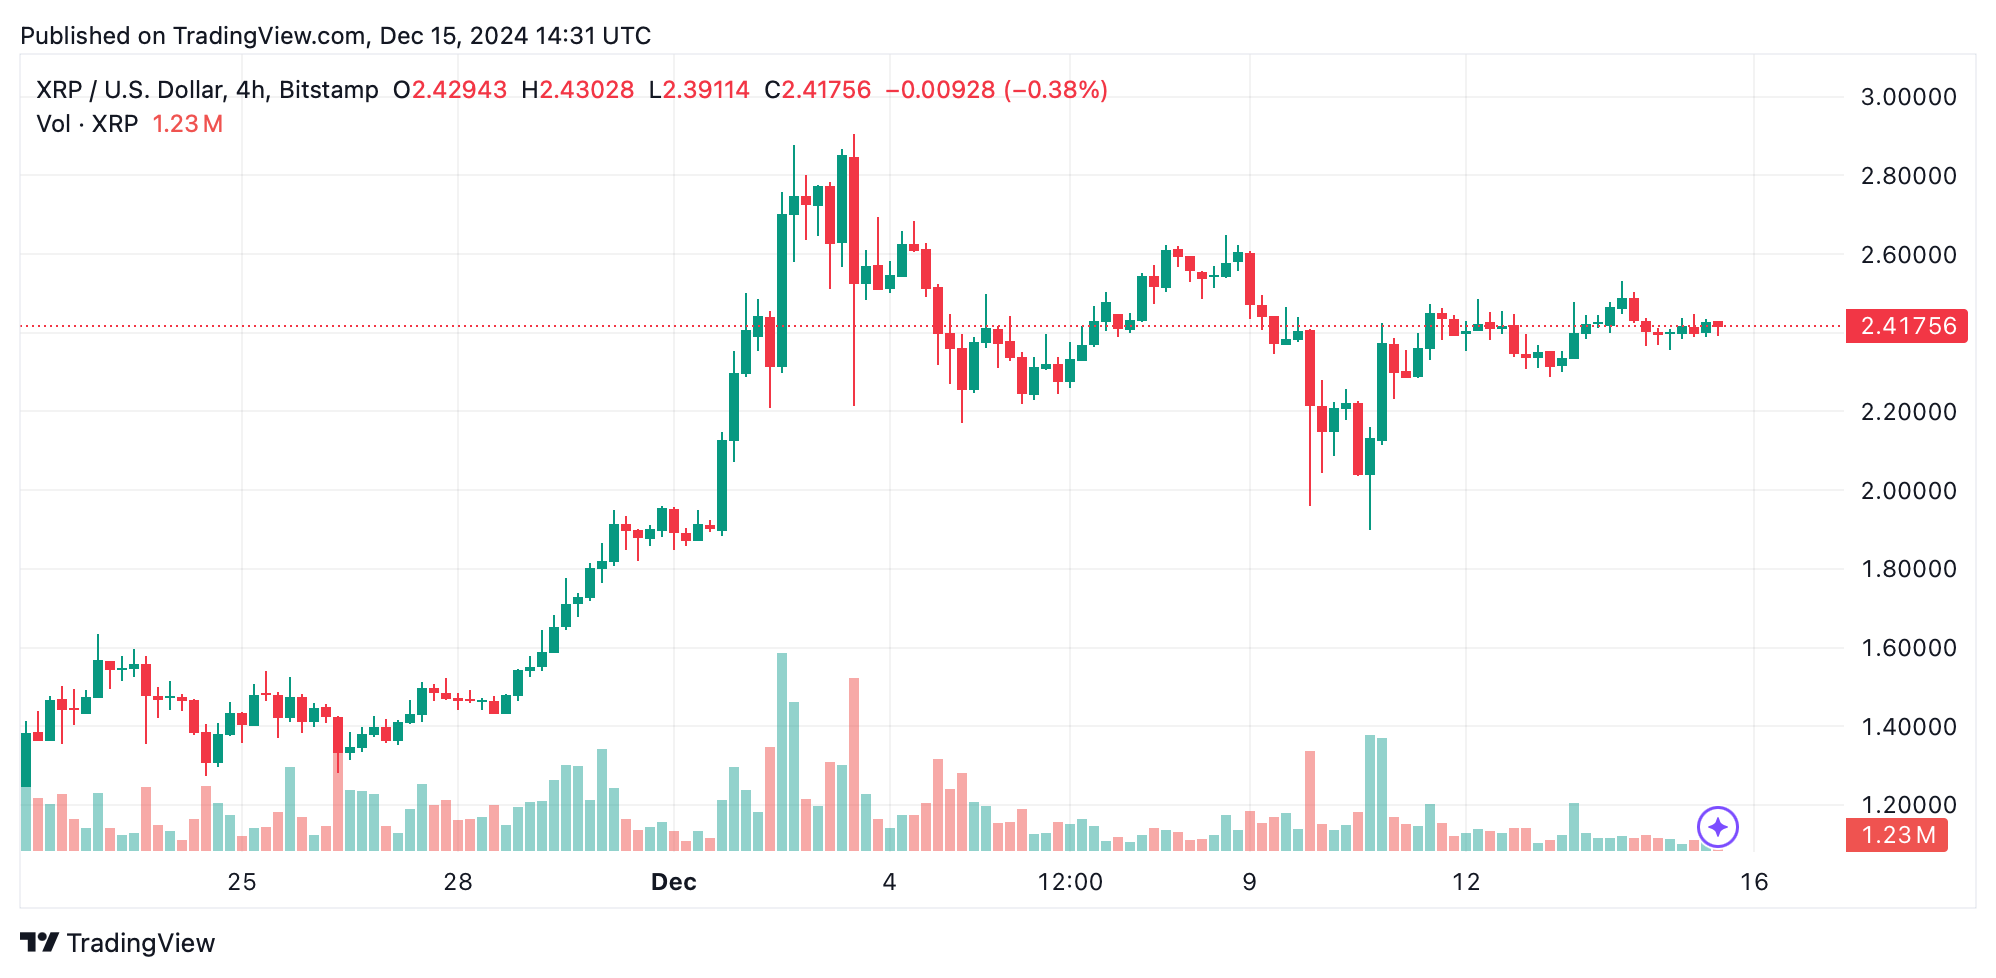
Diving into the 4-hour timeframe, XRP is stuck in a side-to-side shuffle between support at $2.40 and resistance at $2.53. The lower highs hint at sellers having the upper hand, yet buyers are staunchly defending $2.40.

XRP 4H chart on Dec. 15.
Oscillators like the Stochastic and commodity channel index (CCI) are sitting on the fence, showing the market’s uncertainty. The moving averages, with the 20-period exponential moving average (EMA) at $2.16 and the 20-period simple moving average (SMA) at $2.23, are nodding towards a bullish setup but are crying out for more vigor to confirm.

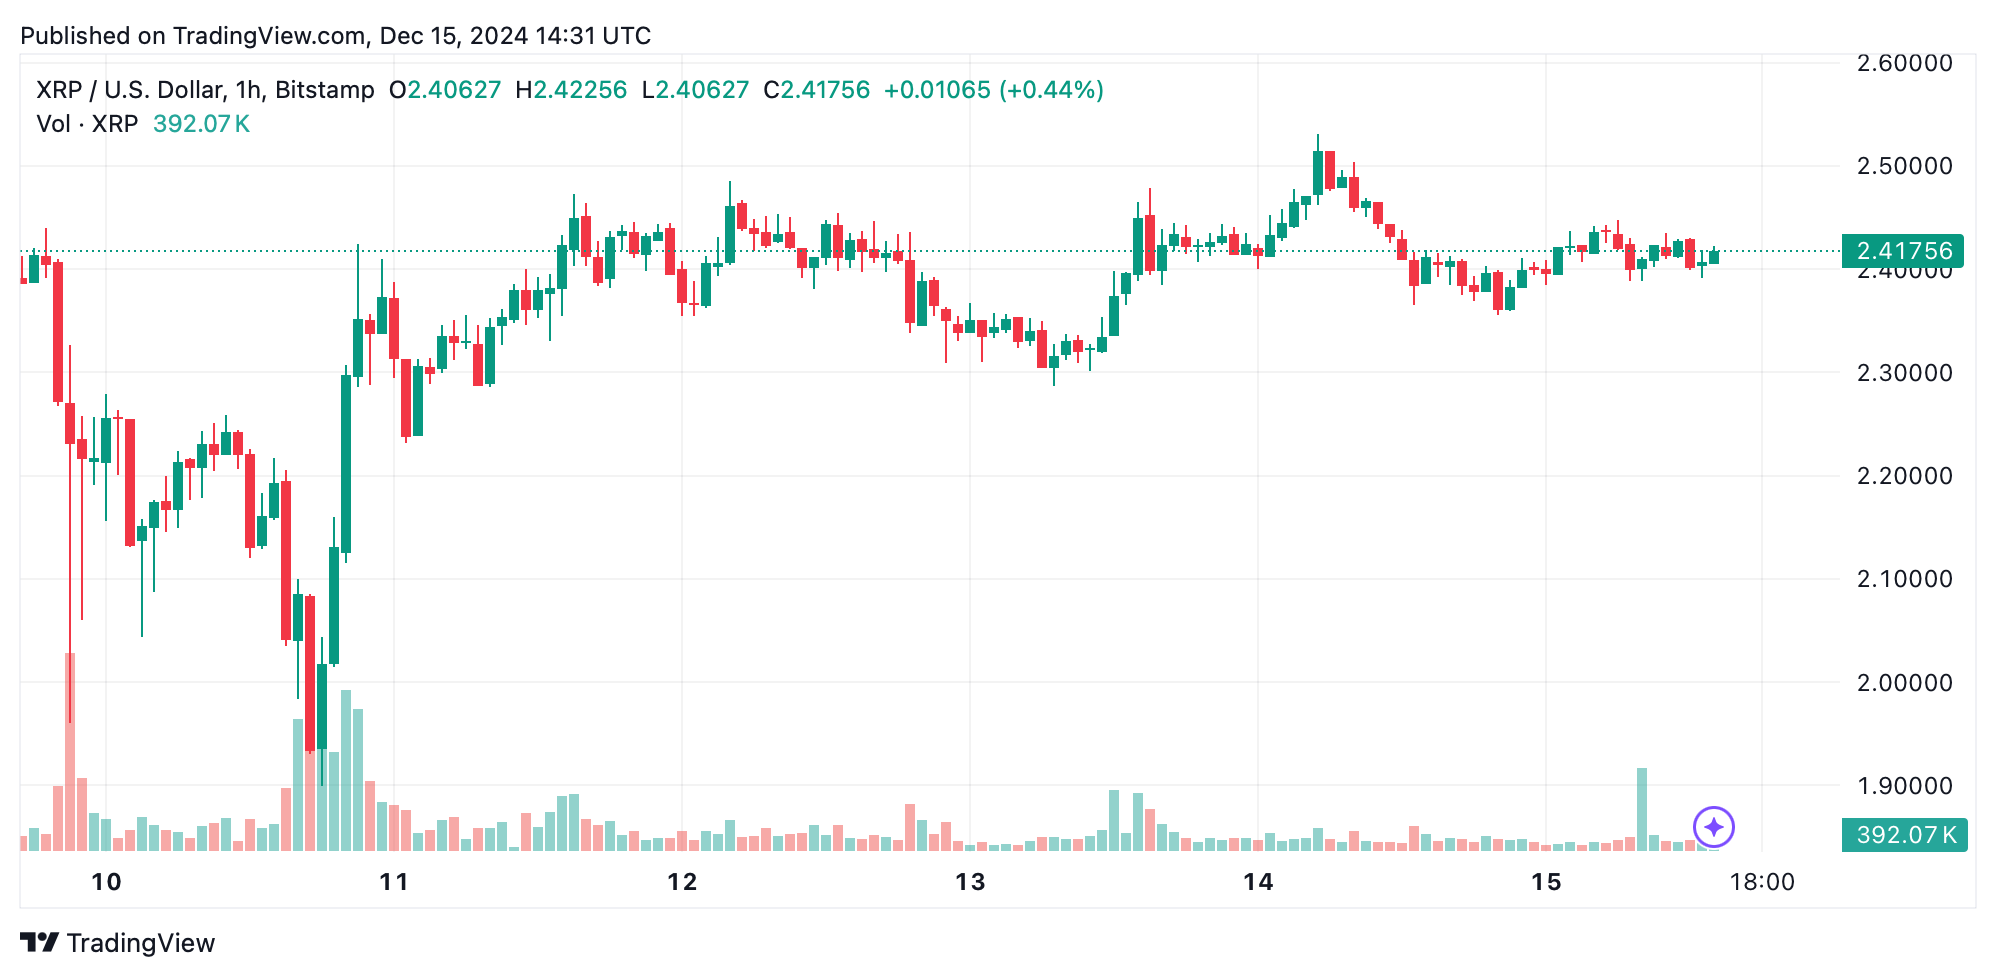
XRP 1H chart on Dec. 15.
The 1-hour chart echoes the 4-hour story, with XRP bouncing between $2.38 support and $2.45 resistance. The quiet volumes signal low trader enthusiasm, a fact echoed by the awesome oscillator and momentum indicators. Momentum (10) at 0.164 gives a green light for a buy, offering quick scalping opportunities in this narrow corridor. Breaking above $2.50 or falling under $2.38 could stir up some real excitement.
Across all timeframes, the oscillators — RSI, Stochastic, CCI, and moving average convergence divergence (MACD) — are sending mixed vibes. While the momentum indicator is cheering for buyers, the MACD at -0.30219 is waving a caution flag for sellers. The long-term moving averages, with the 100-period EMA at $1.20 and 200-period EMA at $0.92, paint a clear picture of a bullish trend. However, the short-term averages, like the 10-period EMA at $2.36, are syncing with the current price, highlighting the ongoing consolidation.
Bull Verdict:
XRP’s strong long-term bullish momentum, supported by the upward alignment of moving averages and consolidation at higher levels, signals potential for a breakout above $2.53. If this occurs, XRP could target $2.70 and potentially retest its $2.90 high, driven by renewed volume and market enthusiasm. Bulls remain optimistic as long as key support at $2.40 holds.
Bear Verdict:
XRP’s declining volume and lack of decisive price movement raise concerns of a bearish breakdown. A fall below $2.40 could open the door for deeper corrections, targeting $2.20 or even $1.90. Bears will look to exploit the waning momentum, particularly if the $2.38 support zone fails on lower timeframes.
免责声明:本文章仅代表作者个人观点,不代表本平台的立场和观点。本文章仅供信息分享,不构成对任何人的任何投资建议。用户与作者之间的任何争议,与本平台无关。如网页中刊载的文章或图片涉及侵权,请提供相关的权利证明和身份证明发送邮件到support@aicoin.com,本平台相关工作人员将会进行核查。


