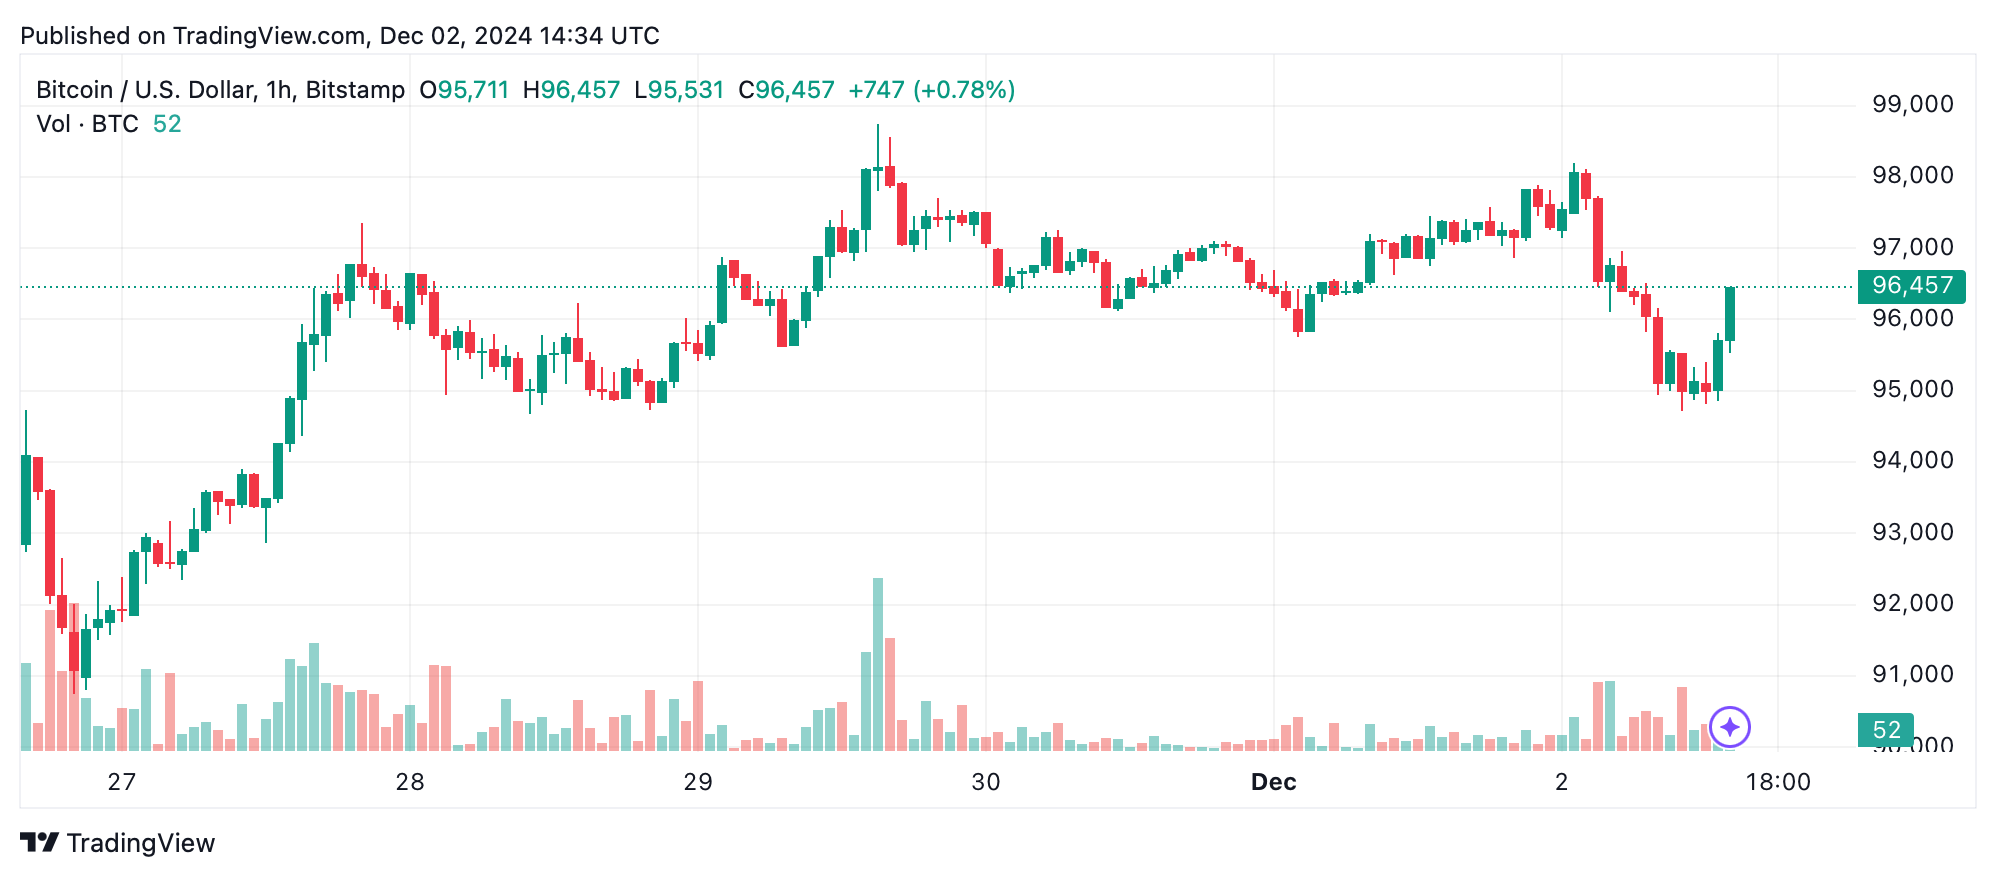
On the 1-hour chart, bitcoin shows a sharp drop from $98,200 to $94,712, followed by a moderate recovery. A spike in sell volume during the decline suggests capitulation, while the weak recovery volume questions bullish strength. Immediate support rests at $94,700, with resistance at $96,500. Traders should wait for bullish confirmation, such as higher lows and increasing volume, before entering positions. Exits near $96,500 or a stop below $94,000 would mitigate short-term risk.

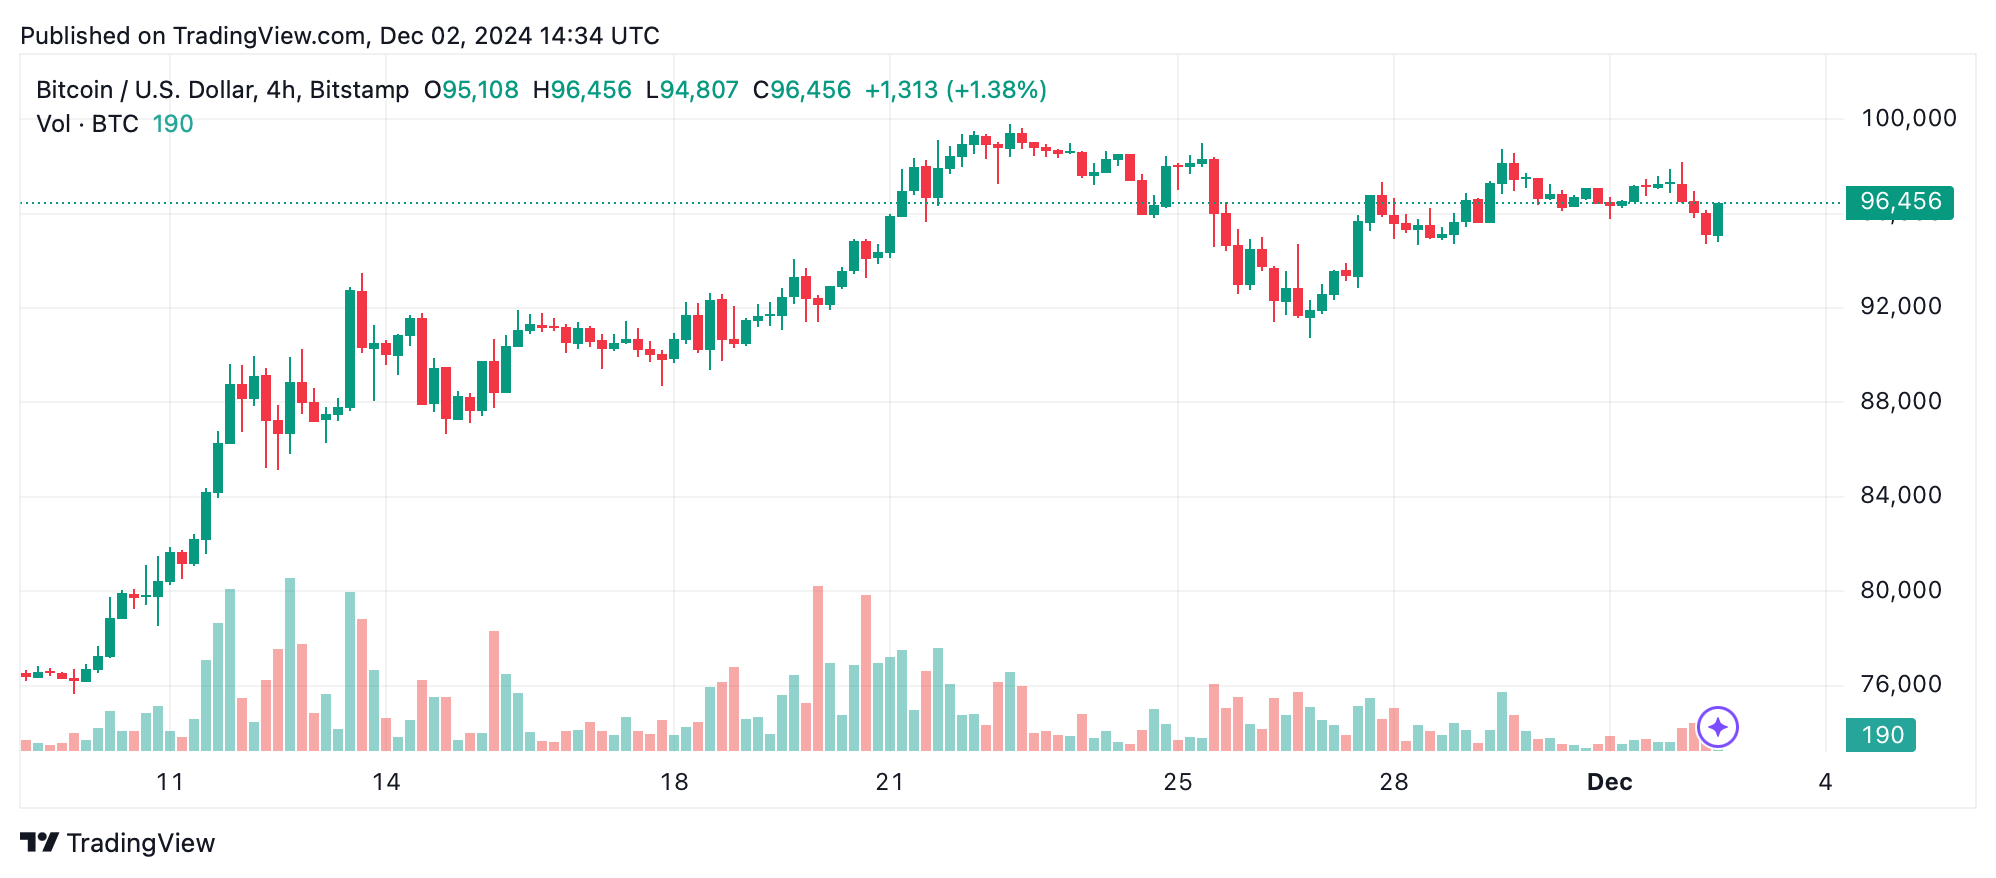
The 4-hour chart displays a medium-term downtrend, with lower highs and lows forming since the $98,745 mark. Resistance at $98,000-$98,500 and support at $95,000 outline a narrow trading range. Increased sell volume during pullbacks strengthens the bearish case, but a potential reversal near $95,000 offers opportunities for bulls. Entry around this support, coupled with an exit at $98,000 or a stop-loss below $93,000, balances risk and reward.

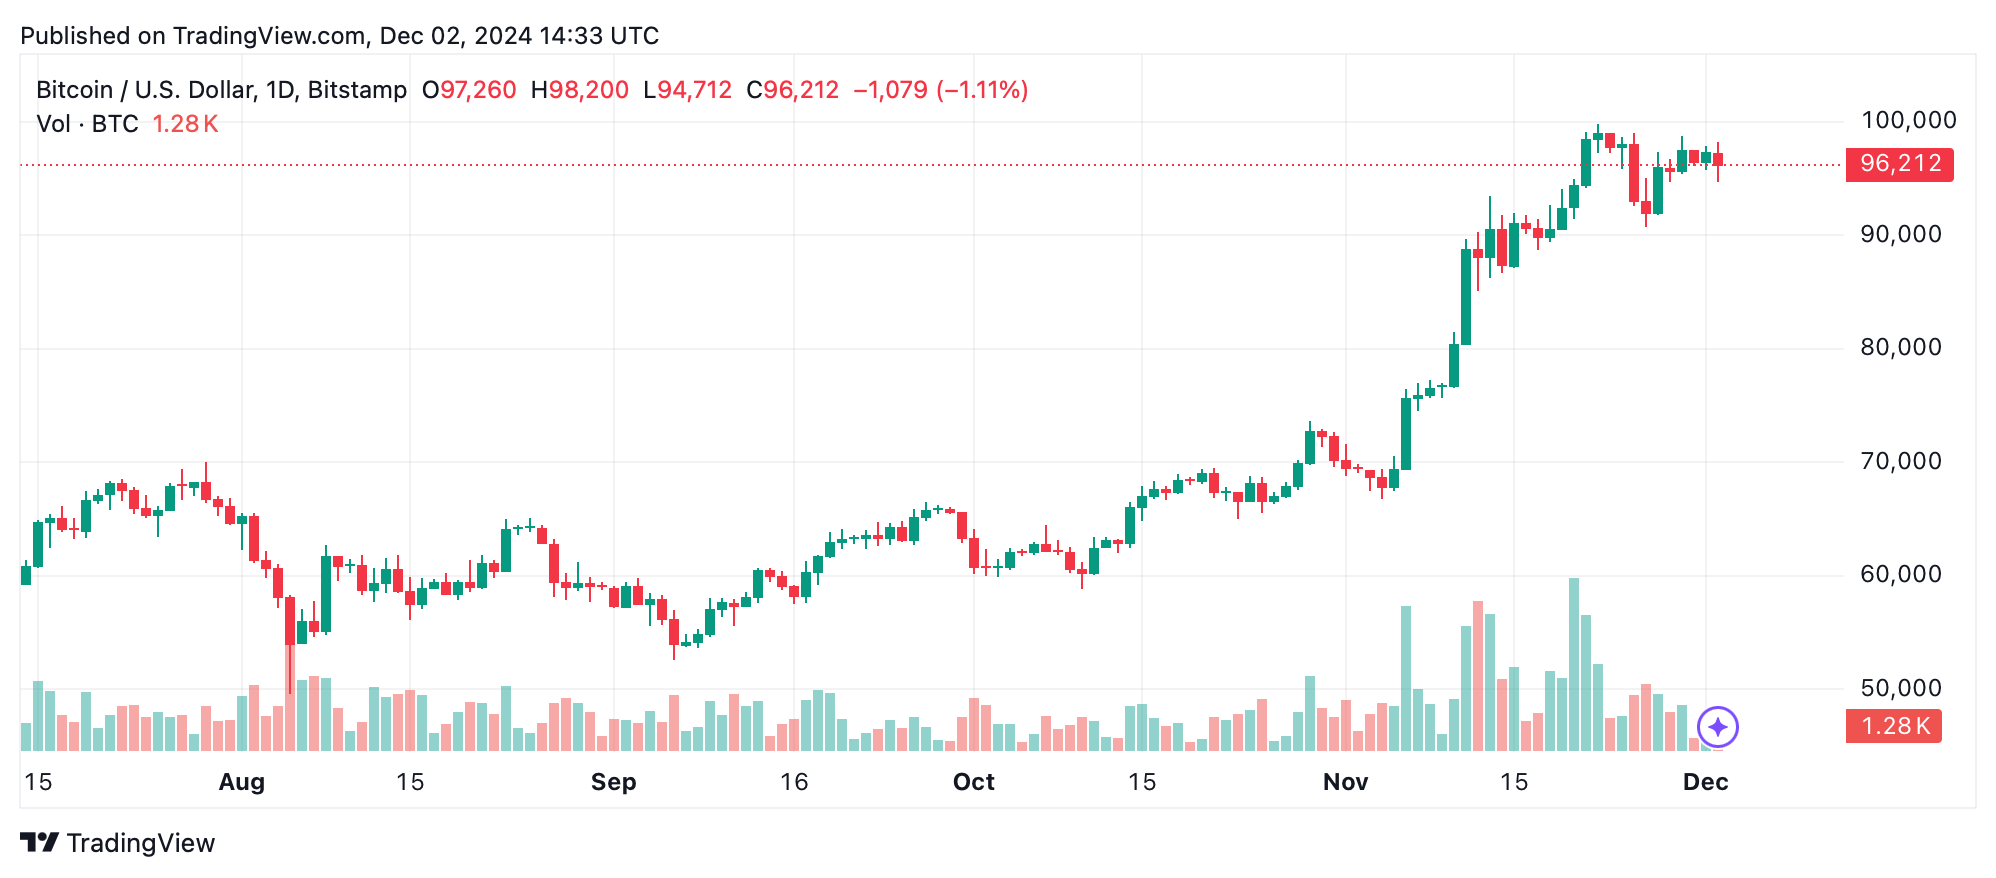
The daily chart reflects a broader uptrend with bitcoin nearing the critical $100,000 resistance level. However, declining volume of recent candles signals fading momentum. The intraday range of $94,878 to $98,145 aligns with this consolidation phase. Long-term investors should consider entering positions only on a breakout above $100,000 with strong volume confirmation, while cautious exits should be planned if the price falls below $95,000.

Key oscillators point to neutrality, with the relative strength index (RSI), stochastic, and commodity channel index (CCI) all neutral. The average directional index (ADX) of 47 also confirms a lack of strong directional momentum. Meanwhile, momentum (-3,241) and moving average convergence divergence (MACD) (4,712) indicate bearish tendencies. These signals suggest short-term caution, requiring additional confirmation for new trades.
Moving averages (MAs) underline bitcoin’s broader bullish sentiment. Short-term exponential moving averages (EMA) and simple moving averages (SMA) diverge, with EMA (10) signaling a buy at $95,591 and SMA (10) suggesting a sell at $95,940. However, all longer-term averages, including EMA (200) at $68,746 and SMA (200) at $67,207, remain in strong buy territory, underscoring long-term bullish potential despite short-term volatility.
Bull Verdict:
Bitcoin’s long-term technical indicators suggest bullish strength, with all major moving averages signaling buy opportunities. The broader uptrend remains intact, with potential for a breakout above $100,000 if accompanied by strong volume. For investors, the consolidation phase may present an ideal entry point to capitalize on future upward momentum.
Bear Verdict:
Short-term charts and oscillators highlight weakening momentum, with sell signals from momentum and MACD indicators. The failure to sustain gains above $98,000 and declining trading volume increase the risk of further pullbacks. A breach below $94,000 could signal a deeper correction, challenging bitcoin’s resilience at key support levels.
免责声明:本文章仅代表作者个人观点,不代表本平台的立场和观点。本文章仅供信息分享,不构成对任何人的任何投资建议。用户与作者之间的任何争议,与本平台无关。如网页中刊载的文章或图片涉及侵权,请提供相关的权利证明和身份证明发送邮件到support@aicoin.com,本平台相关工作人员将会进行核查。


