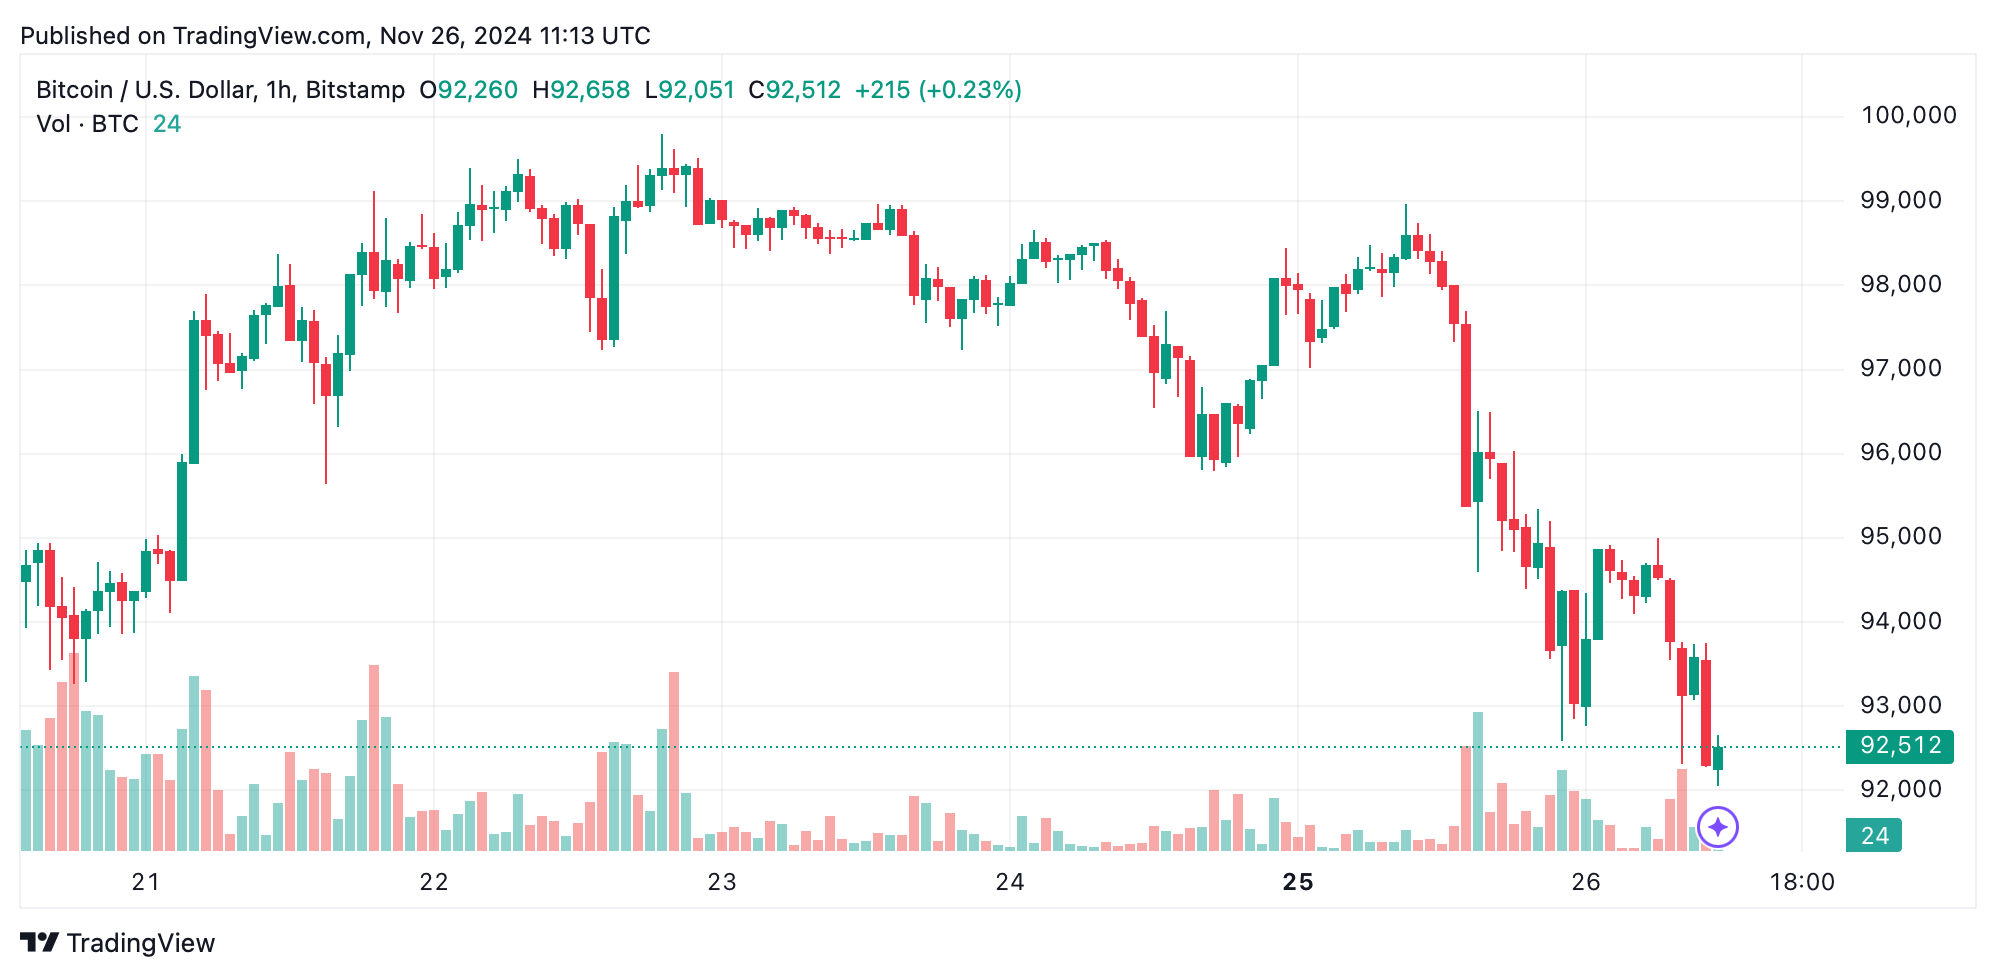
On the 1-hour chart, bitcoin‘s descent is evident, marked by a consistent pattern of lower highs and lows. A bold red candlestick sliced through the $93,000 level, accompanied by an uptick in trading volume, signaling intensified selling activity. While a short-term rebound remains possible, the inability to stabilize below $93,000 suggests a risk of further losses. Traders looking for opportunities may find clarity in a consolidation or recovery near $92,000–$92,500 before re-entering the market.

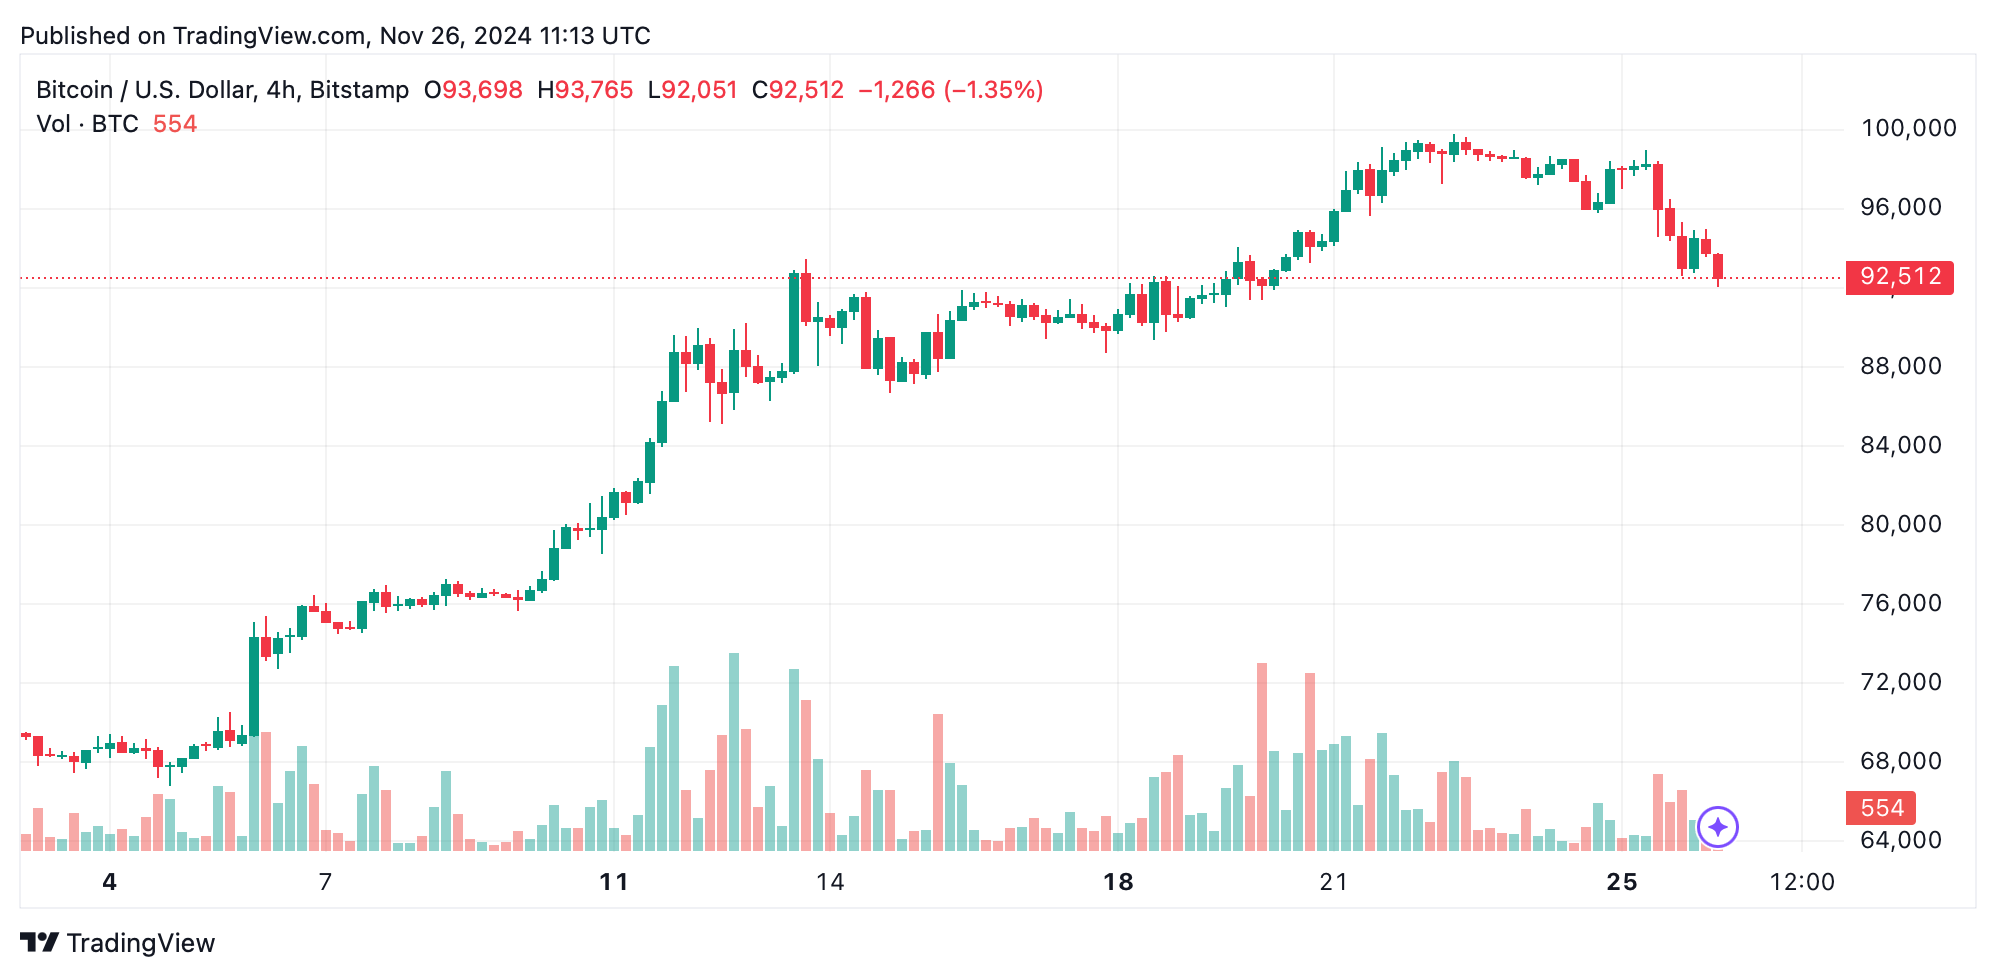
Zooming out to the 4-hour chart, the bearish trend strengthens. Bitcoin faltered at the $99,800 resistance and confirmed a downturn by falling below $95,000. Market sentiment now hinges on the $92,000 level; a break here could push prices closer to $90,000. Mounting sell volume amplifies this caution.

For this timeframe, traders are watching for bullish reversal patterns, like a hammer candlestick, as potential signals to go long near crucial support areas. On Nov. 25, the market painted its boldest bearish candle in months, setting a dramatic tone for the day.

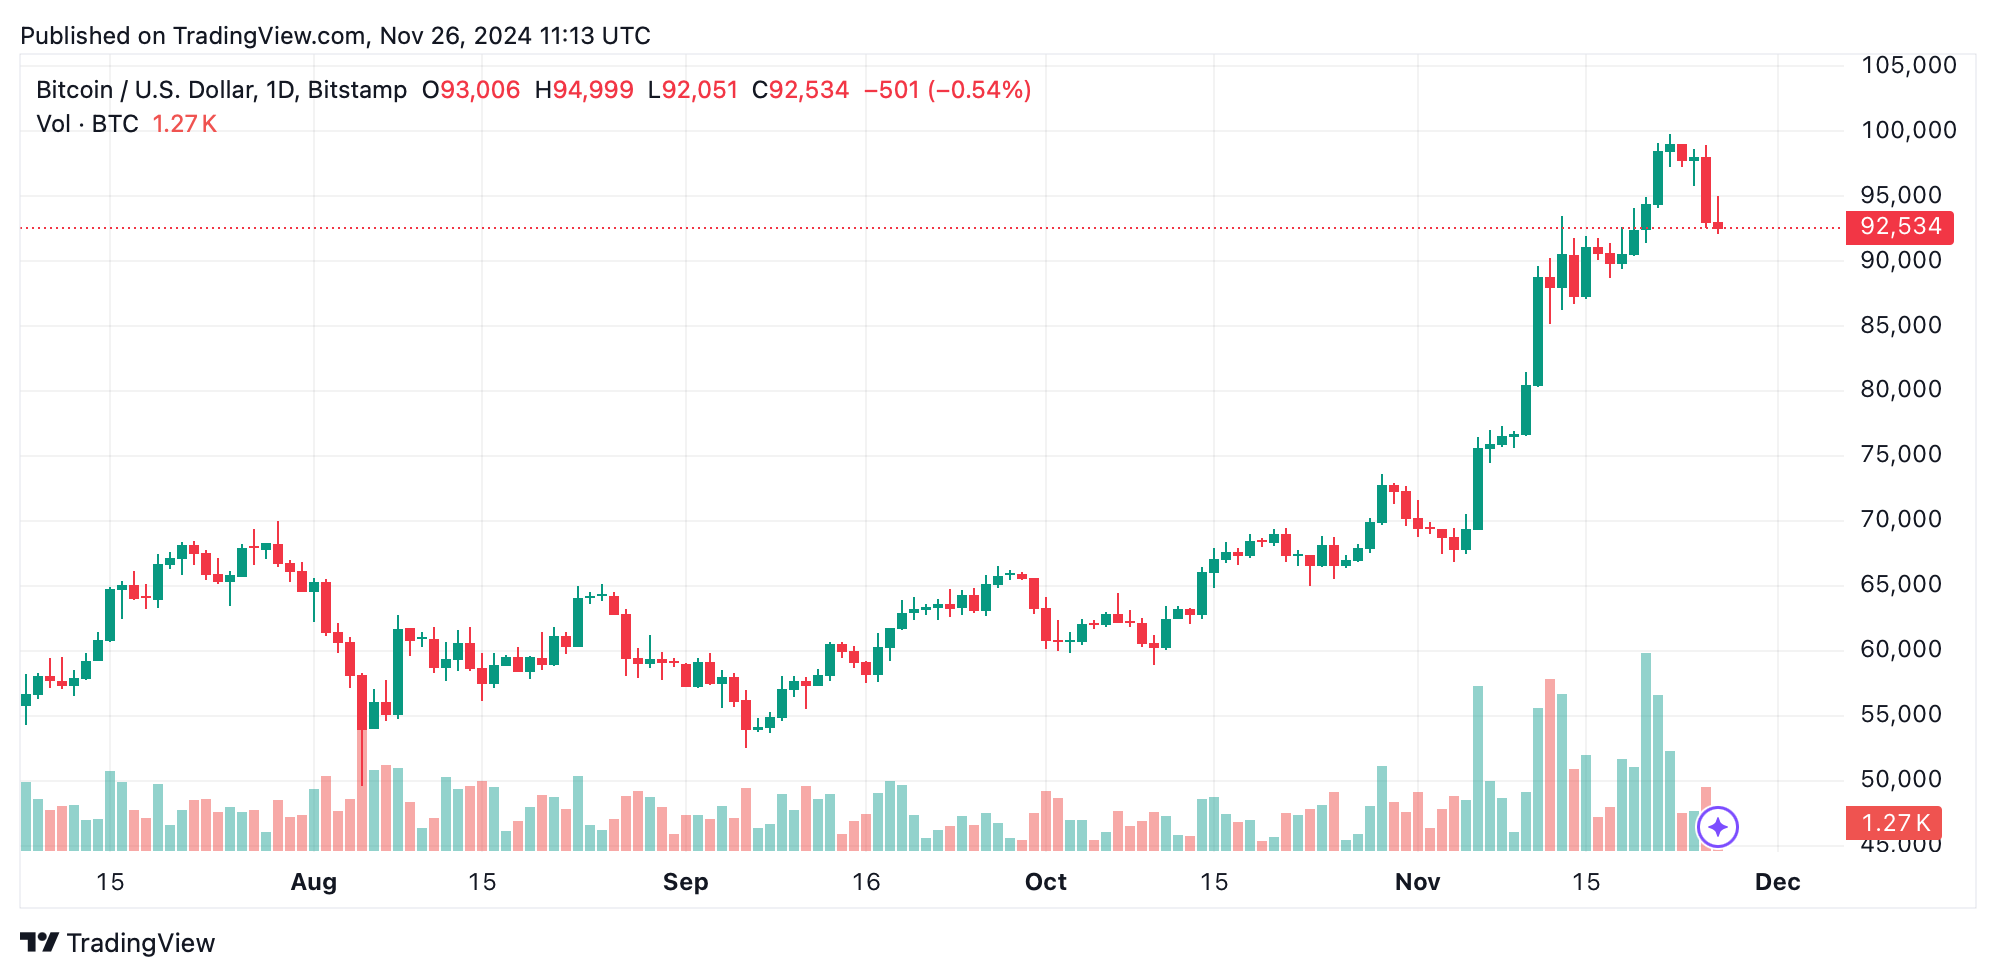
Despite the challenges in shorter timeframes, the daily chart tells a broader story of bitcoin’s long-term uptrend, climbing from $65,521 to a high of $99,800. This pullback hints at a natural market correction, though heightened selling volume clouds immediate optimism. The $90,000 zone, a strong psychological anchor with historical relevance, could become the stage for a recovery. Observant traders will keep an eye on this level for a bounce back to the upward trajectory.
Technical oscillators offer mixed signals. Oscillators like the relative strength index (RSI) at 63 and the Stochastic at 64 points to neutral territory. Momentum tools, such as the 10-period momentum indicator and moving average convergence divergence (MACD), lean bearish. Moving averages tell a divided story: shorter periods (10) advise selling, while longer spans (30, 50, 100, 200) continue to favor buying opportunities.
Cautious traders will likely wait for signs of a trend reversal or consolidation above $92,000 before committing. Shorting rallies toward the $94,000–$95,000 resistance and aiming for $90,000 as a target might prove rewarding for those with a more daring approach. Overall, the immediate outlook leans bearish, but bitcoin’s overarching uptrend offers hope for a rebound, especially for traders tuned into key support zones.
Bull Verdict:
Even with bearish currents, bitcoin’s long-term uptrend stays unshaken, with $90,000 acting as a potential springboard for recovery. If this support holds and sentiment brightens, bitcoin could retest resistance around $94,000 and eye new highs beyond $99,800 in the weeks ahead.
Bear Verdict:
For now, the short- and mid-term sentiment remains firmly negative, as growing sell pressure and breaches of key support, including $92,000, hint at a slide toward $90,000 or lower. Without consolidation at critical levels, a deeper correction may eclipse any near-term bounce.
免责声明:本文章仅代表作者个人观点,不代表本平台的立场和观点。本文章仅供信息分享,不构成对任何人的任何投资建议。用户与作者之间的任何争议,与本平台无关。如网页中刊载的文章或图片涉及侵权,请提供相关的权利证明和身份证明发送邮件到support@aicoin.com,本平台相关工作人员将会进行核查。


