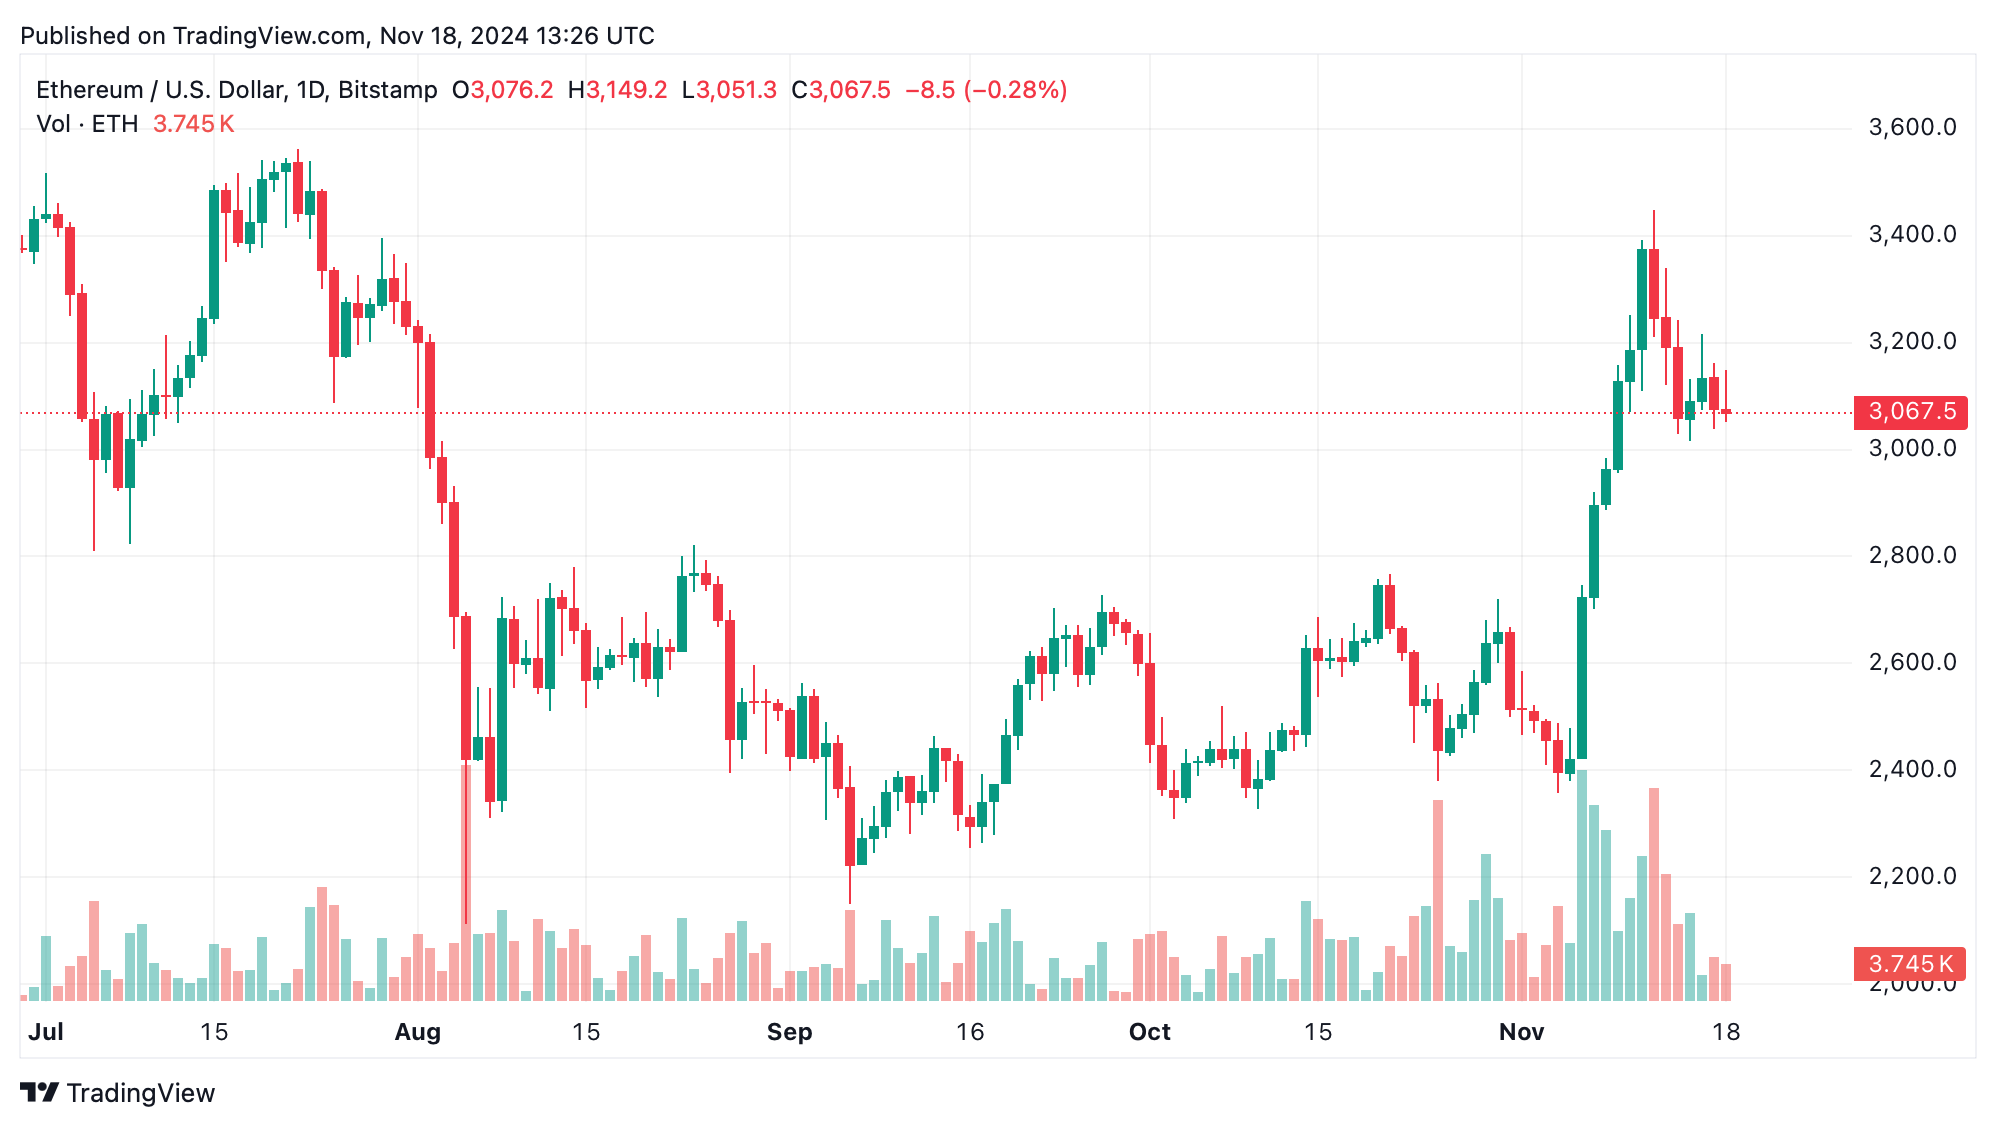
Recently, ethereum (ETH) encountered a dip, finding support at $3,044.5 and resistance at $3,163. Selling activity picked up noticeably, fueling bearish vibes. A bearish engulfing candle around $3,080 hints at short-term selling pressure. However, traders might spot a temporary buying opportunity if the price bounces off $3,044.5 and forms bullish candlestick patterns. Entering between $3,045 and $3,050, aiming for profits at $3,100, could be worthwhile—with a cautious stop-loss set below $3,030.

ETH/USD daily chart via Bitstamp on Nov. 18, 2024.
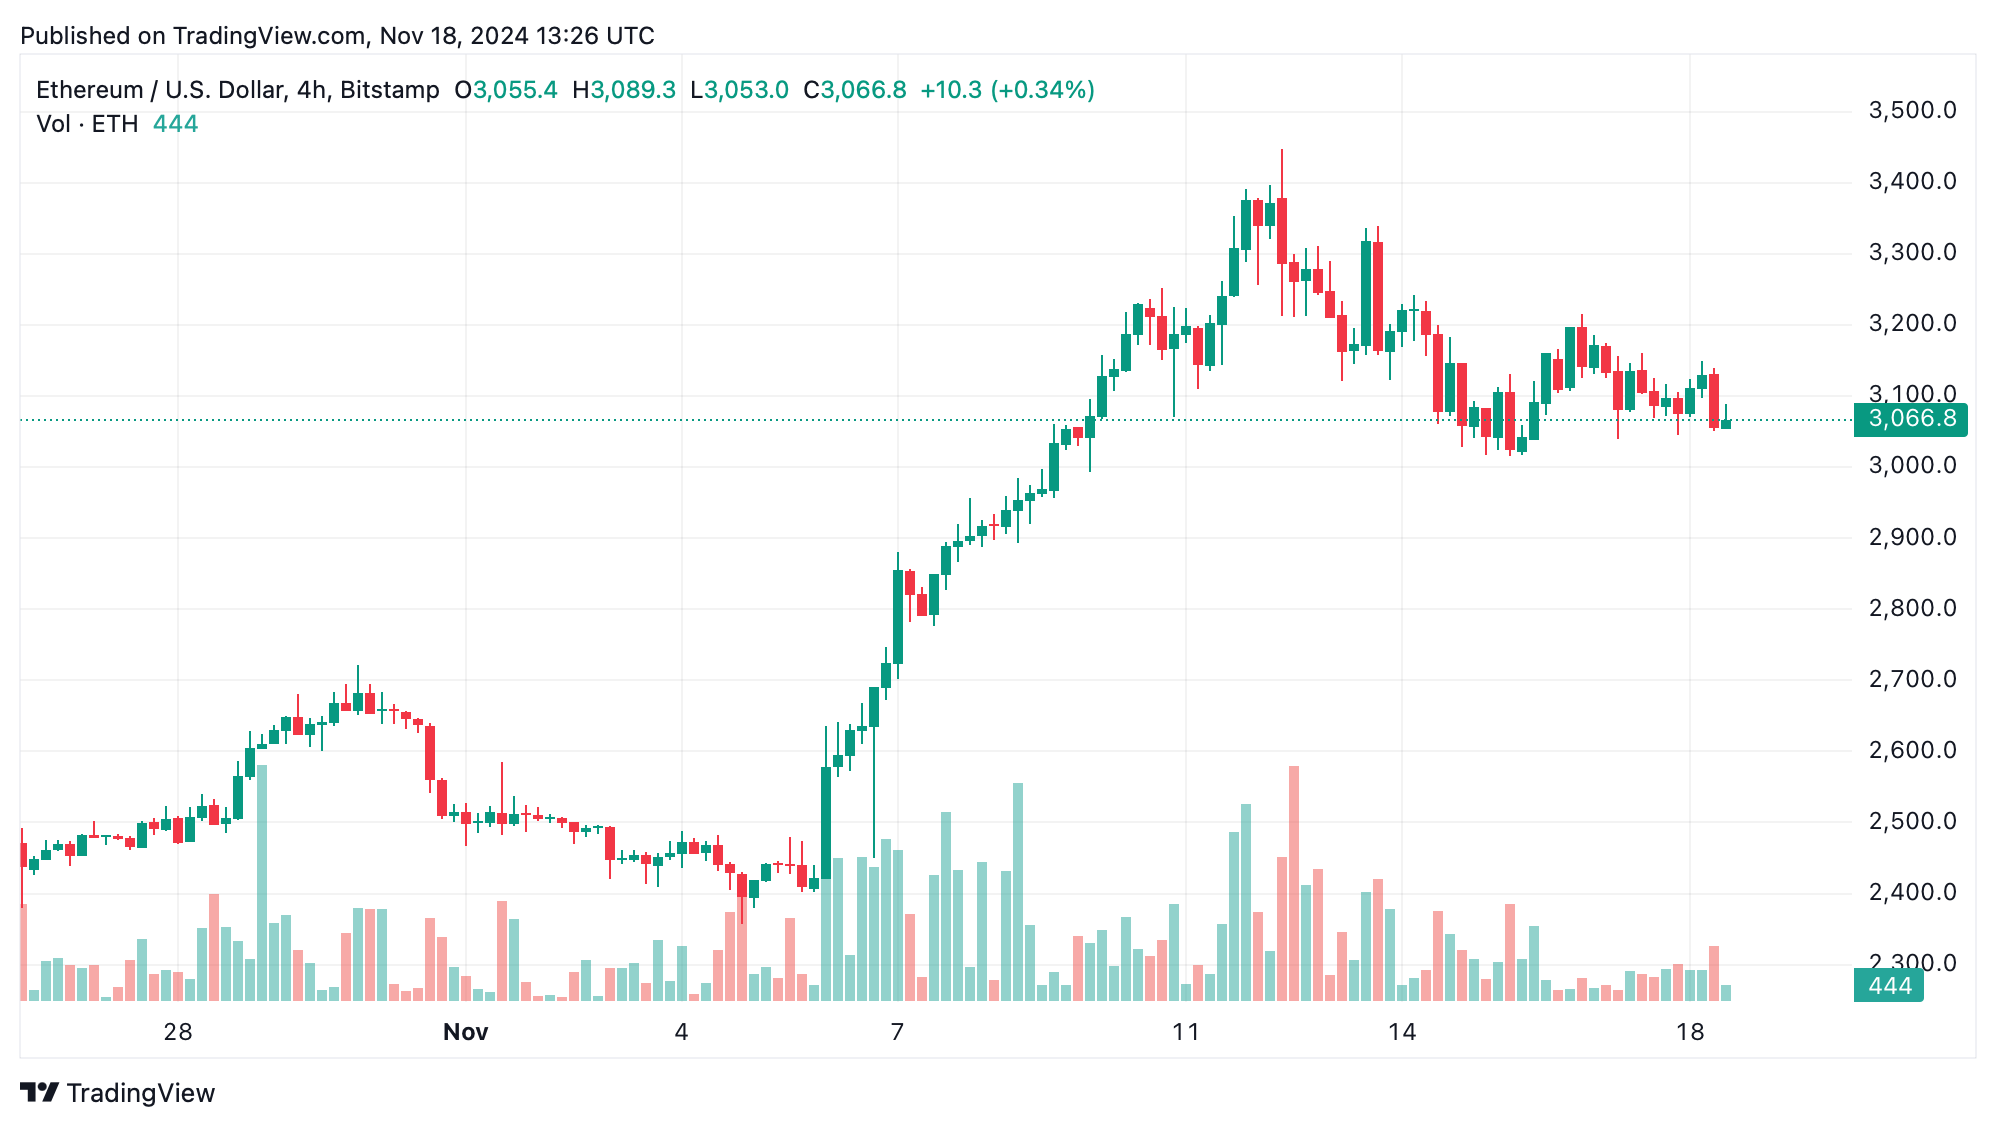
On the 4-hour chart, ethereum is exhibiting a downward trend with lower highs and lows, underpinned by support at $3,014.5 and resistance ranging from $3,150 to $3,200. Strong selling activity confirms resistance at $3,200. A breakout above $3,150 may turn the tide, but if support at $3,015 fails, lower levels are likely to be tested. Risk-averse traders might wait for clearer signals before making moves, keeping stop-losses tight amid the volatility.

ETH/USD 4-hour chart via Bitstamp on Nov. 18, 2024.
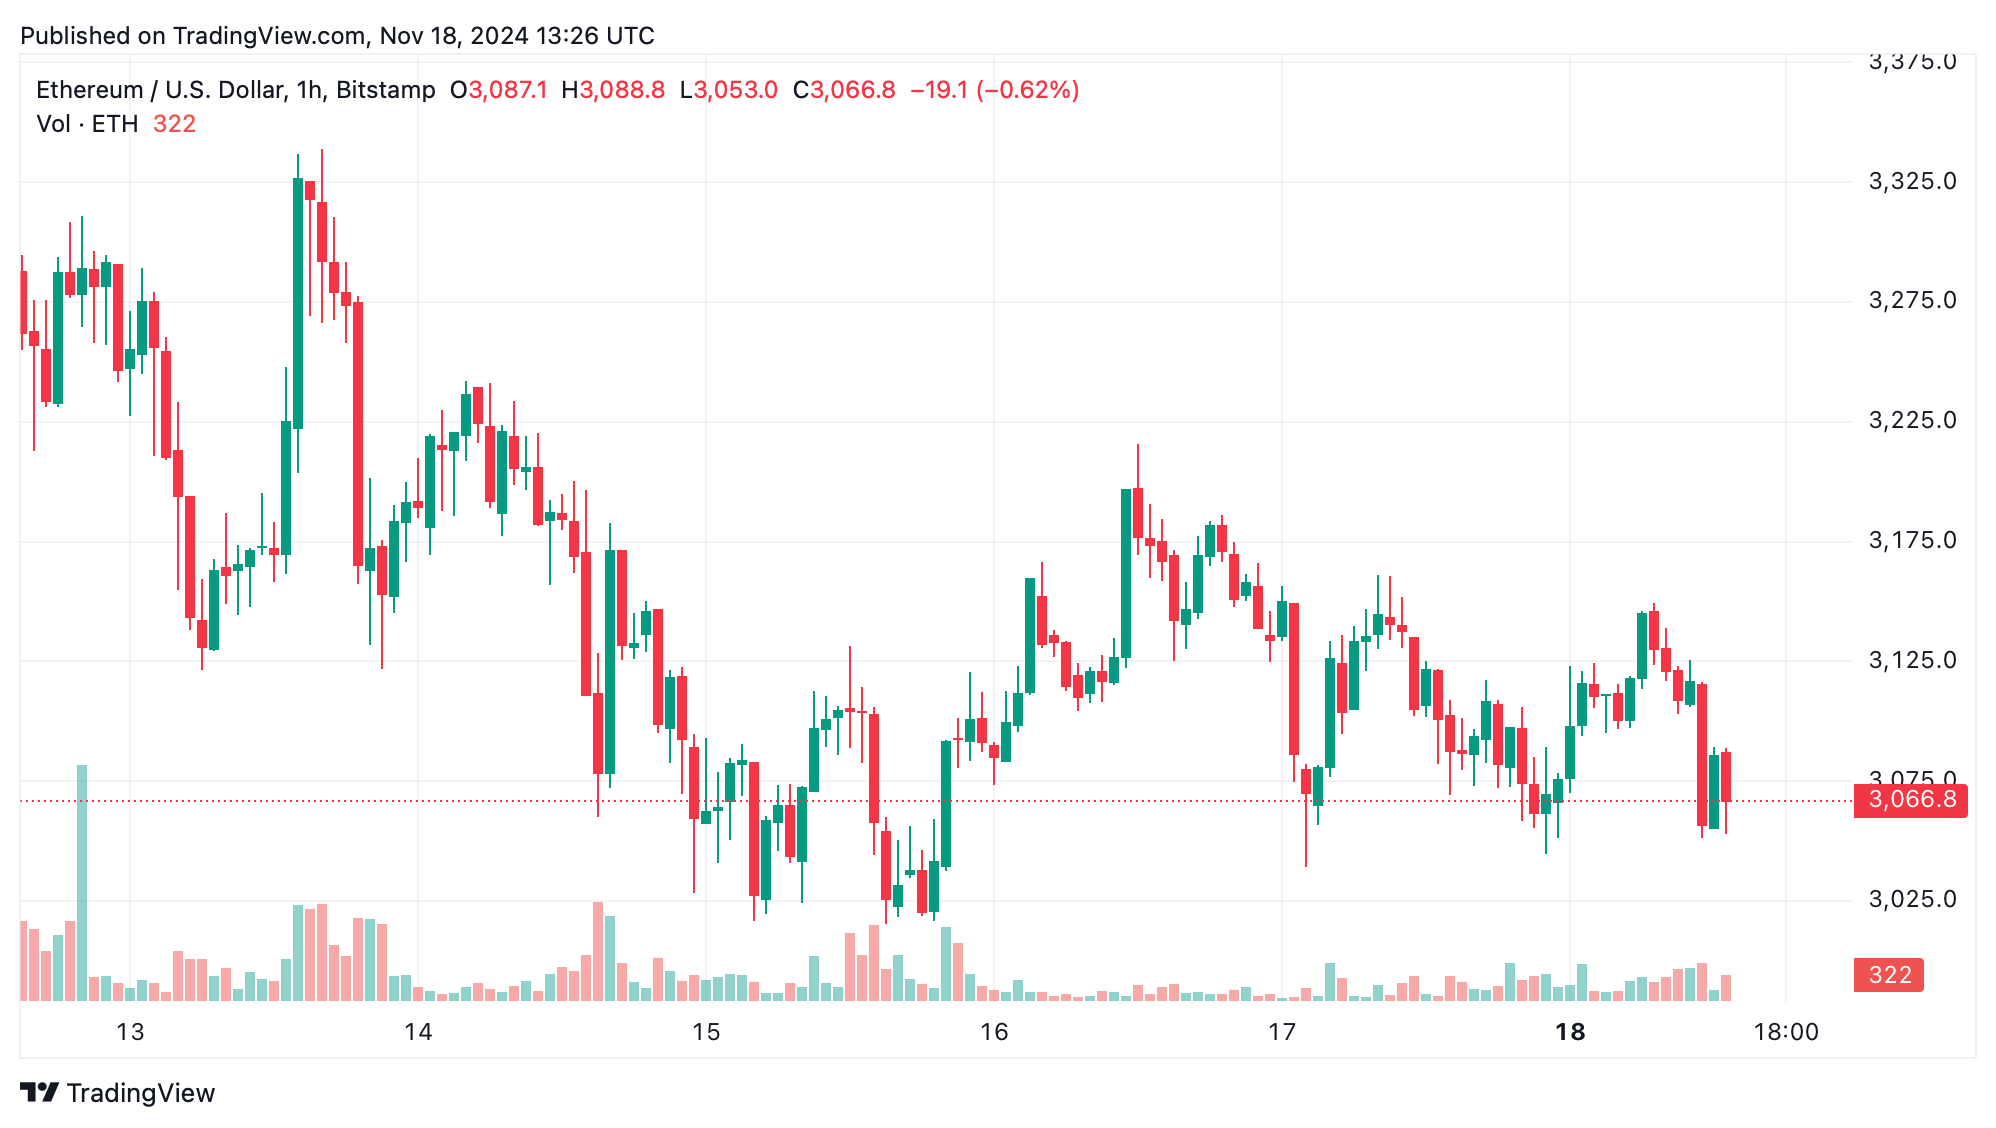
Ethereum experienced a strong climb from $2,355.6 to $3,451.8, followed by a period of consolidation near $3,100. The inability to clear the $3,200 to $3,300 resistance zone led to a healthy pullback. Support between $3,000 and $3,050 remains critical. A drop below $3,000 could push prices toward $2,800, while a solid defense could lay the groundwork for another climb toward $3,450.

ETH/USD 1-hour chart via Bitstamp on Nov. 18, 2024.
Indicators present a mixed bag: the relative strength index (RSI) at 60.2 and the Stochastic at 67.6 points to a neutral stance, signaling a tug-of-war between buyers and sellers. Meanwhile, the moving average convergence divergence (MACD) at 151.5 leans bullish, though the momentum oscillator at 116.3 reflects bearish tendencies. This combination suggests that traders should seek strong confirmation before making moves.
Longer-term moving averages (MAs) reveal a positive trend. The 50-period exponential moving average (EMA) at $2,765.0 and the 200-period EMA at $2,798.8 indicate buying opportunities, while the short-term simple moving average (SMA) at $3,156.9 shows bearish divergence. Traders can use these insights to craft entry and exit plans aligned with their chosen timeframes.
Bull Verdict:
Ethereum remains poised for potential upward momentum if it holds key support levels around $3,044.5 and manages to reclaim resistance zones above $3,150. With bullish indicators from the MACD and longer-term EMAs signaling buying opportunities, a rebound could set the stage for another rally targeting $3,450. Traders with an optimistic outlook may find this a promising setup to capitalize on near-term market opportunities.
Bear Verdict:
The market faces heightened risk as ethereum struggles to maintain critical support levels near $3,015. Increased selling pressure, bearish chart patterns, and short-term SMA divergence suggest the possibility of further declines. If support at $3,000 gives way, the price could slip toward $2,800, leaving cautious traders to await stronger signs of stabilization before considering entries.
免责声明:本文章仅代表作者个人观点,不代表本平台的立场和观点。本文章仅供信息分享,不构成对任何人的任何投资建议。用户与作者之间的任何争议,与本平台无关。如网页中刊载的文章或图片涉及侵权,请提供相关的权利证明和身份证明发送邮件到support@aicoin.com,本平台相关工作人员将会进行核查。


