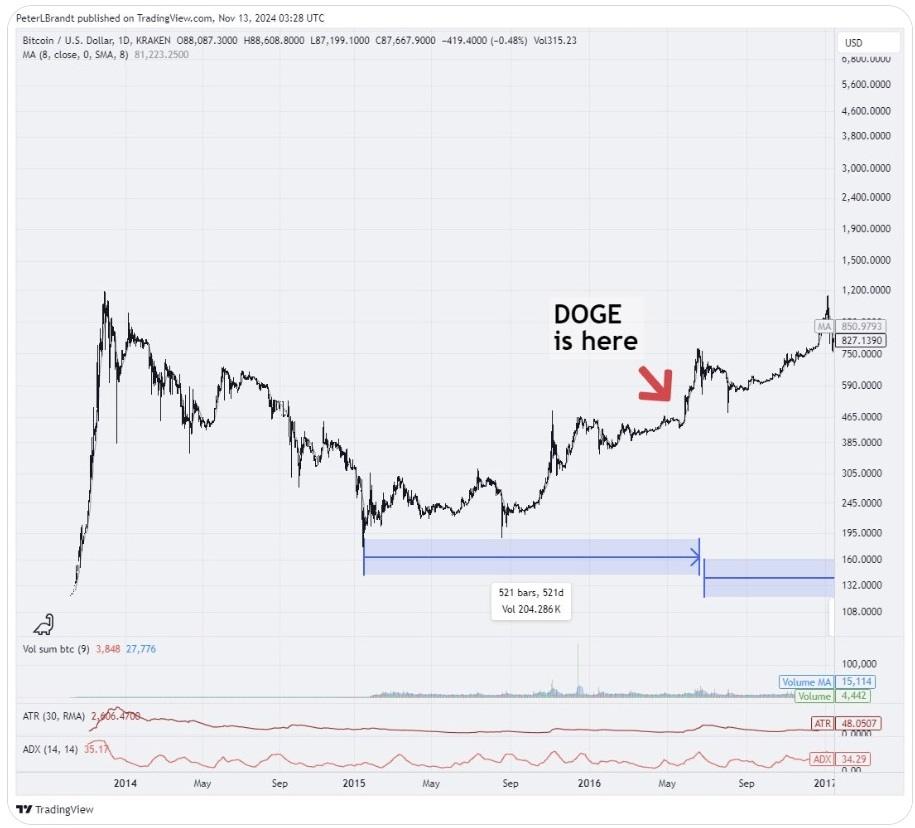
Veteran trader and chartist Peter Brandt took to social media platform X on Wednesday to highlight a potential parallel between the current price movement of dogecoin (DOGE) and bitcoin (BTC) during the 2015-2016 period.
Brandt identified several technical similarities, including DOGE’s “blow-off top,” a correction forming through a falling wedge pattern, a double bottom, and a subsequent complex correction phase. A “blow-off top” describes a chart pattern where an asset’s price rapidly and sharply rises, only to be followed by a sudden, steep decline. The trader suggested that DOGE is currently in a phase similar to BTC’s position in May 2016, indicating it may be approaching a notable trend reversal. He emphasized:
DOGE is at life cycle where BTC was in May 2016. It was the chart in Spring 2016 that first turned me onto bitcoin and I bought my first coin.

Chart shared by Peter Brandt.
In another X post, he expressed his enthusiasm for dogecoin’s performance as a strong example of classical charting principles, noting that DOGE “has been an outstanding charting market following classical charting principles.”
Last week, Brandt also expressed optimism about dogecoin’s price outlook, forecasting a significant rally backed by a key technical indicator and Elon Musk’s influence. He highlighted a “channel breakout” in DOGE’s chart, a pattern he connects with new all-time highs on the horizon. Emphasizing Musk’s role, Brandt believes that Musk’s endorsement and ongoing interest add to DOGE’s potential, stating, “In Musk we Trust.”
免责声明:本文章仅代表作者个人观点,不代表本平台的立场和观点。本文章仅供信息分享,不构成对任何人的任何投资建议。用户与作者之间的任何争议,与本平台无关。如网页中刊载的文章或图片涉及侵权,请提供相关的权利证明和身份证明发送邮件到support@aicoin.com,本平台相关工作人员将会进行核查。


