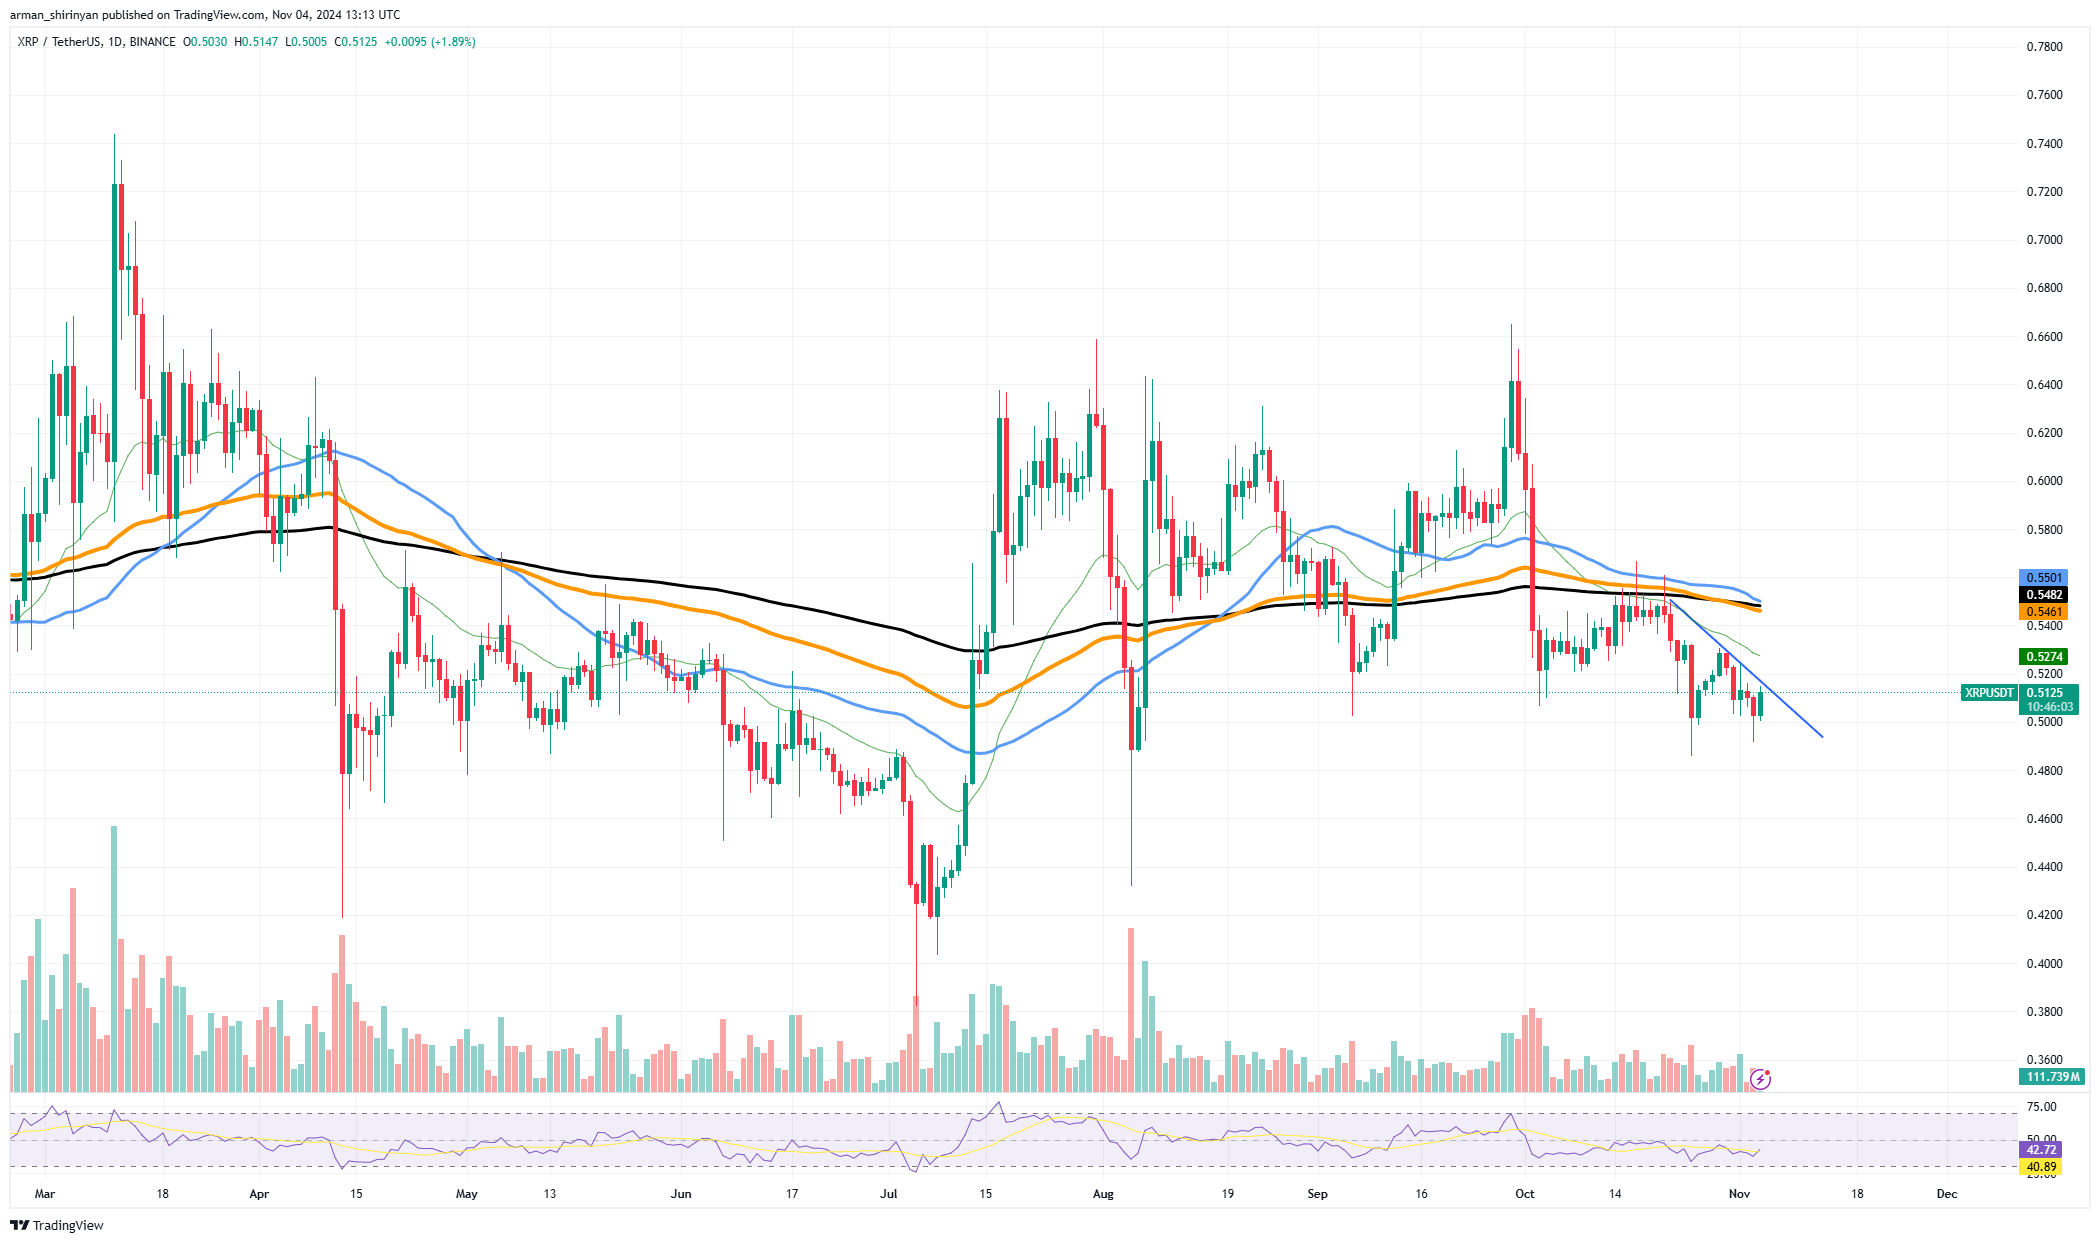
XRP has been stuck in a downward trend since the end of October and is finding it difficult to pick up steam. The chart displays a distinct downward trendline that has served as a barrier that XRP has been unable to overcome. The market's pessimism is reflected in this line of resistance, which drives the price lower whenever XRP comes near it. In order to signify a reversal, XRP must break above this line and hold its position for the downtrend to end.
Given the downtrend and the regular formation of lower highs and lower lows, it appears that bearish pressure is still present. This pattern demonstrates that every rally attempt is met with selling, which keeps XRP from establishing a strong foundation for an upward trend. In this scenario, the key level to keep an eye on is around $0.53, where an upward breakout could be supported or suppressed by a convergence of resistance levels.

XRP/USDT Chart by TradingView
XRP may indicate the end of the downtrend if it can close above this resistance line and keep up its momentum. In order to determine whether buying interest is returning to the market, traders will probably watch for a confirmed breakout and a notable volume increase. Should XRP break out of this level, it could resume its upward trajectory and head toward the next resistance levels, which are located at about $0.54 and $0.56.
HOT Stories Bitcoin ETFs Record Largest Outflows of All Time Mt. Gox’s Coins on the Move as BTC Price Plunges to $66K Here's When XRP Downtrend Can End, Tron (TRX) Shows 36% Rally Everyone Is Missing, Solana (SOL) Price Drops by 11%, But Bullish Signal Is Here Here's Why This Bitcoin Market Cycle Is Different
However, XRP is still in a precarious position until that breakout occurs. Since XRP is having trouble attracting the buying pressure required to break out of its bearish trend, the downtrend points to short-term caution. The $0.53 level is one that investors should closely monitor because a break through it might indicate that XRP is prepared to turn around and begin an upward trajectory.
Tron's background growth
While most of the attention in the cryptocurrency world is still on big assets like Bitcoin and Ethereum, Tron has quietly delivered an impressive rally, rising by 36% in recent months. In contrast to other altcoins that are having difficulty sustaining momentum, TRX has demonstrated exceptional strength and resilience.
Tron is able to stand out with consistent gains thanks to the chart's steady upward trend, which is mainly unrelated to the larger cryptocurrency market. The price has risen steadily during the rally, as opposed to sharply, which is often a sign of volatility. TRX is a desirable alternative for investors looking for more stable altcoins because of this trend, which emphasizes its potential for steady growth as it rises.
Related

Mon, 11/04/2024 - 13:02 200 Billion Shiba Inu (SHIB) Suddenly Land in Top US Exchange's Wallet

Gamza Khanzadaev
Key resistance levels are important to monitor in order to determine where the asset may encounter difficulties, as TRX continues on its upward trajectory. TRX is currently targeting the $0.1700 mark, which represents a significant technical and psychological barrier. A path toward $0.1750, which is consistent with past price action and might serve as a small obstacle, could become available if this level is broken.
The longer-term target and more formidable resistance level, $0.1800, is where we might see more selling pressure after that. To predict possible reversals or pauses in the rally, investors should monitor these resistance levels as TRX keeps gaining traction. The consistent increase implies that Tron's performance is not merely a passing fad but rather a component of a potentially bigger trend that is subtly developing.
In a market where altcoins frequently face difficulties, TRX's steady increase indicates investor confidence. The current trend for Tron indicates a robust long-term upward trend, with important levels to monitor for additional gains. TRX is a strong alternative due to its growth and stability even though the overall market is still erratic.
Solana's healthy correction
Even though Solana recently saw an 11% decline, a bullish signal is approaching that could give investors hope. A bullish crossover is a technical pattern that the 50-day Exponential Moving Average (EMA) is getting close to crossing above the 100-day EMA. This crossover indicates a change in momentum, frequently resulting in an uptrend where short-term market sentiment surpasses the longer-term trend.
Related

Mon, 11/04/2024 - 12:17 84.9 Million Dogecoin (DOGE) Liquidated in Split Long and Short Losses

Godfrey Benjamin
Buyers may be regaining control and possibly reversing the recent decline when the 50-EMA, the shorter-term EMA, crosses above the 100-EMA, the longer-term one. This crossover might be the cue that fans of Solana have been looking for. Stronger upward movement in the upcoming weeks could result from the crossover's finalization, which could also solidify support levels and pique investors' interest again.
Solana is currently selling for about $161, which is less than its recent peak. This retreat is not always a bad thing, though. They can give assets that have experienced large rallies a fresh start and are frequently healthy corrections. The conditions for a reversal are still in place as long as SOL stays stable around its current level, particularly in light of the expected EMA crossover.
The resistance levels of $170 and $180 will be the next price levels to keep an eye on if SOL can stabilize and pick up steam from the bullish EMA signal. If these are broken, it might strengthen the upward trend and boost interest in purchasing. On the other hand, the EMA setup indicates that bulls may soon return to the market, but failure to hold support levels could result in additional downside.
免责声明:本文章仅代表作者个人观点,不代表本平台的立场和观点。本文章仅供信息分享,不构成对任何人的任何投资建议。用户与作者之间的任何争议,与本平台无关。如网页中刊载的文章或图片涉及侵权,请提供相关的权利证明和身份证明发送邮件到support@aicoin.com,本平台相关工作人员将会进行核查。


