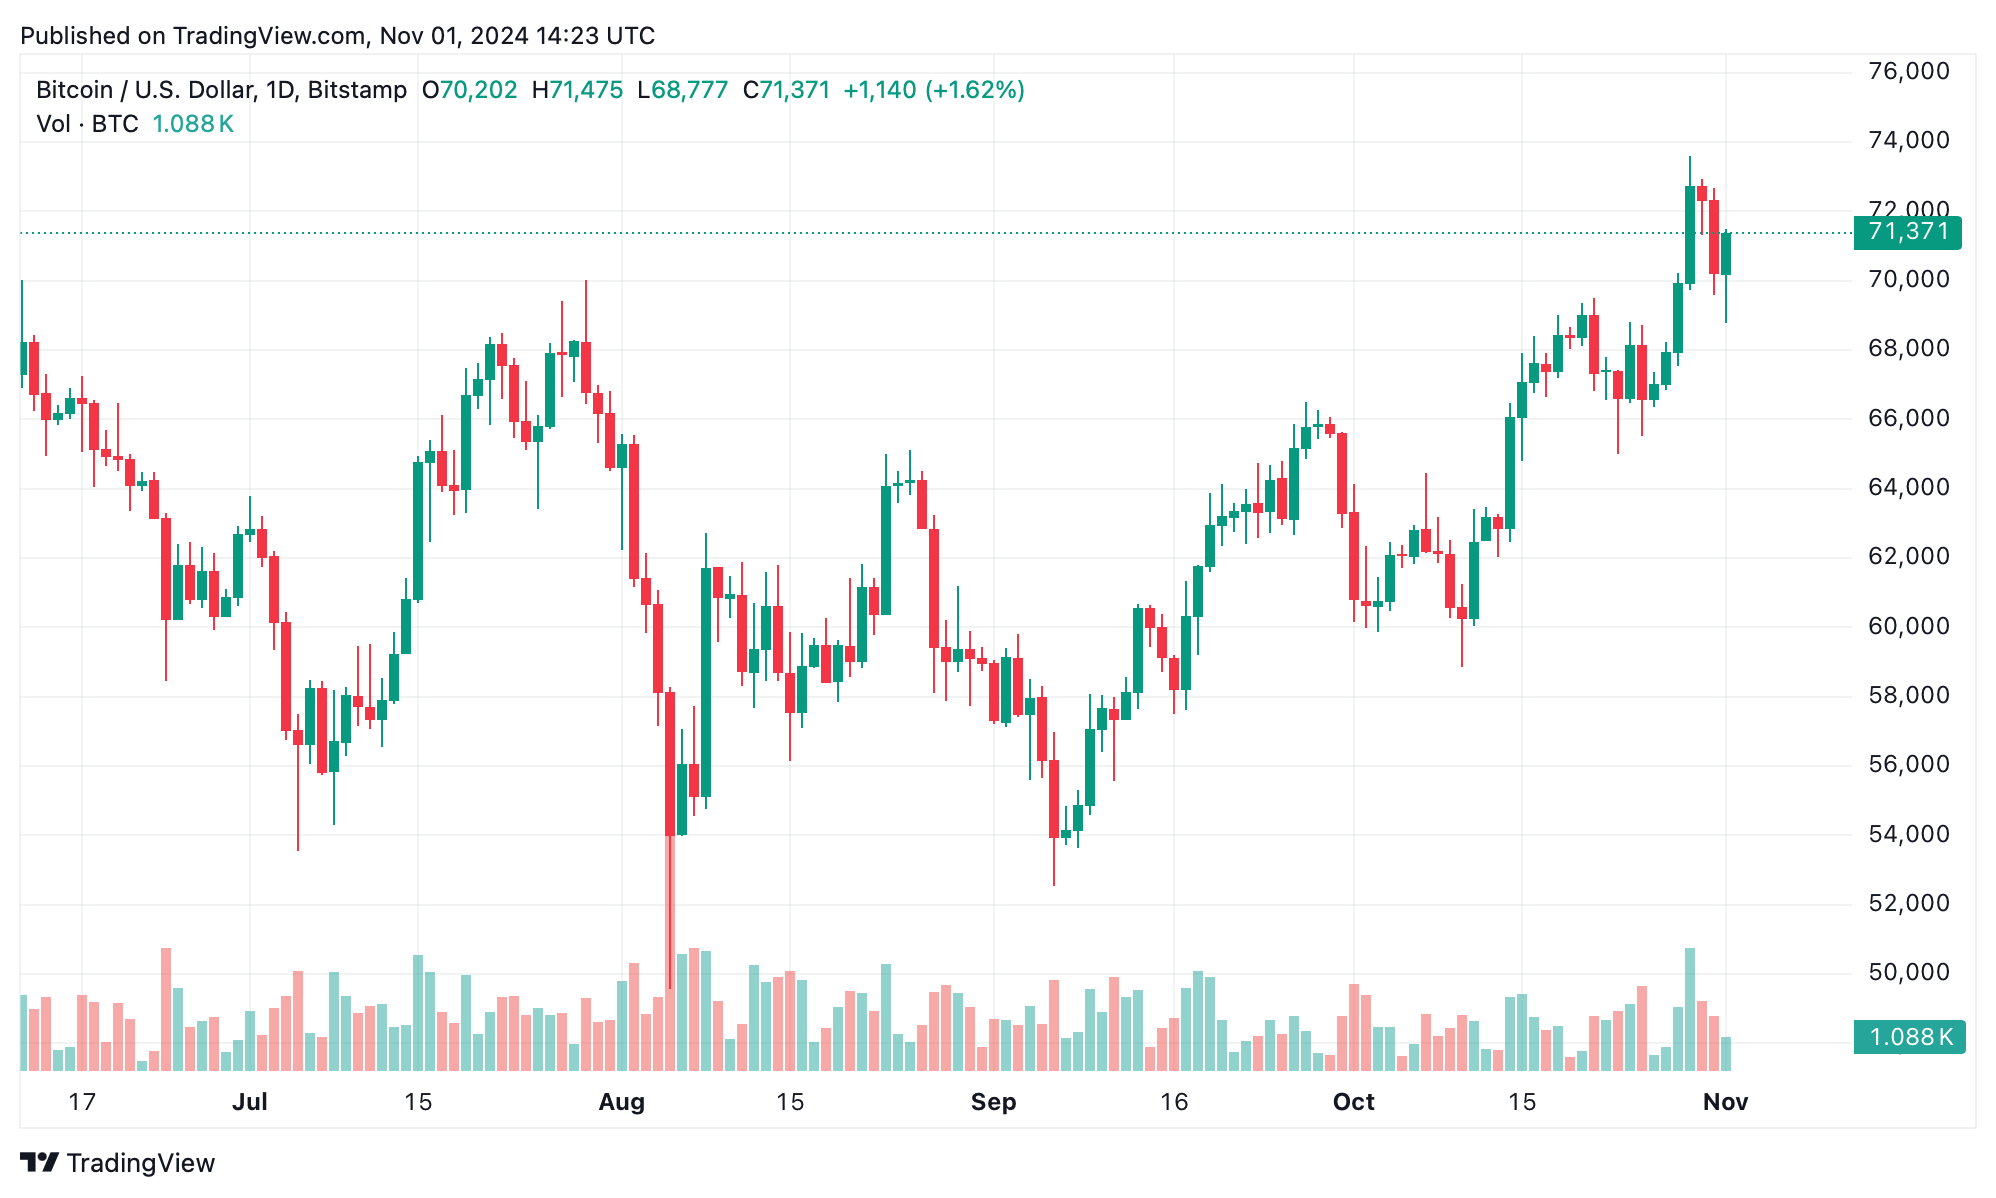
In late October, bitcoin climbed to $73,600 before experiencing a pullback that brought prices below $70,000. Today, the price has seemingly stabilized above $71,000. The daily BTC chart illustrates an upward trend since early October, reinforced by a reliable support range between $69,000 and $70,000, which has brought stability in recent trading sessions. This strength hints that if buying interest remains strong, bitcoin could continue its recovery, though prior resistance points suggest that cautious trading at these levels is advisable.

BTC/USD daily chart on Nov. 1, 2024.
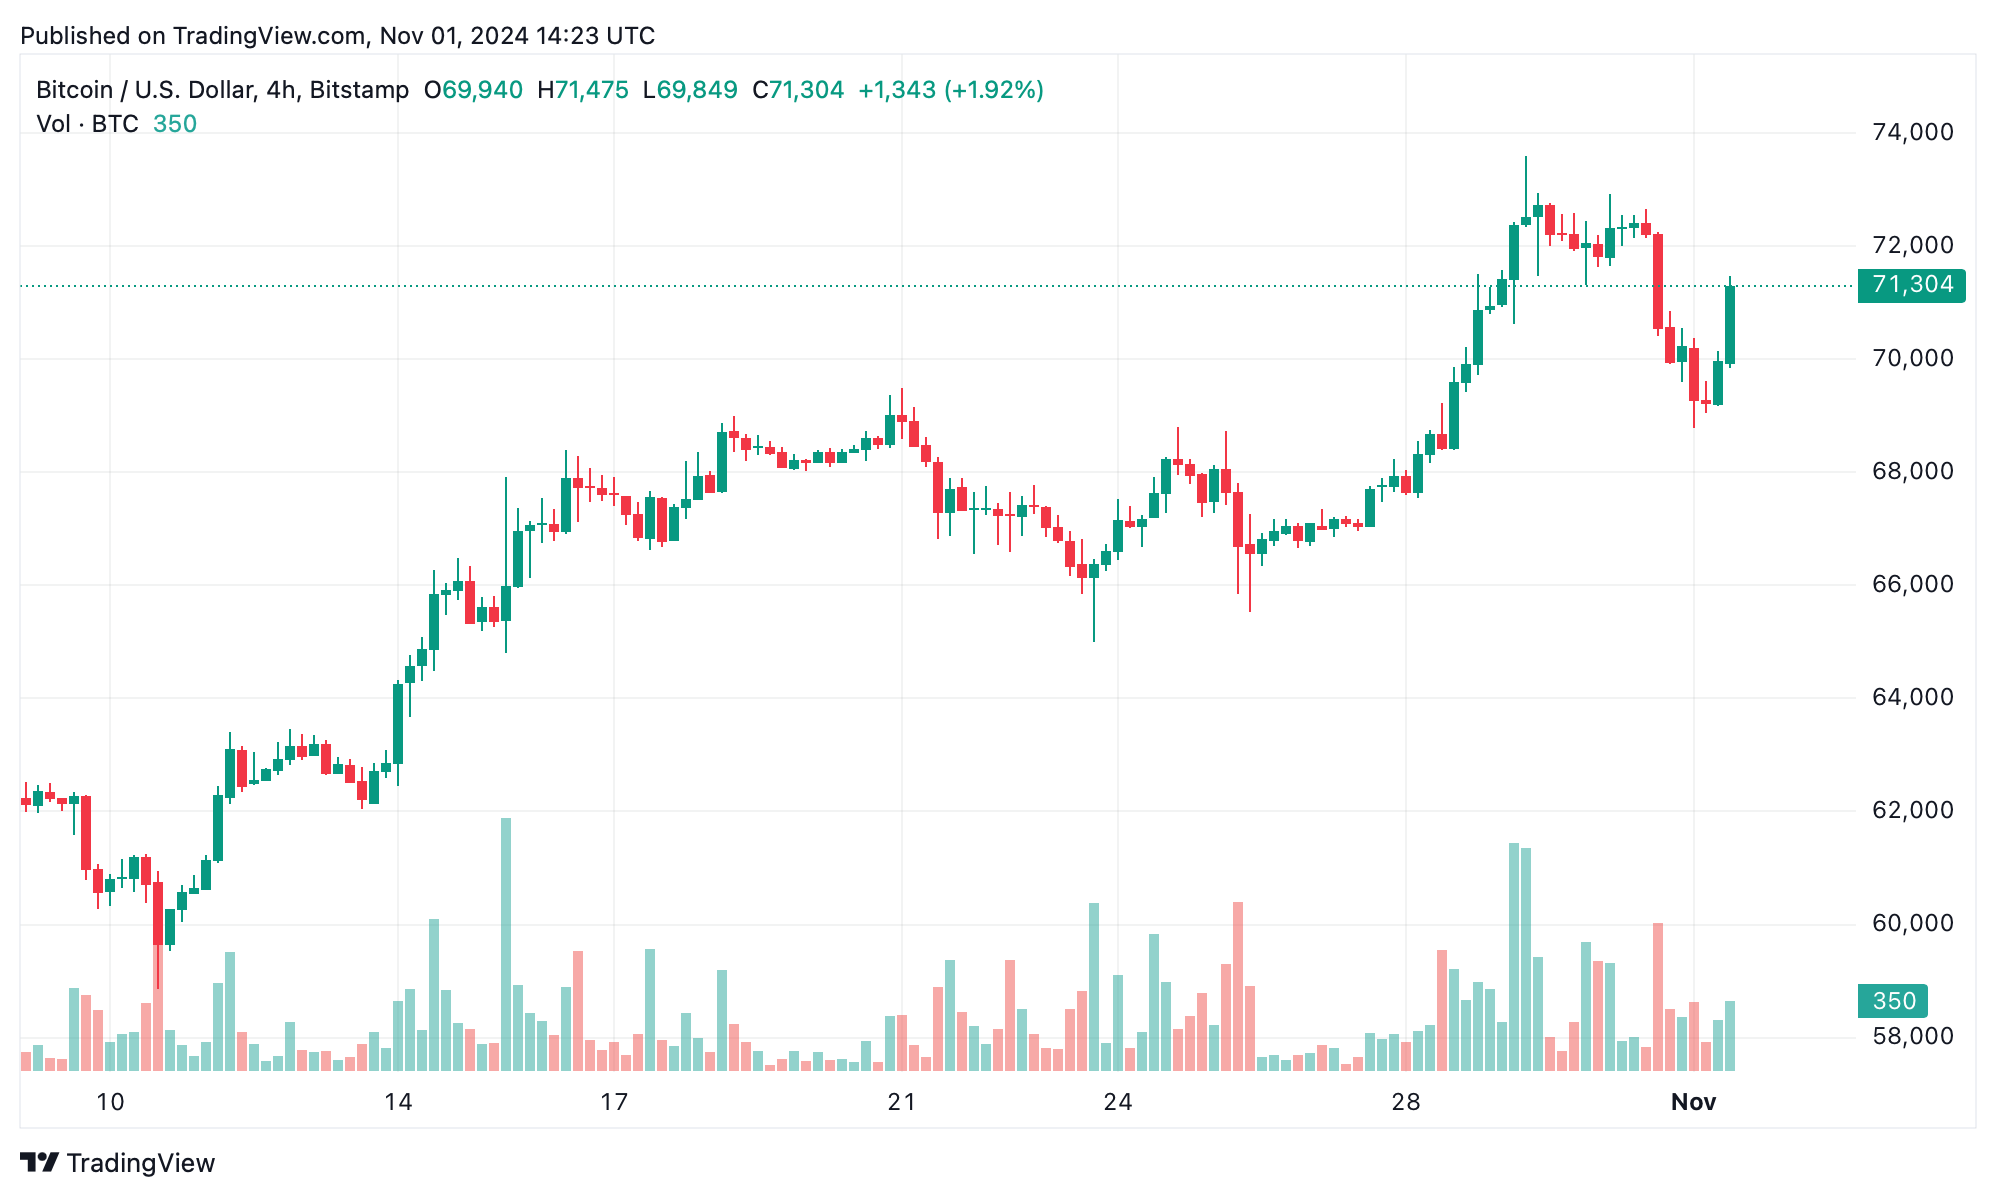
The four-hour BTC chart highlights a recent rebound from support near $69,500, where buyers stepped in following the initial pullback. Bitcoin’s attempt to regain higher ground saw it return close to $71,000, indicating underlying bullish sentiment. Volume analysis on both the four-hour and one-hour charts reveals an increase in buyer interest, although moderate volumes imply that a confirmed trend could require more robust trading activity at this level.

BTC/USD 4-hour chart on Nov. 1, 2024.
Short-term indicators are signaling positively for bitcoin. Oscillators, such as the moving average convergence divergence (MACD) and momentum, have turned bullish, hinting at the potential for continued gains. With bitcoin’s relative strength index (RSI) sitting at a balanced 63 and other metrics showing no signs of being overbought, BTC appears to have room for further upward movement, especially if it can surpass resistance between $71,500 and $72,000.
From a technical perspective, moving averages (MAs) are also supporting a bullish outlook. Bitcoin is trading above key moving averages, with the 10-day Exponential Moving Average (EMA) at $69,734 and the 20-day Simple Moving Average (SMA) at $68,203—both signaling a “buy.” These indicators suggest a sustained uptrend in the near term, potentially allowing BTC to retest recent highs if current support levels hold steady and buyer interest remains strong.
However, risks persist, particularly if bitcoin fails to consolidate above $69,000. A break below this level, accompanied by an increase in selling volume, could result in further declines toward $66,000. For the moment, though, BTC displays solid support levels and bullish technical indicators, positioning it to capitalize on recent gains if volume trends align with price action.
Bull Verdict:
Bitcoin’s resilience around key support levels and strong technical indicators point to further gains if buying momentum continues. A breakout past the $71,500-$72,000 resistance could allow BTC to retest recent highs, keeping the bulls in charge.
Bear Verdict:
Despite bitcoin’s positive technical signals, the upward momentum may falter if trading volumes do not pick up or if selling pressure intensifies. A drop below the $69,000 mark could bring BTC closer to $66,000, giving bears the upper hand.
免责声明:本文章仅代表作者个人观点,不代表本平台的立场和观点。本文章仅供信息分享,不构成对任何人的任何投资建议。用户与作者之间的任何争议,与本平台无关。如网页中刊载的文章或图片涉及侵权,请提供相关的权利证明和身份证明发送邮件到support@aicoin.com,本平台相关工作人员将会进行核查。


