On the 1-hour chart, bitcoin (BTC) has been on a steady climb after breaking free from a consolidation zone near $66,912. This upward movement gained momentum with a burst in trading volume. Now that activity has leveled off, the price has settled around $68,500. For short-term traders, a potential entry point could be spotted near $68,000, particularly if trading volume picks up again. Exiting around $68,742 or just shy of $69,000 aligns with nearby resistance levels.

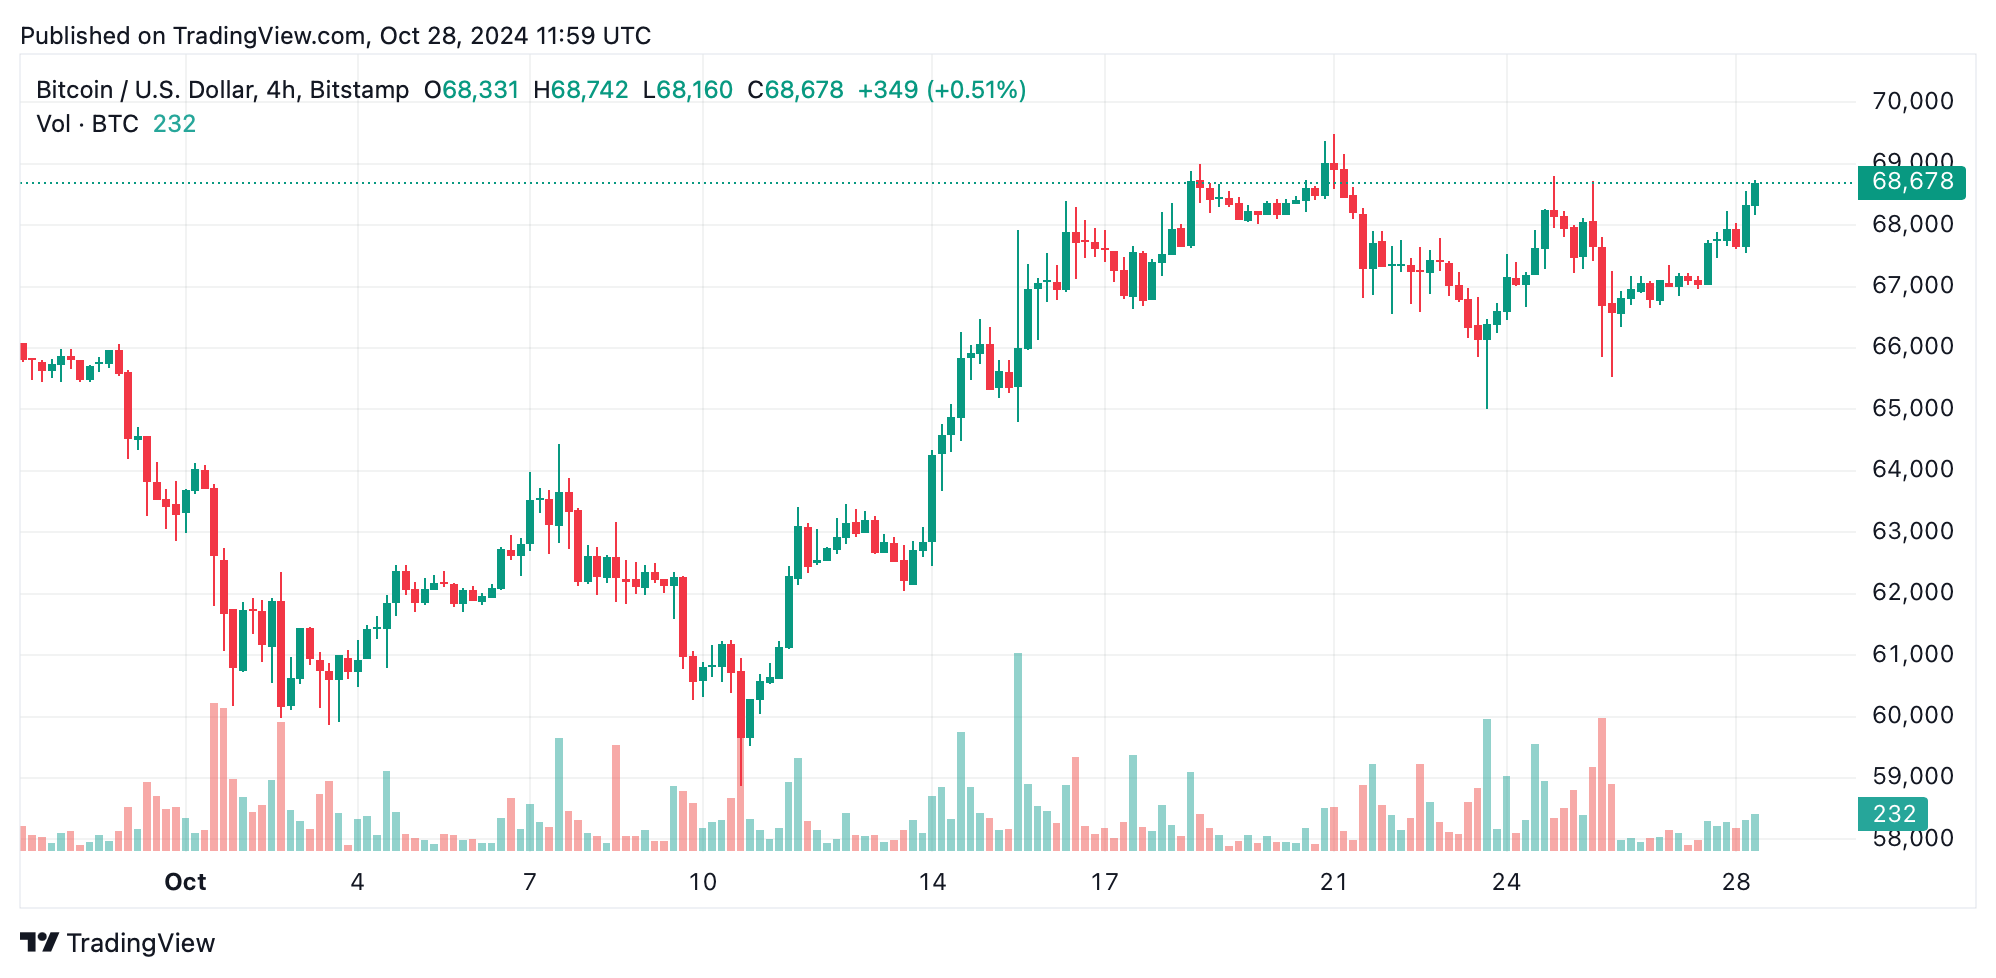
BTC/USD 4-hour chart.
The 4-hour chart paints a similar picture, reinforcing the bullish trend with a solid move up from the $65,000 low on Oct. 24. Although trading volume has calmed, the trend remains robust, showing higher highs and lows that signal ongoing strength. Traders may find entry opportunities if bitcoin pulls back toward the $67,500 to $68,000 range, with a sensible exit target between $69,000 and $69,500, where resistance is anticipated.

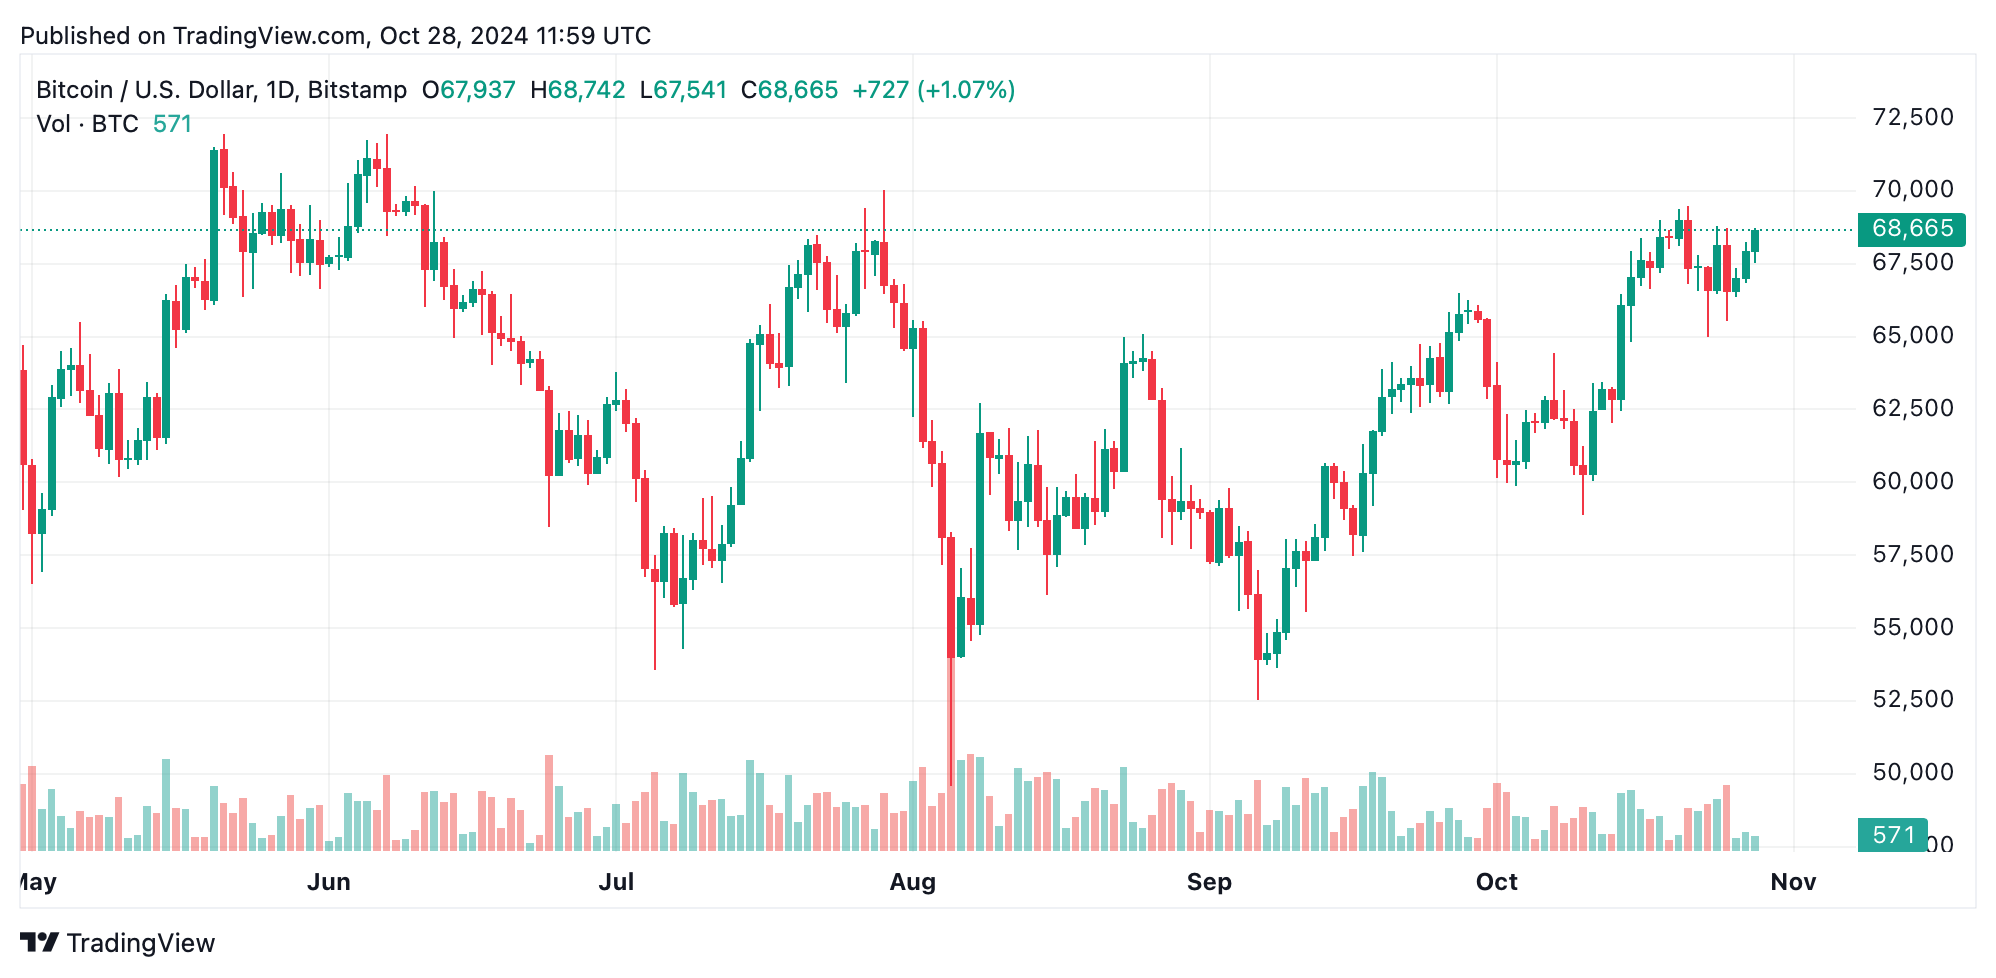
BTC/USD daily chart.
On the daily chart, bitcoin’s recent actions establish a long-term uptrend, setting a support base near $58,867 and testing resistance around $69,487. While volume has generally eased, the price holding above $66,000 suggests a strong consolidation zone. A boost in volume could see bitcoin challenging the $69,500 level and potentially opening a path to the $70,000-$72,000 range if the uptrend extends.
Oscillator readings show a mixed bag: the relative strength index (RSI) is neutral at 62, while the awesome oscillator leans toward bullish regions. Meanwhile, the moving average convergence divergence and momentum indicators hint at selling. However, the overall trend leans bullish across most moving averages, with exponential and simple moving averages from the 10-day to the 200-day mark strong bullish signals.
Bull Verdict:
Bitcoin’s strong uptrend, underpinned by consistent buy signals across multiple moving averages, suggests that continued consolidation near $68,500 may soon give way to a breakout above $69,500. If volume increases, this bullish momentum could extend toward $70,000 or higher, making now a promising entry point for bullish traders.
Bear Verdict:
Despite bitcoin’s recent upward moves, declining volume, and mixed oscillator signals indicate potential price exhaustion near $69,500. A failure to break through this resistance could prompt a pullback toward $66,000 or lower, signaling caution for traders with a bearish outlook.
免责声明:本文章仅代表作者个人观点,不代表本平台的立场和观点。本文章仅供信息分享,不构成对任何人的任何投资建议。用户与作者之间的任何争议,与本平台无关。如网页中刊载的文章或图片涉及侵权,请提供相关的权利证明和身份证明发送邮件到support@aicoin.com,本平台相关工作人员将会进行核查。


