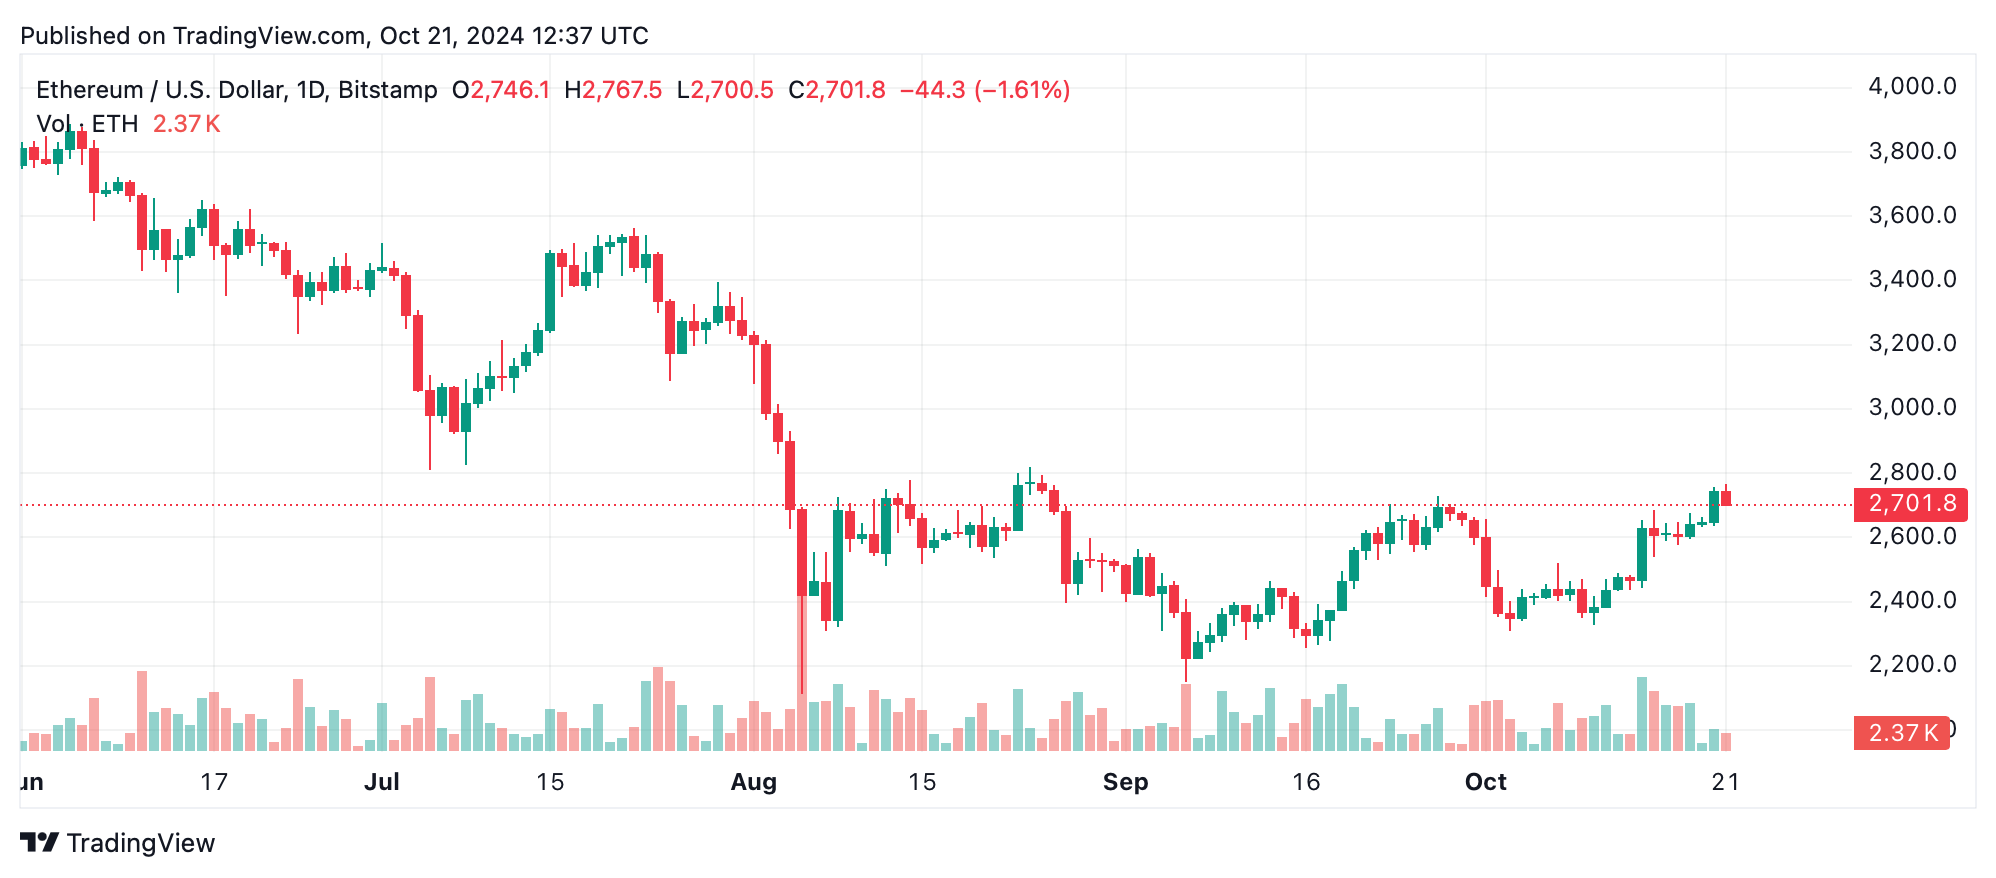
Zooming in on the daily chart, ethereum’s uptrend capped at $2,769 before seeing a minor pullback. With the relative strength index (RSI) sitting comfortably at 63.5, the market isn’t signaling overbought conditions, though the potential for selling pressure increases with any further climb. Despite a drop after the recent high, the 10-day and 20-day exponential moving averages (EMAs) remain above the current price, reflecting ongoing positive momentum.

ETH/USD daily chart.
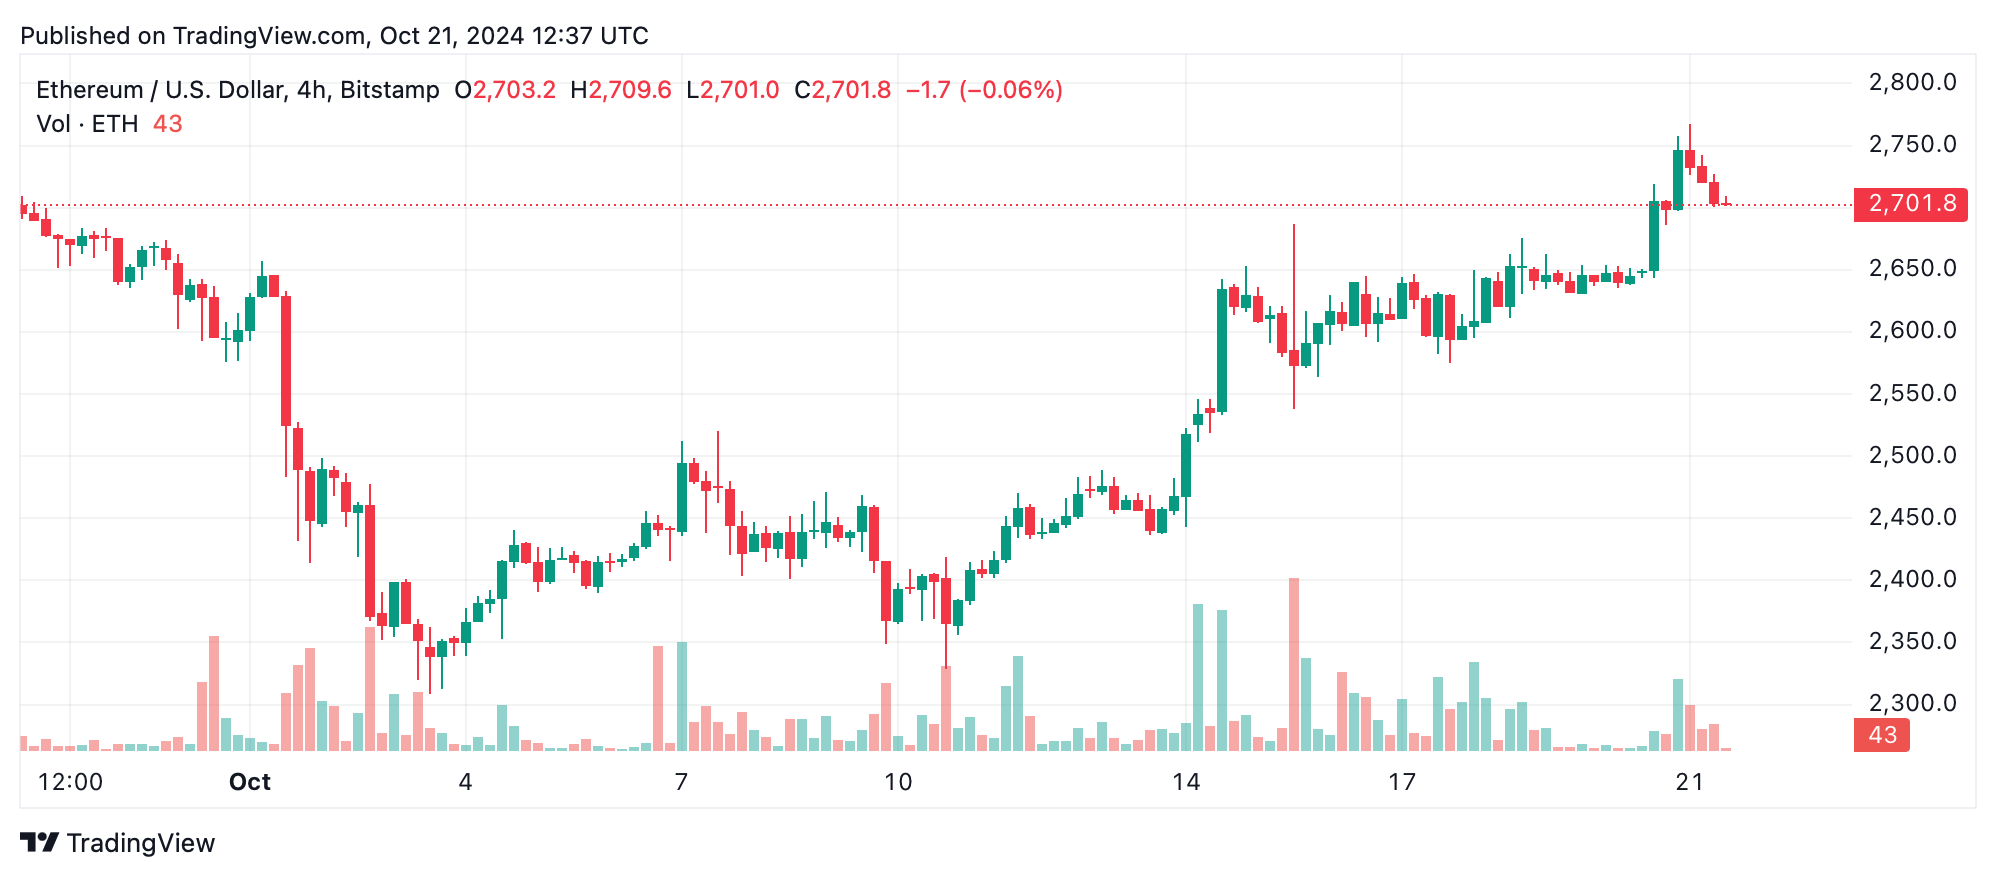
On the 4-hour chart, the price correction becomes clearer, with several downturns forming after a brisk rally. This coincides with the Stochastic oscillator’s high reading of 91, hinting at an overbought situation. Yet, ethereum is managing to find support in the $2,640-$2,700 range, aligning with the 30-period simple moving average (SMA) for this timeframe. The reduction in volume during this pullback suggests the correction lacks a strong selling force, at least for now.

ETH/USD 4-hour chart.
In the 1-hour chart, a short-term dip is evident as consecutive red candles dragged the price down to $2,700. A small upswing hints at a possible stabilization attempt, but the awesome oscillator remains neutral, indicating that further signs of a trend reversal are still needed. Meanwhile, short-term moving averages, like the 10-period exponential moving average (EMA), are providing support, reinforcing the consolidation pattern.
Key technical levels warrant close attention in the coming sessions. The $2,640-$2,700 range is a crucial support zone, backed by multiple moving averages. On the other side, the recent peak of $2,769 stands as a critical resistance point. A bullish breakout beyond this level could pave the way for additional gains, while a failure to maintain support might push the price down toward $2,550.
Bull Verdict:
The overall technical picture leans bullish, supported by multiple moving averages signaling buy conditions and the price holding key support zones. If ethereum maintains support near $2,640-$2,700 and gains momentum from oscillators turning positive, a breakout above $2,769 could pave the way for further gains.
Bear Verdict:
While the trend remains technically positive, caution is warranted. The high readings on certain oscillators and the loss of bullish momentum at recent highs hint at potential exhaustion. A decisive break below $2,635 per ether, paired with sell signals from oscillators, could usher in a deeper correction toward the $2,550 level or lower.
免责声明:本文章仅代表作者个人观点,不代表本平台的立场和观点。本文章仅供信息分享,不构成对任何人的任何投资建议。用户与作者之间的任何争议,与本平台无关。如网页中刊载的文章或图片涉及侵权,请提供相关的权利证明和身份证明发送邮件到support@aicoin.com,本平台相关工作人员将会进行核查。


