Significant activity has been displayed by Shiba Inu, as evidenced by a spike in large transaction volume of 4.1 trillion SHIB over the last day, almost reaching its seven-day high. Large transaction volumes often signal increased interest from larger holders, or whales, which may have a significant impact on how prices behave in the future.
Significant changes in on-chain volume typically draw attention because they may indicate that market participants are putting themselves in a position to take advantage of impending moves, whether they be bullish or bearish. Based on the available information, the price of SHIB has been exhibiting a symmetrical triangle pattern, a technical configuration that typically results in a breakout in either direction when volatility decreases.
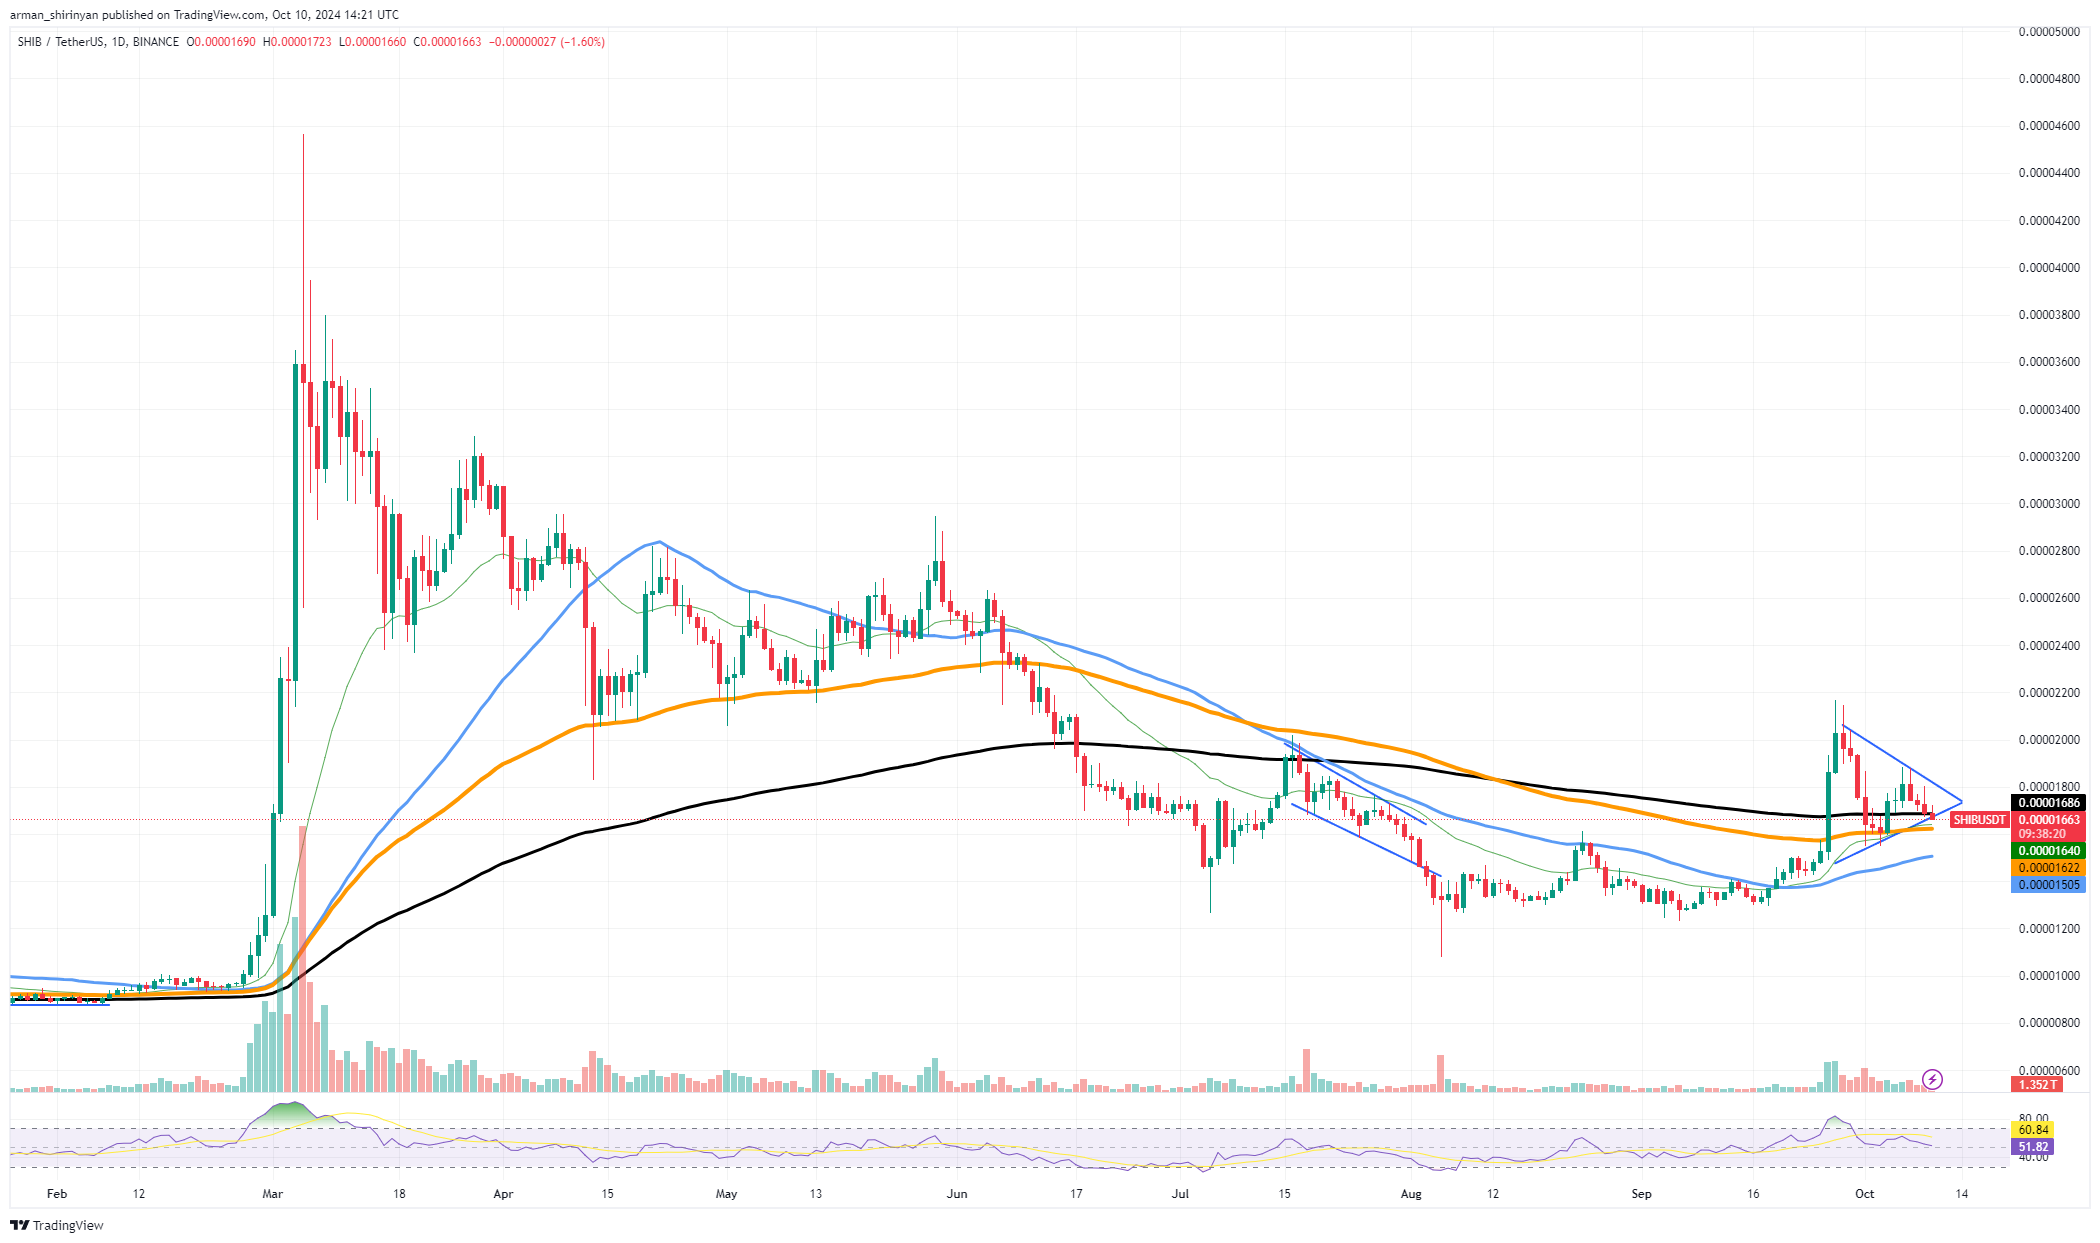
SHIB/USDT Chart by TradingView
This is in line with the usual behavior observed in these patterns, where volume tends to decrease as the asset gets closer to the triangle's tip. This points to a potential spike in price volatility that might occur shortly and cause a breakout. Although the rise in major transactions might be seen as a bullish indication, there is no inherent bias in the symmetrical triangle. SHIB could surpass significant resistance levels like the $0.000018 mark with an upside breakout, indicating a more robust bullish trend.
HOT Stories Bitcoin's (BTC) Suffering Continues, Solana (SOL) at Crucial Support Level: What's Next? Ethereum (ETH) to Dive Below $2,000?ETF Investors Prefer Crypto Over Bonds: Schwab SurveyRipple Hits Back at SEC with Cross-Appeal Bitcoin Reacts to Hotter-Than-Expected Inflation Data
A downside break, though, might force the price back to test the $0.000016 level or even lower. It is still crucial to keep a close eye on the technical pattern and the on-chain data given the general sentiment of the market and SHIB's relationship to Bitcoin and other significant assets. Large investors' continued accumulation might serve as fuel for a longer-term price rebound. On the other hand, SHIB may find it difficult to hold its current price if momentum wanes.
Bitcoin's struggle
Due to the ongoing uncertainty on the market, Bitcoin is still struggling in the $60,000 range. Despite a fleeting attempt at stabilization, Bitcoin has not been able to establish a solid foundation for a significant upward move. The main reason the digital asset is still in this zone and not clearly moving in the direction of a reversal appears to be the lack of conviction among bulls.
The price chart shows that Bitcoin is still fighting bearish pressure, as it has not been able to break through key resistance levels that would indicate a more robust recovery. Technical indicators of Bitcoin like the 50- and 200-day moving averages are currently in a range where further consolidation or further downward pressure on the price is possible.
Related

Thu, 10/10/2024 - 13:47Bitcoin (BTC) Korea Premium Might be Mitigated Soon, Here's Why
Vladislav Sopov
Bitcoin is stagnating, and one major reason for this is the lack of bullish momentum. Because bulls are not putting much effort into driving the price higher, BTC is susceptible to more declines. In addition, the asset appears to be circling around a neutral zone according to the Relative Strength Index (RSI), which indicates market indecision.
Sellers are attempting to drive the price lower in an effort to capitalize on the market's indecision, which is adding to the bearish pressure. If current circumstances continue, Bitcoin may test support levels at $58,000 to $59,000 - if it does not receive a significant push from bulls.
Solana has chance
Following a challenging week of underwhelming performance, Solana is presently perched on a crucial ascending trendline support. Over the past few weeks, the $138 range has been the cryptocurrency's key support level. Traders are keeping a close eye on Solana as it tests this support in hopes of a possible rebound.
Although there has been growing bearish pressure on the asset over the past week, Solana may be due for a rebound, according to the ascending trendline support. Such supports for trendlines have historically been important in reversing negative trends and creating the foundation for upward movement.
Related

Thu, 10/10/2024 - 12:13Dogecoin (DOGE) 70% Surge Incoming? Important On-Chain Data
Arman Shirinyan
If SOL is able to maintain this level, a rebound may start, which would mean an attempt to breach higher resistance levels. The $150 zone and the $145 mark,which correspond with recent resistances, are important levels to keep an eye on. A break above these levels of resistance may herald a more substantial recovery and provide the impetus for a longer-lasting upward trend.
Subsequent selling may ensue if the present support level is broken. The next support is located at approximately $130. As of right now, the Relative Strength Index (RSI) suggests that Solana is not in an oversold area, which suggests that there may be room for further upward momentum. The RSI, however, is almost at neutral, indicating that the market is still uncertain.
免责声明:本文章仅代表作者个人观点,不代表本平台的立场和观点。本文章仅供信息分享,不构成对任何人的任何投资建议。用户与作者之间的任何争议,与本平台无关。如网页中刊载的文章或图片涉及侵权,请提供相关的权利证明和身份证明发送邮件到support@aicoin.com,本平台相关工作人员将会进行核查。


