The 1-hour chart shows ethereum bouncing from the $2,412 support level to a short-term high of $2,513 before pulling back. With low trading volume and sideways price movement, the market seems uncertain. A break above $2,513 could open the door for a bullish move, but if the price drops below $2,450, it may signal a reversal. Traders should keep a close eye on these key levels.

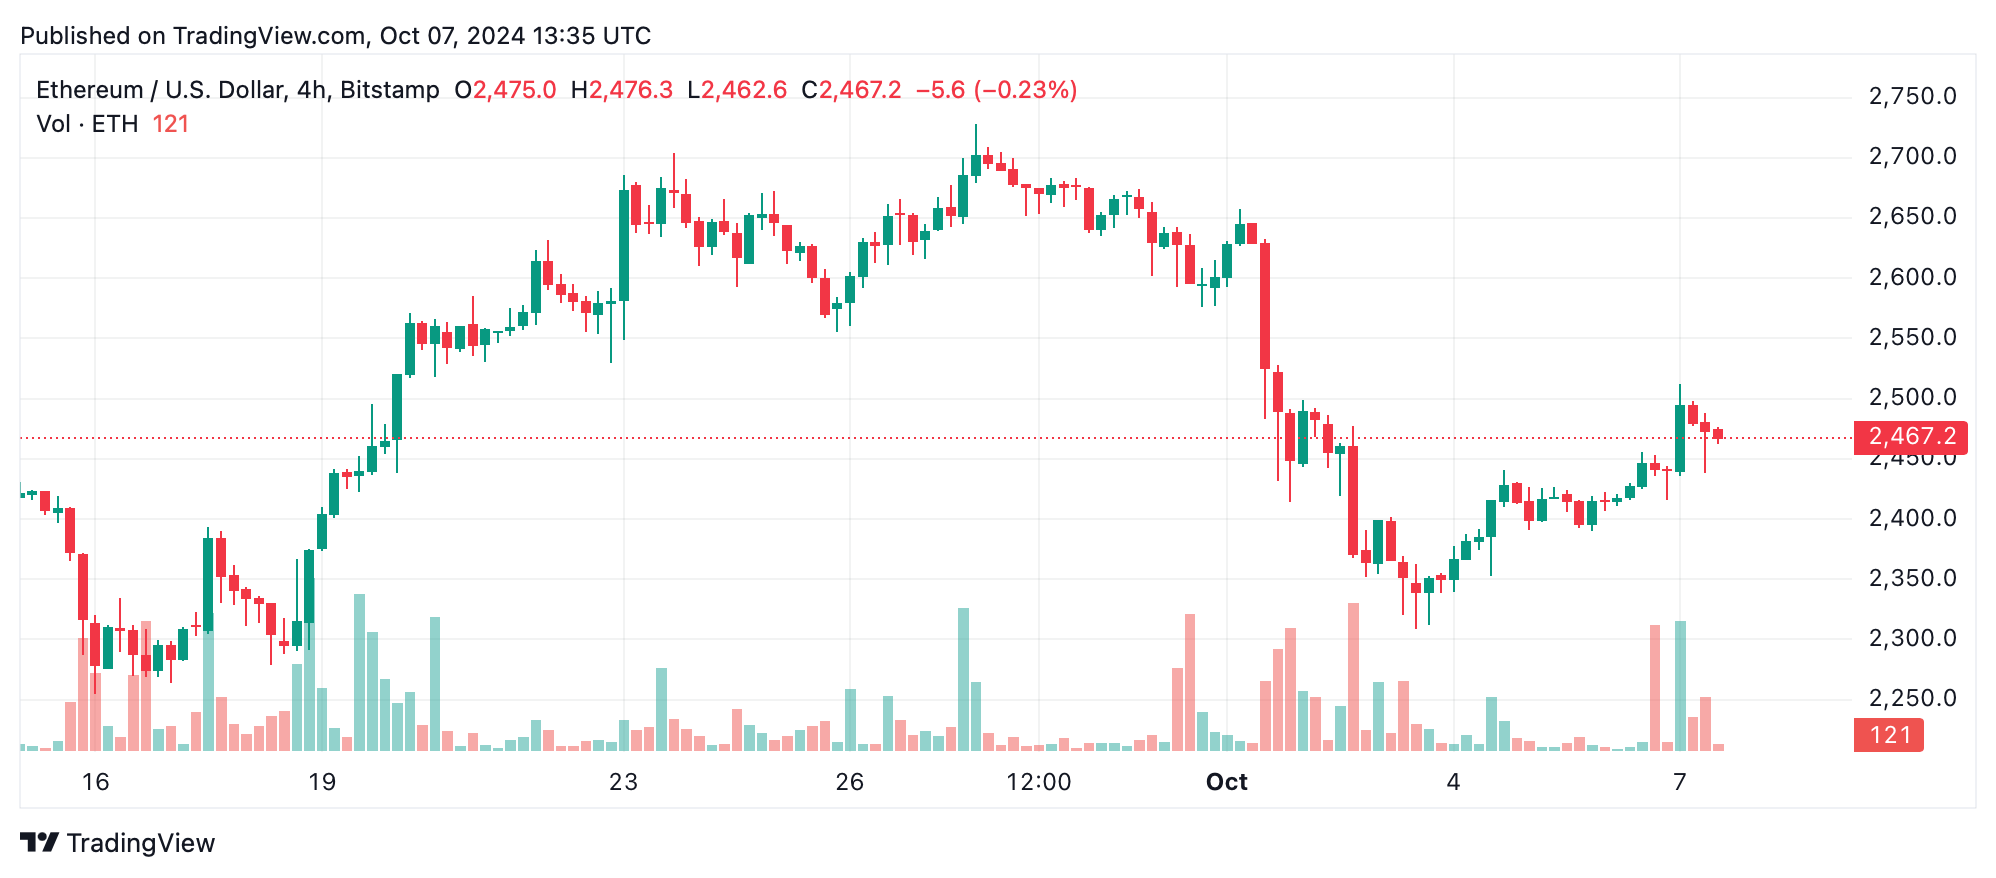
On the 4-hour chart, ethereum recovered from a recent low of $2,309 to $2,513 before easing back to around $2,467. While higher lows have formed, the lower volume during the pullback hints at a possible consolidation. If ethereum breaks above $2,513 with strong volume, it could signal more upside potential, though the $2,450 support level remains crucial.

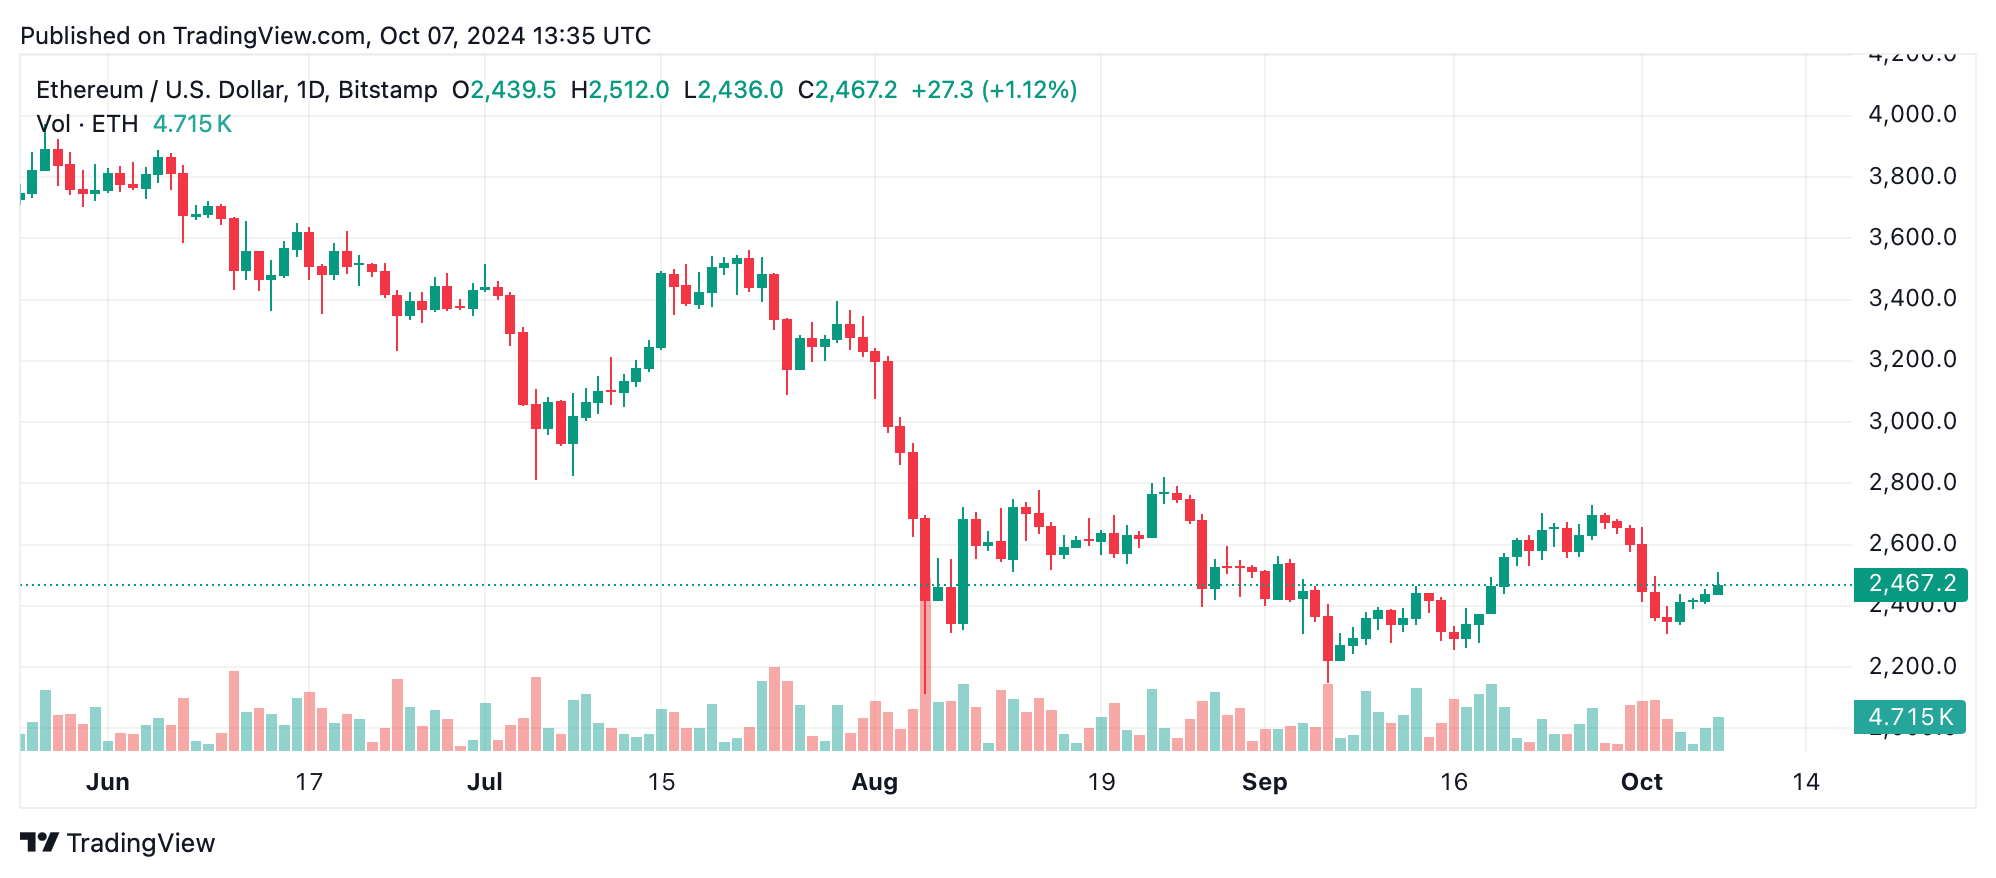
The daily chart analysis shows ethereum consolidating between $2,350 and $2,500 following a sharp correction from $2,729. The price is hovering near support, and a break above $2,550 could spark bullish momentum. However, failing to hold current levels may lead to further downside pressure.
Indicators like the relative strength index (47.8) and the Stochastic (31.5) remain neutral, while major moving averages, including the 50-day and 200-day, point to a bearish trend. The exponential moving average (10) and simple moving average (10) are both signaling sell, adding to the cautious mood in the market.
Bull Verdict:
Should ethereum manage to break through the $2,513 resistance with strong volume, it could be the start of a bullish continuation. Traders might see opportunities for gains in the $2,550 to $2,600 range, with higher targets if momentum builds. Entry points around the $2,450 to $2,470 support zone may present attractive setups for bullish positions.
Bear Verdict:
On the flip side, if ethereum fails to hold the $2,450 support level and selling pressure grows, a further decline could be on the horizon. In this case, ethereum might test lower support around $2,400 or even head toward $2,350. Current moving averages and momentum indicators lean toward a bearish trend, urging caution for buyers in the short term.
Register your email here to get weekly price analysis updates sent to your inbox:
免责声明:本文章仅代表作者个人观点,不代表本平台的立场和观点。本文章仅供信息分享,不构成对任何人的任何投资建议。用户与作者之间的任何争议,与本平台无关。如网页中刊载的文章或图片涉及侵权,请提供相关的权利证明和身份证明发送邮件到support@aicoin.com,本平台相关工作人员将会进行核查。


