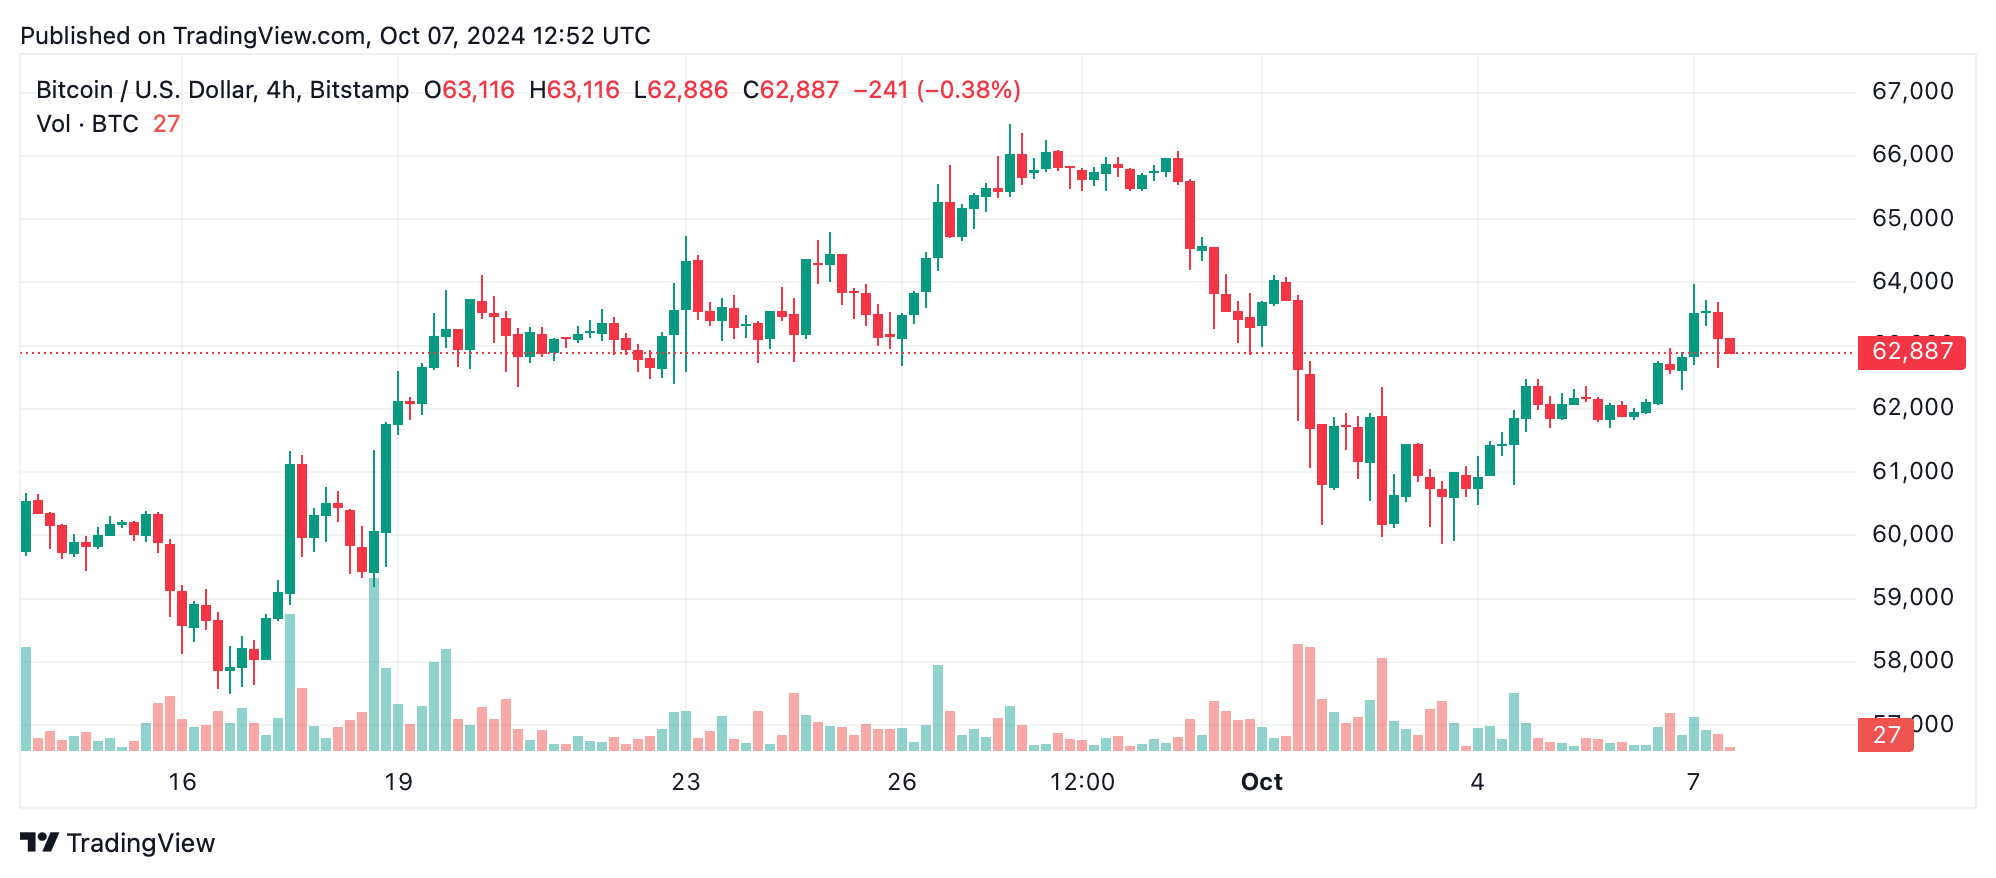
On the 1-hour chart, bitcoin (BTC) rallied from $61,816 to a high of $63,975 but is now consolidating below $63,500. Moving averages remain bullish, with the 10-period exponential moving average (EMA) at $62,575 and the 10-period simple moving average (SMA) at $62,700 signaling upward momentum. However, oscillators such as the relative strength index (RSI) at 55 show neutrality, indicating neither overbought nor oversold conditions.

The 4-hour chart reflects a broader uptrend that began at $59,860 on Oct. 3, peaking at $63,975. The EMA and SMA indicators continue to support bullish sentiment, with the 50-period EMA at $61,502 and 50-period SMA at $60,686, both pointing to buying conditions. However, momentum oscillators like the moving average convergence divergence (MACD) level at 516 and the awesome oscillator show bearish divergence, suggesting a possible slowdown.

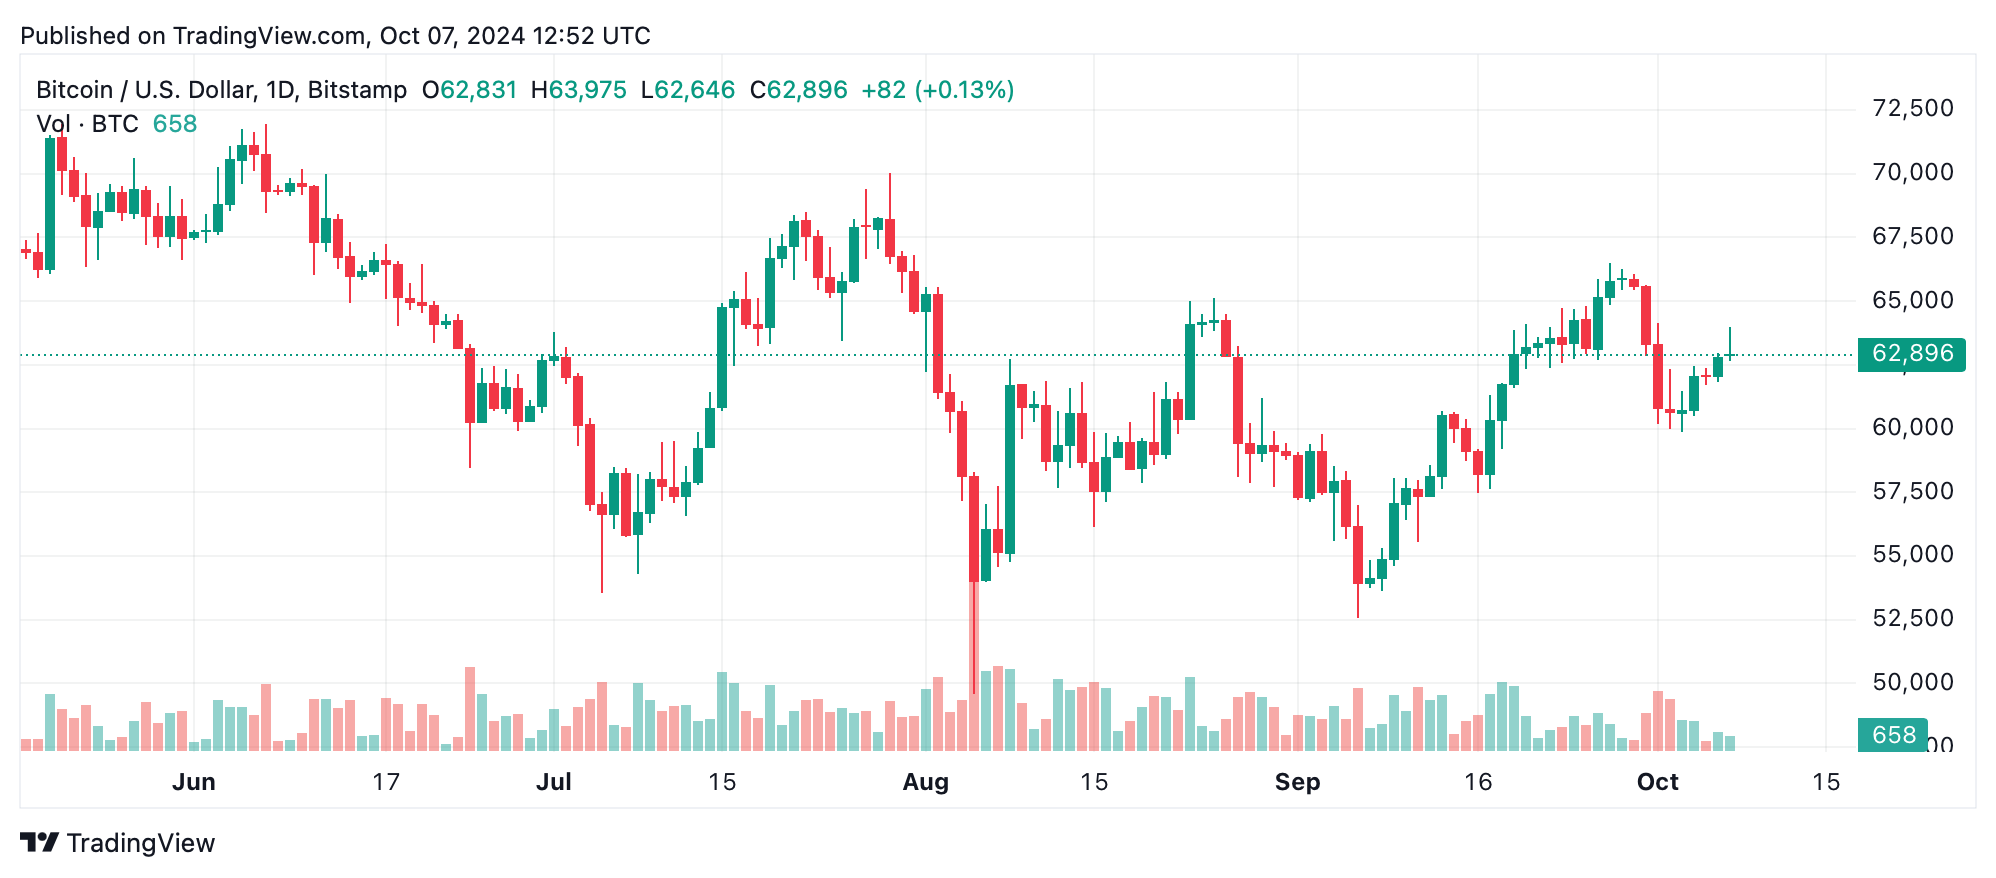
The daily chart highlights bitcoin’s longer-term uptrend, which began with a bounce from $52,546 in early October. The 100-period EMA at $61,524 and SMA at $61,097 reinforce bullish conditions, but the 200-period SMA at $63,549 signals resistance ahead. Oscillators are mixed, with the commodity channel index (CCI) at 4 remaining neutral and the momentum indicator at -2,702 suggesting a loss in bullish strength. A pullback to the $60,500-$61,500 zone could provide a better entry.
Bull Verdict:
Bitcoin’s overall uptrend remains intact, supported by bullish signals from moving averages across multiple timeframes. The 1-hour and 4-hour charts suggest strong momentum, with key support holding at $63,000 and potential for further upside toward $64,000-$66,000. As long as buyers maintain control and volume picks up, a breakout above recent highs could drive bitcoin to new resistance levels. The long-term trend still favors the bulls.
Bear Verdict:
Despite the upward momentum, oscillators such as the MACD and momentum indicators are showing signs of weakness, suggesting a potential slowdown or short-term correction. With key resistance near $63,549 on the daily chart and diminishing volume, the risk of a pullback to $61,000 or lower is rising. Bears may take advantage of these signals, especially if bitcoin fails to break through current resistance levels.
Register your email here to get weekly price analysis updates sent to your inbox:
免责声明:本文章仅代表作者个人观点,不代表本平台的立场和观点。本文章仅供信息分享,不构成对任何人的任何投资建议。用户与作者之间的任何争议,与本平台无关。如网页中刊载的文章或图片涉及侵权,请提供相关的权利证明和身份证明发送邮件到support@aicoin.com,本平台相关工作人员将会进行核查。


