Bull return or false breakthrough?
By: 0xFacai
After BTC broke through $70,000 on July 29, it started a downward trend, reaching $49,000 on August 5, rebounding to $65,000, and then continuing to fall. After forming a double bottom structure near $53,000 on September 6, the Federal Reserve confirmed a rate cut on September 19, and BTC rose accordingly. On September 26, during the U.S. session, with the strong rise of U.S. stock indices, BTC has broken through the previous high of $65,000, disrupting the structure of lower lows and higher highs.
Is this a real breakdown of the downward structure or a false breakthrough of the previous high point? How should we understand it from a technical perspective, and how should we judge the future market based on the depth of the contract/spot order book and liquidation map? Can the macro environment support the second half of the bull market, and how will the market price the rate cut in the future? Different trading bloggers have their own opinions.

Technical analysis flow
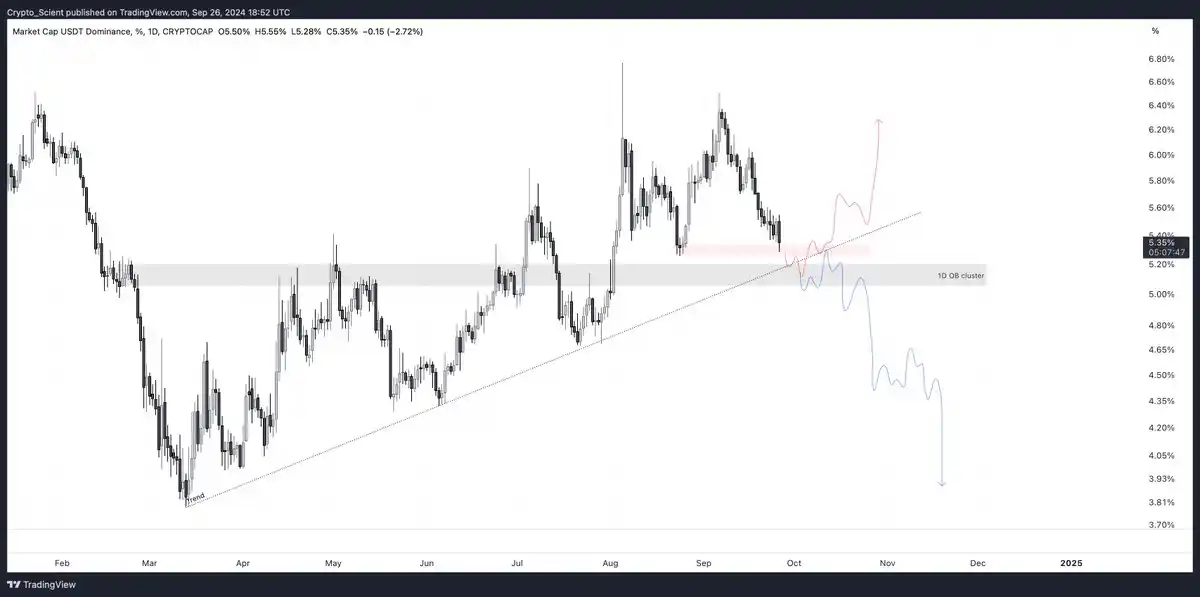
@Crypto_Scient believes that the trend of USDT.D (USDT Dominance) can be used to speculate on the future development of BTC: If USDT.D follows the red path, seizes liquidity in the daily liquidity accumulation area, and then rebounds after testing the uptrend line, BTC will show a bearish trend; if USDT.D follows the blue path, breaks the trend, and reverses the trend, then BTC will enter a bullish trend and reach a new historical high. Now we need to wait and observe the exact signal from USDT.D before deciding on the subsequent trading strategy.
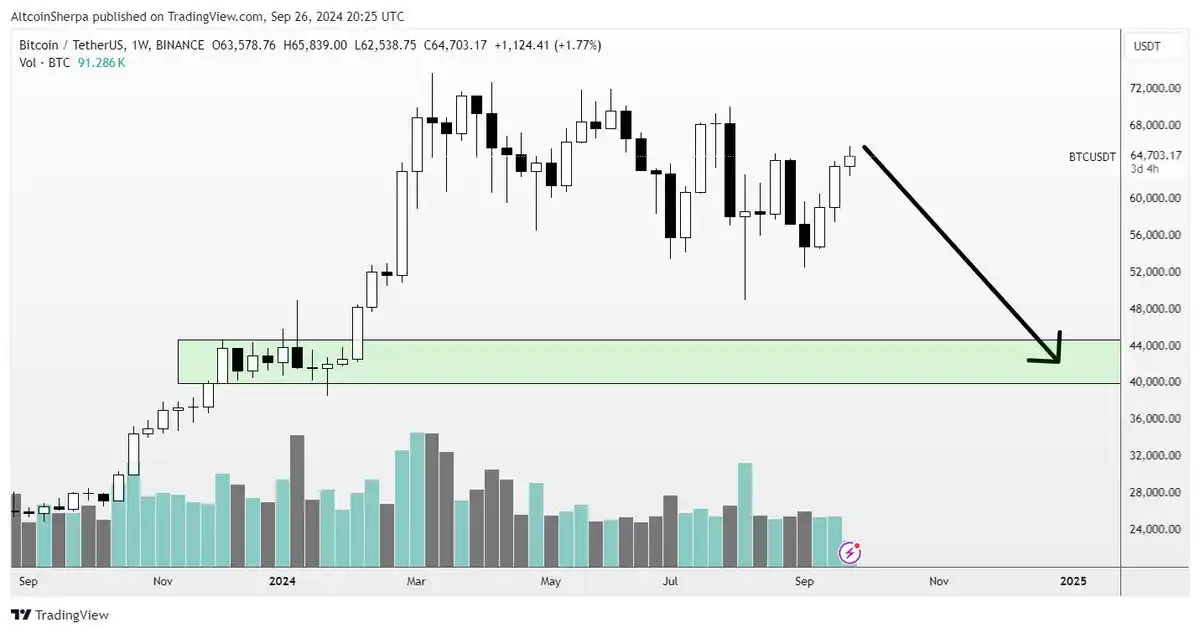
@AltcoinSherpa believes that this is a bearish price trend and requires obtaining liquidity for BTC at $40,000.
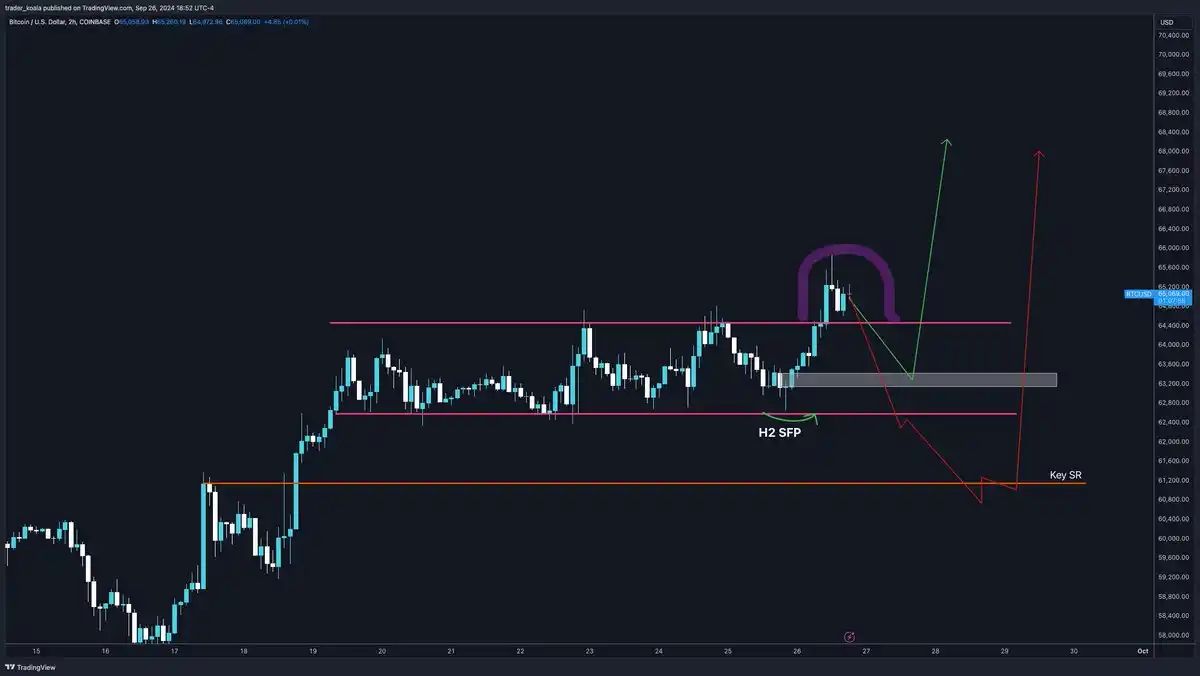
@trader_koala believes that observation is needed here and has prepared two trading strategies: if the support level is effectively tested, buy near the order block; if the support level fails, then buy in a deeper decline. If a deeper decline occurs with the daily candlestick closing below approximately $59,000, the target for the rise is $68,000 to $70,000.
@CryptosLaowai believes that BTC has captured the liquidity at $65,000, and a sharp decline may occur here. The form of the upward trend that BTC has started since $53,000 is an expanding wedge. As the wedge nears its end, a direction will be chosen, most likely downwards, with a target to retest the support at $57,000 to $59,000, and then capture the liquidity of the rising trend line at around $68,000 before falling.
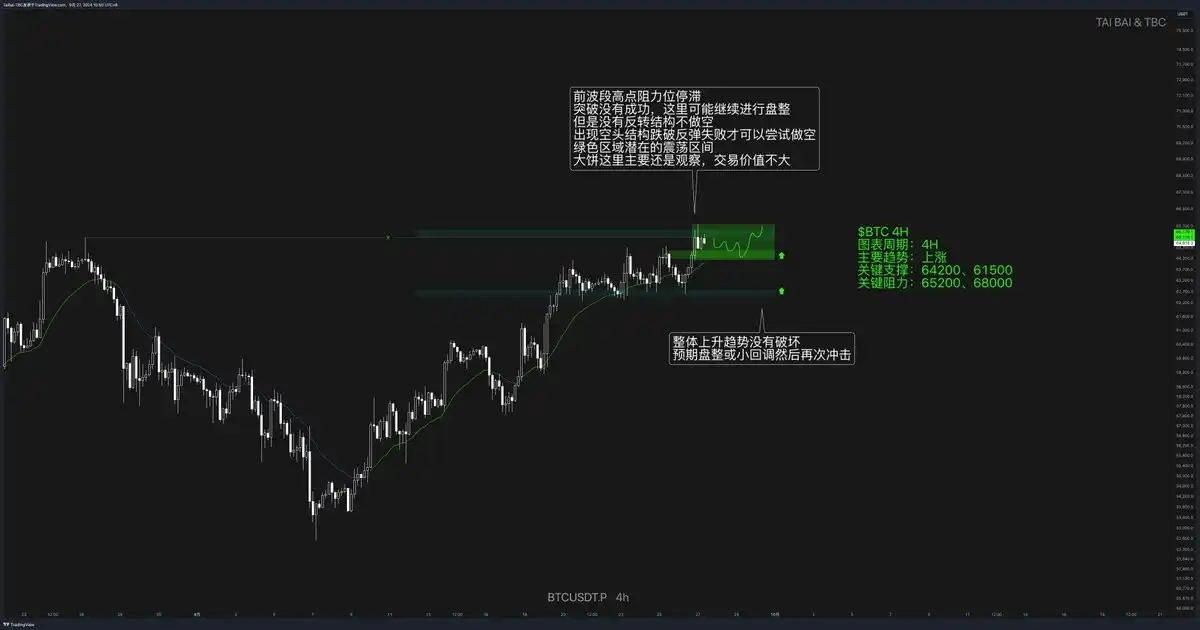
@0xtaibai believes that BTC stalled at the resistance level of the previous wave high on the 4-hour timeframe, the breakthrough was not successful, and there may be consolidation. However, there is no reversal structure of the decline. If a bearish structure appears and the rebound fails, then a short position will be attempted. The potential oscillation range in the green area is the main focus. The overall upward trend has not been disrupted, and a consolidation or minor pullback is expected before continuing upwards.
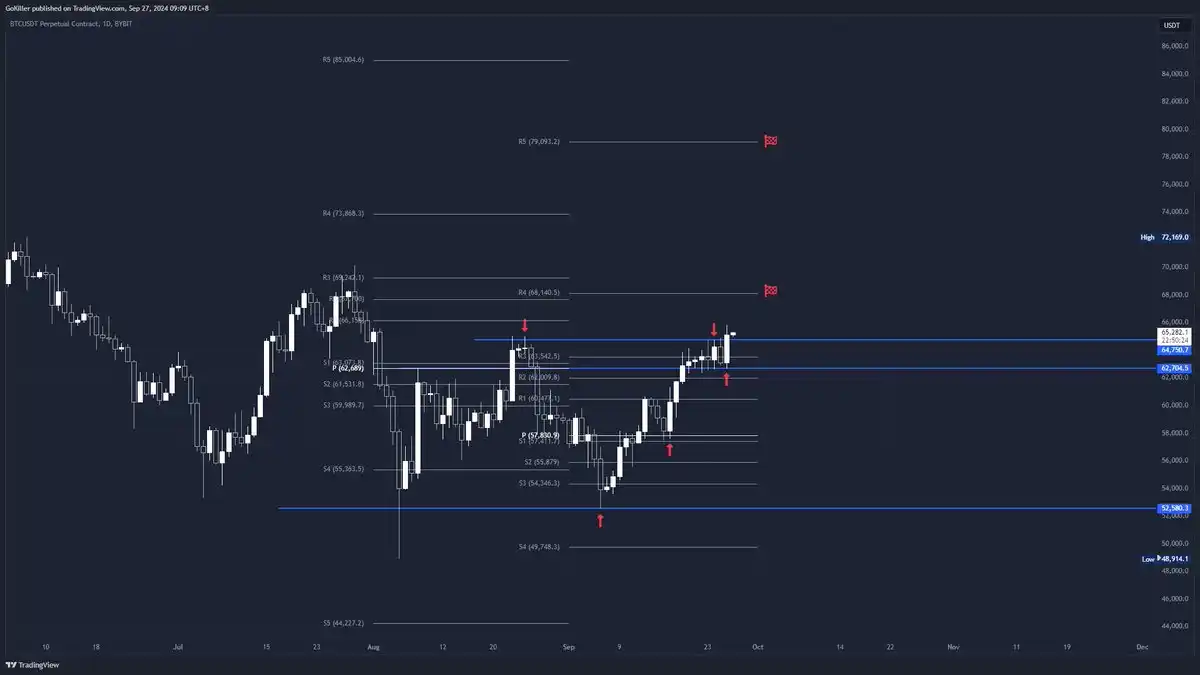
@goukiller believes that in the weekly timeframe game, the defense of Pivot Point's R3 has been successful, indicating that it is still in an uptrend. The subsequent upward targets are R4 at $68,100 and R5 at $79,000.
Data analysis flow
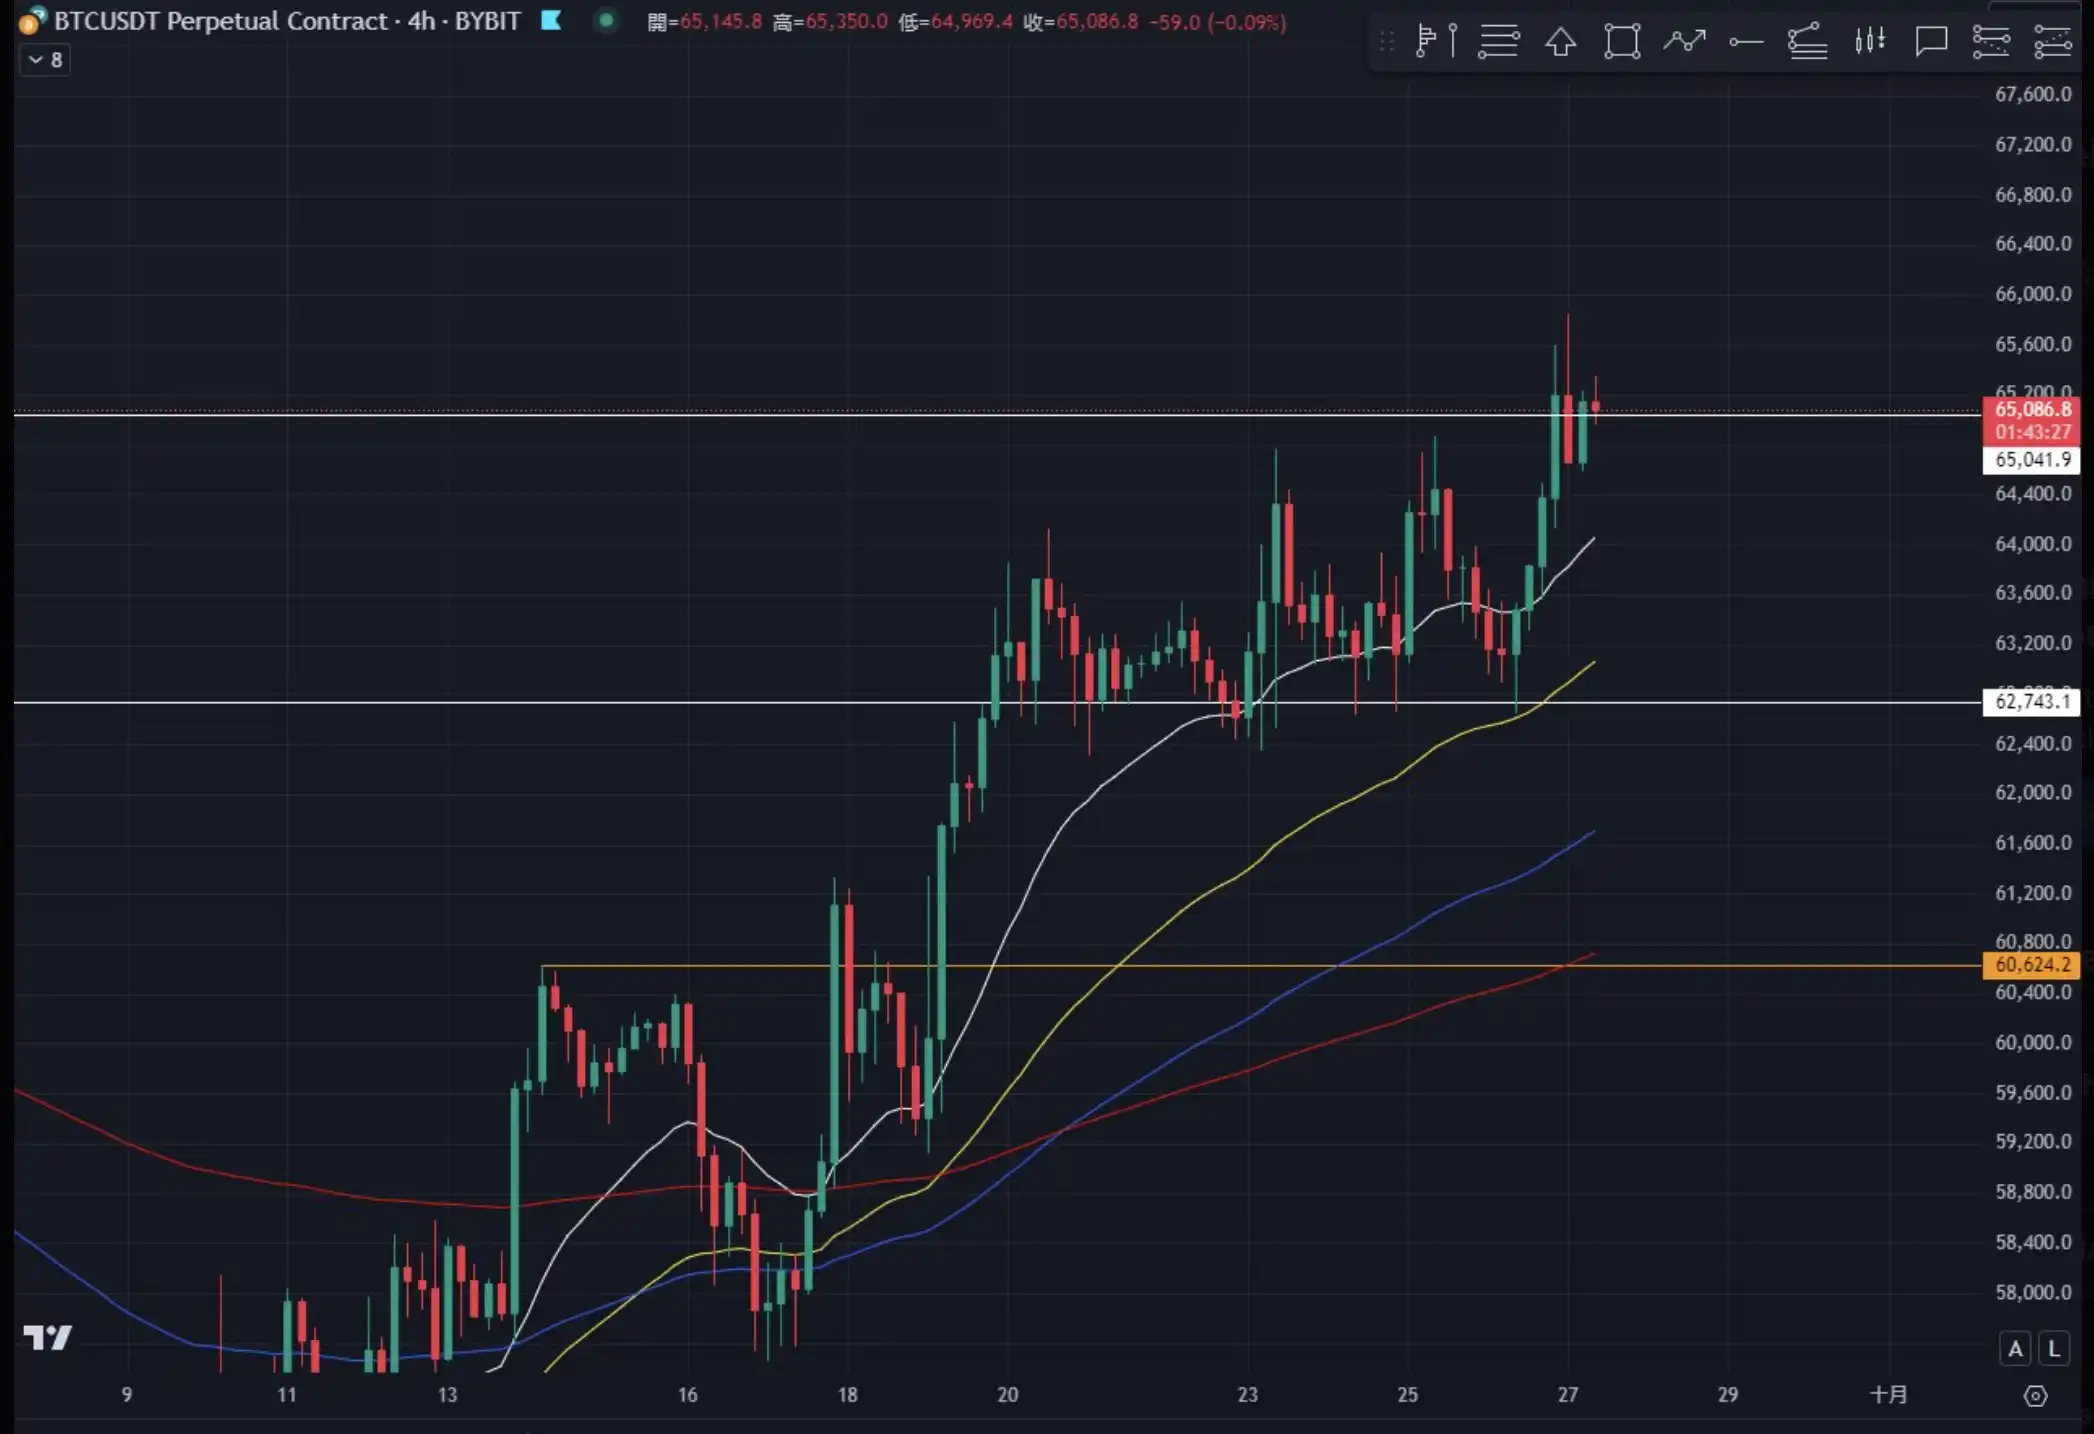
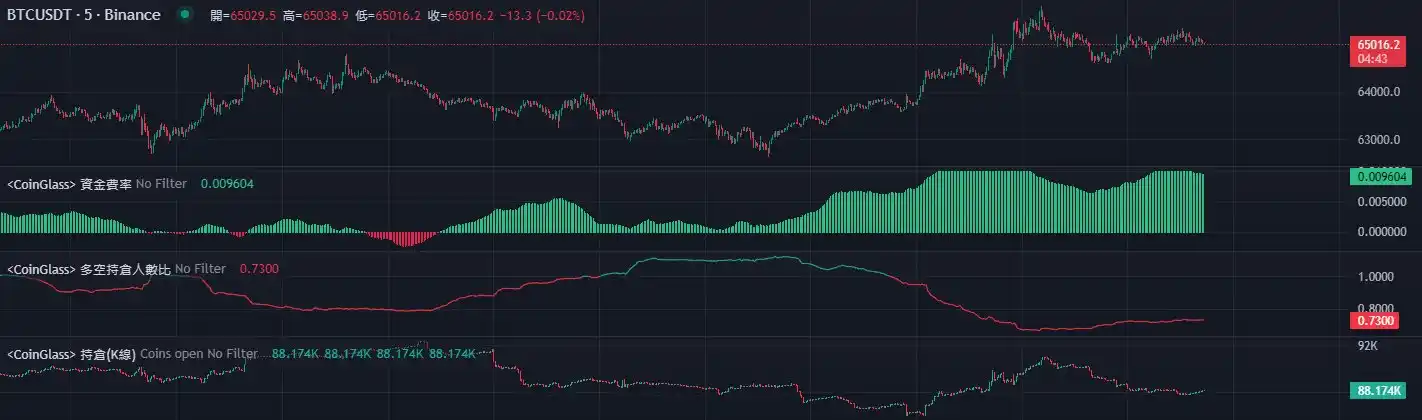
@xiaomo924 believes that BTC has broken through the previous high, but the bullish momentum has not continued. If there is no continued buying, there will be a need for consolidation and pullback in the short term. It is necessary to pay attention to the strength of the retest of the 4-hour EMA20 and 50, and whether support is found there.
In the rising contract order book, the depth difference is greater than that of the spot order book, indicating that the contract buying volume is greater than the spot. If there is no more spot buying volume in the future, there will be a risk of a false breakthrough.
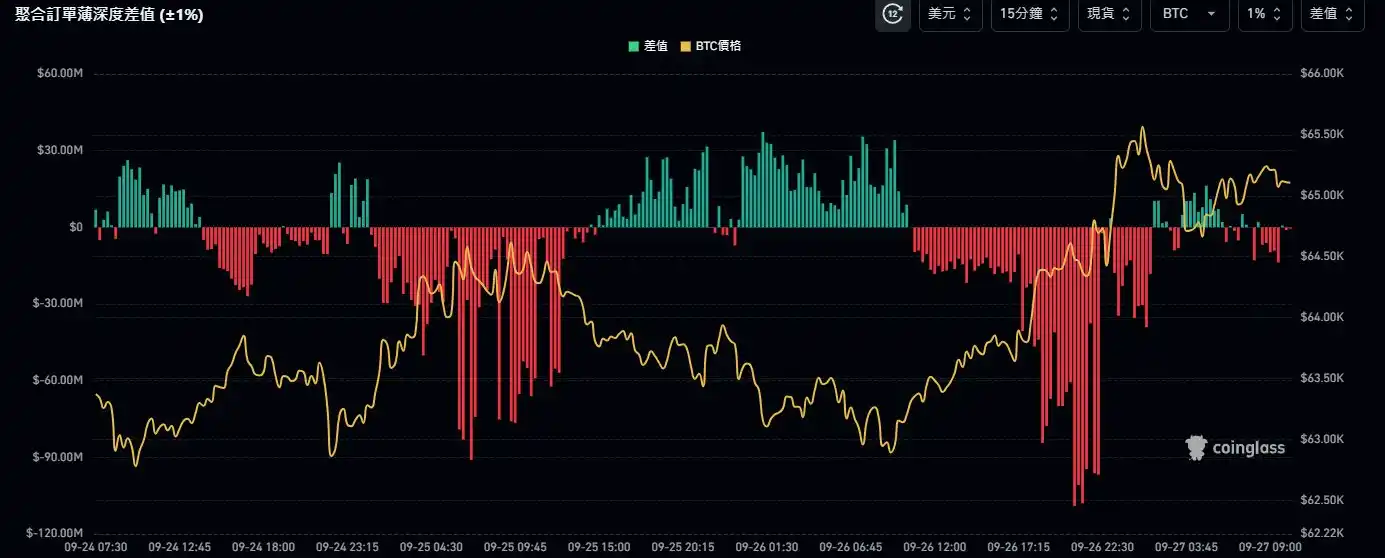
The long/short ratio is currently at a low level, and the whales are in a position to close longs. It is necessary to pay attention to the pullback after short-term demand is released.
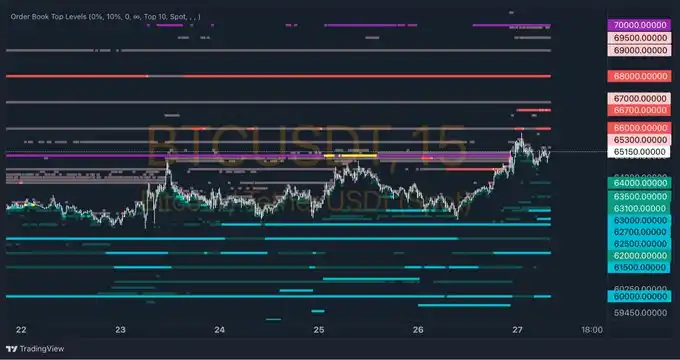
@Xbt886 found from the order book that there are a large number of sell orders from $66,000 to $66,700 and a large number of buy orders from $62,000 to $63,000. Overall, it is bullish, and a pullback can be expected. However, it is also possible that it is just an order to attract, and it will not actually be executed. Do not blindly short towards $62,000 to $63,000. It seems that those who have already shorted after obtaining bearish liquidity have been trapped. It is still best to observe conservatively in the future.
Macro analysis flow
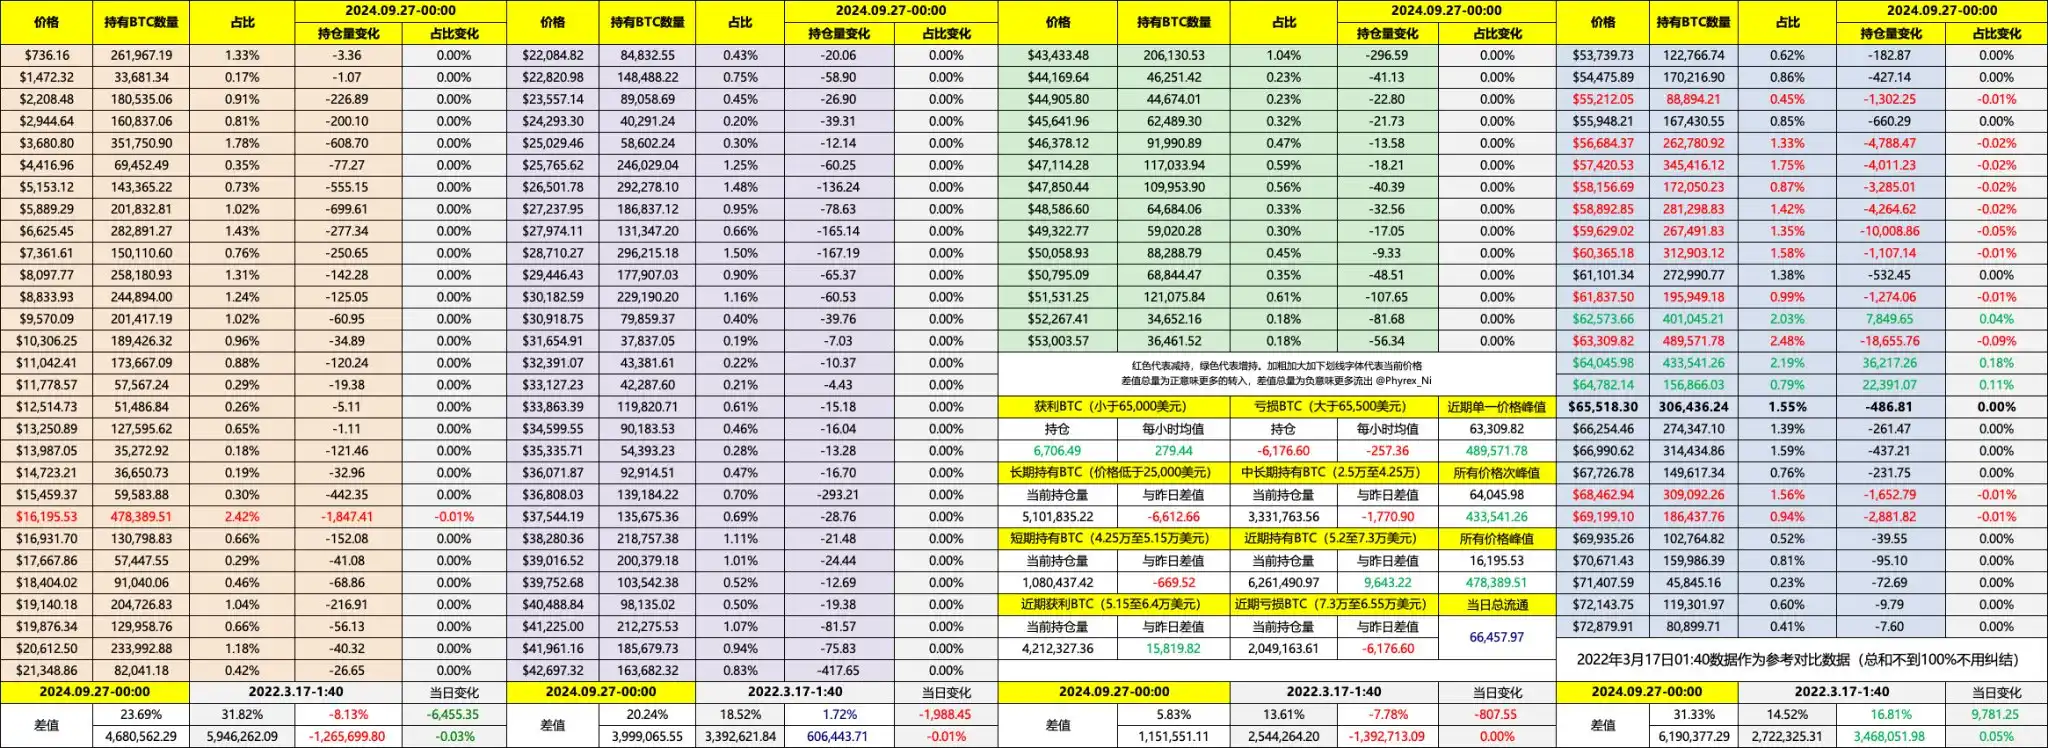
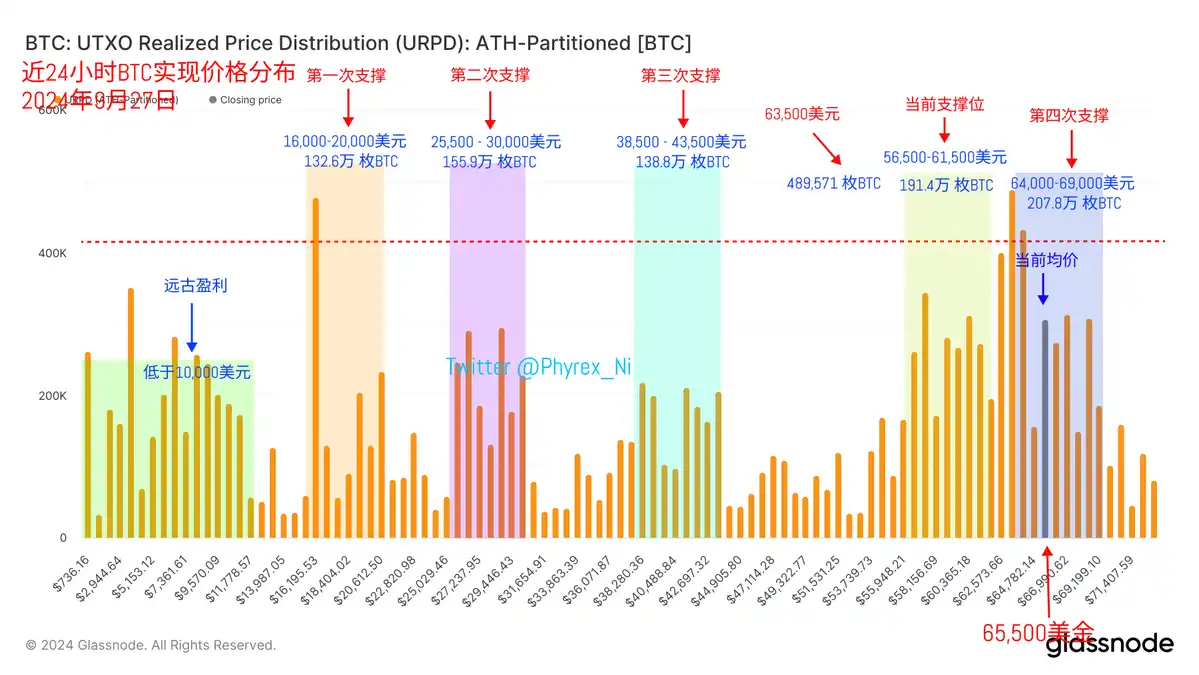
@Phyrex_Ni believes that it is still uncertain whether the bull will return. The turnover on the chain for BTC is relatively low, and the most likely reason for the rise is still low liquidity. Yellen's speech reveals two key points in the macro environment: one is that the current U.S. economy is still good, with the possibility of a soft landing, and the other is that the labor market is currently stable but still fragile, requiring the Federal Reserve to continue cutting interest rates to prevent the labor market from collapsing. In the data for BTC purchases, it seems that the user's sentiment has been somewhat mobilized, and there is a noticeable increase in purchasing power, even significant increases in ETF purchases. A large number of investors have begun to cautiously sell, and even short-term profit seekers are starting to expect higher prices.
Early holders of BTC are still indifferent, and the chip-intensive area between $62,500 and $64,000 is still increasing, now exceeding 1.324 million coins. The support between $64,000 and $69,000 is still in very good condition, and the current price changes still depend on whether short-term holders are willing to release their chips.
免责声明:本文章仅代表作者个人观点,不代表本平台的立场和观点。本文章仅供信息分享,不构成对任何人的任何投资建议。用户与作者之间的任何争议,与本平台无关。如网页中刊载的文章或图片涉及侵权,请提供相关的权利证明和身份证明发送邮件到support@aicoin.com,本平台相关工作人员将会进行核查。


