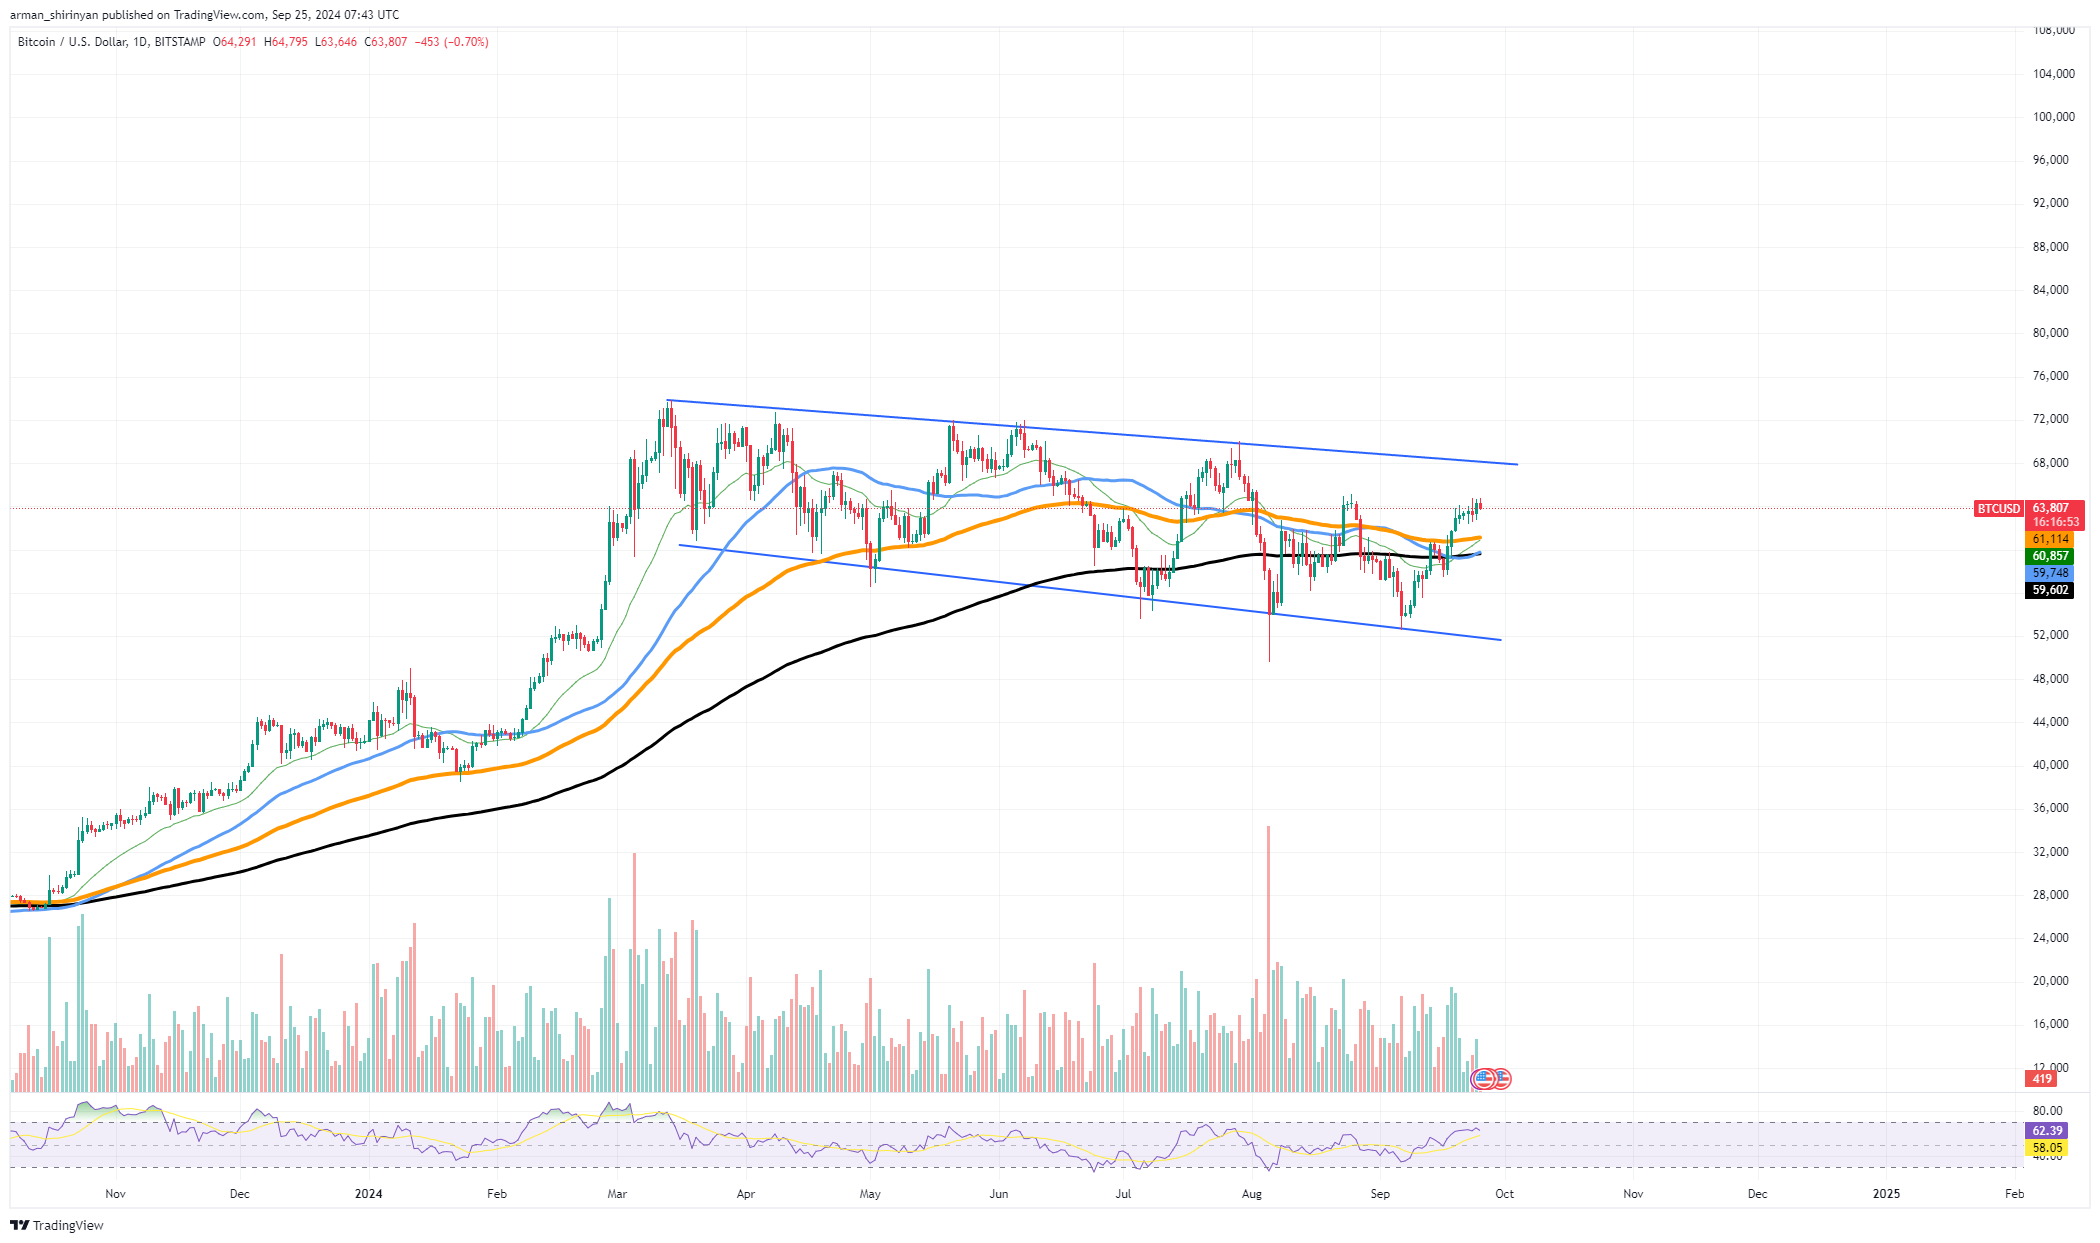
A well-known technical reversal pattern called Head and Shoulders may be developing for Bitcoin. It frequently indicates a possible change in trend. According to the provided chart, Bitcoin appears to be close to finishing this formation, which usually results in a change in market sentiment and a sizable price move.
The head, right shoulder and left shoulder are the three peaks of the Head and Shoulders pattern. The shoulders on either side are lower but about the same height as the head, which is the highest peak. Bitcoin may make a significant move higher and create the conditions for a powerful rally if it breaks below the neckline, which is the support level connecting the shoulder's lows.

BTC/USDT Chart by TradingView
Assets that deviate from this pattern historically see large gains. Following a profitable Head and Shoulders pattern, assets typically grow by 30 to 40%, on average. With Bitcoin currently trading at roughly $63,800, a comparable percentage increase could push the cryptocurrency toward the $90,000 mark — a level that many traders have been predicting.
HOT Stories Bitcoin Pitched as Risk-Off Asset by BlackRock ExecBitcoin (BTC) Golden Cross Coming, Ethereum (ETH) Reclaims Bullish Trend, Binance Coin (BNB) Breaks 65-Day ResistanceBill Maher Exposes Crypto’s “Dirty” Secret$100 Trillion for Binance: CEO Teng Reveals Jaw-Dropping All-Time High
Related

Wed, 09/25/2024 - 05:46Bitcoin Pitched as Risk-Off Asset by BlackRock Exec

Alex Dovbnya
It is crucial to remember that Bitcoin needs to overcome significant resistance levels in order for this pattern to fully materialize. The immediate obstacle is the $65,000 level, where Bitcoin has had difficulty keeping up its pace. The pattern may become invalid, and there may be a retracement toward $60,000 or even lower if the asset is unable to push above this level with significant volume.
Support at $60,500 and $58,000 will be important levels to monitor on the downside. If the pattern fails and there is a breakdown below these levels, more downside could be anticipated. A bullish move toward $90,000, on the other hand, might be sparked by a break above $65,000 with significant volume.
免责声明:本文章仅代表作者个人观点,不代表本平台的立场和观点。本文章仅供信息分享,不构成对任何人的任何投资建议。用户与作者之间的任何争议,与本平台无关。如网页中刊载的文章或图片涉及侵权,请提供相关的权利证明和身份证明发送邮件到support@aicoin.com,本平台相关工作人员将会进行核查。


