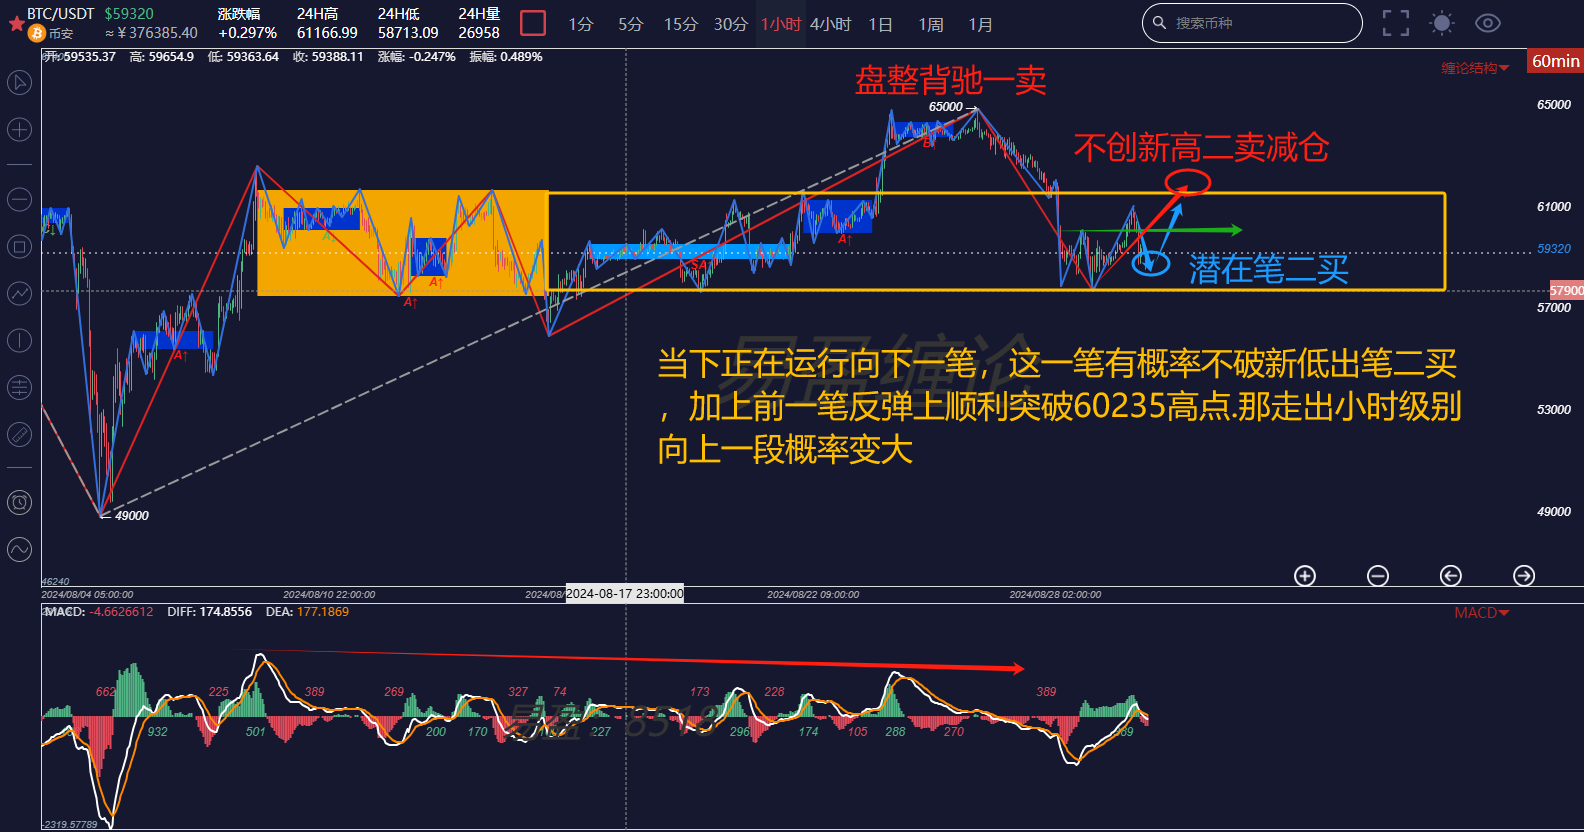
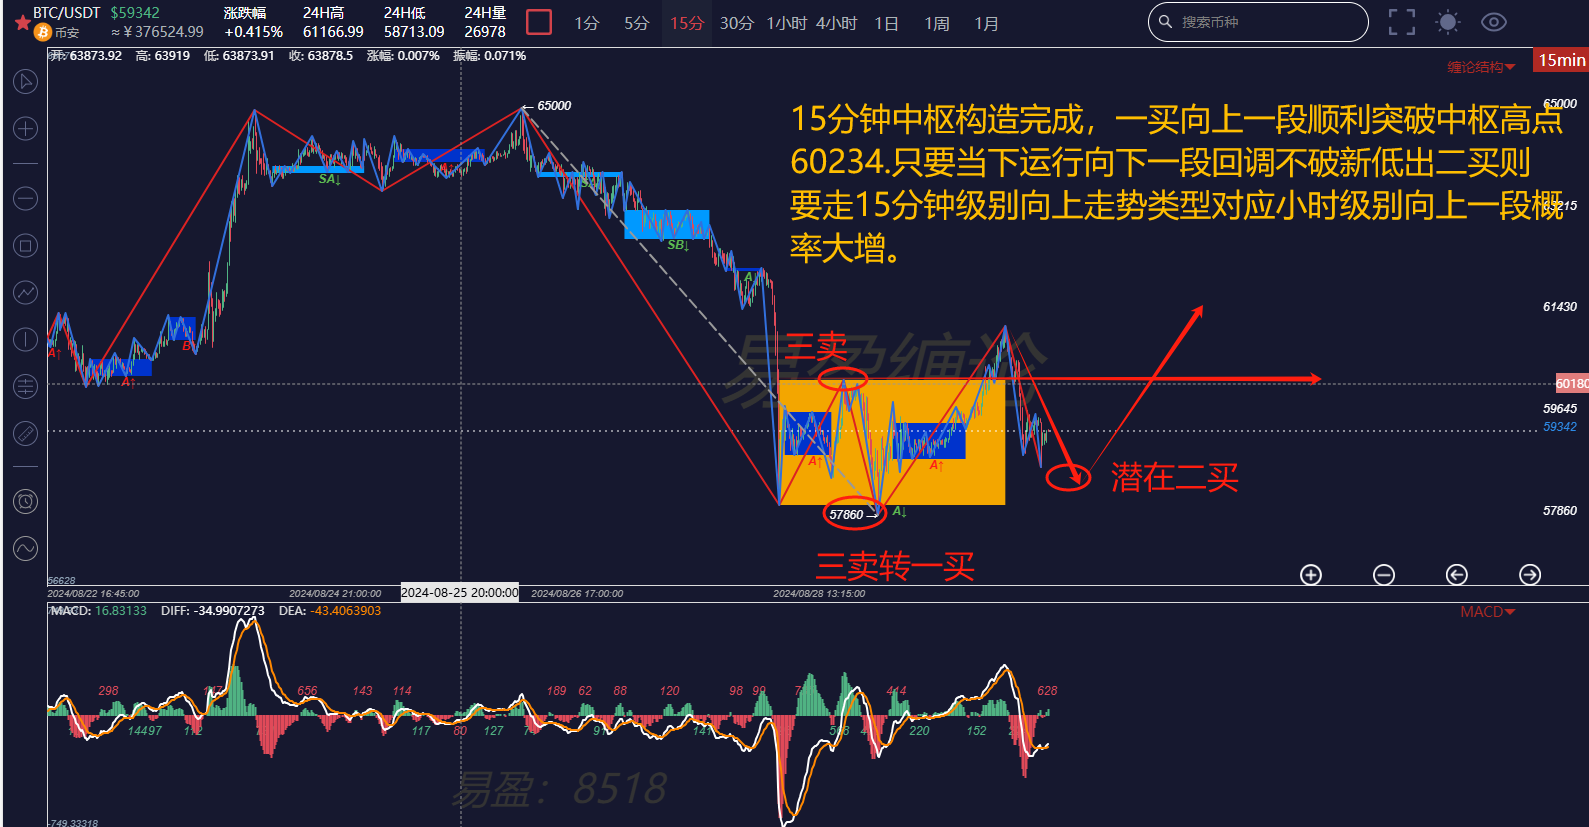
Yesterday, in the early hours, after BTC plunged to 57860, it saw a strong short-term rebound. As analyzed in yesterday's article, the rebound successfully broke through the previous high of 60234, reaching a high of 61166, and then experienced resistance and pulled back. The current price is 59300.
The rebound from 57860 to above 60234 and up to 61100 indicates signs of short-term bulls re-entering. The first factor mentioned in yesterday's article regarding the rebound's upward trend has been achieved. Next, we need to see if there will be a second factor: whether there will be a two-buy at the hourly level. The outcome should be evident based on the current structure of the two-buy at the intraday level.

First, looking at the hourly chart, the current movement is a downward pullback, which has not yet been confirmed as a completed two-buy, but rather a potential two-buy. Whether a two-buy will occur depends on the evolution of the 15-minute trend. Once a two-buy occurs, the probability of an upward trend at the hourly level will significantly increase. It is also important to note that if the upward rebound fails to break through 65000 with volume at the hourly level and does not form a two-sell, it can be basically confirmed that the larger 4-hour trend will move into a downward pullback. Therefore, when a bearish divergence point appears during this hourly rebound, it is still a time for medium-term reduction.

Next, looking at the 15-minute chart, attention should be paid to whether the current 15-minute downward movement will form a new low and trigger a two-buy. If a two-buy occurs, it will continue to follow the strength of the rebound after the two-buy. If it successfully breaks through 61166, it confirms that an upward trend at the hourly level has emerged. If the rebound is weak and cannot break through 61166, the trend will fluctuate, and there is a considerable probability of continuing to break through the low of 57860.
Ultimately, the only level of trading that can be determined at the moment is the 15-minute central oscillation. Short-term trends change rapidly, are influenced by many factors, and often lead to small changes. Therefore, those who are not good at short-term trading can ignore small-level fluctuations.
In conclusion, we should be clear that the current trend is a downward pullback at the 4-hour level, and this downward pullback has only lasted for three days and has only completed two movements, with no internal structure. It is still too early to say that the 4-hour downward pullback is complete, and the opportunity for a major bottoming out still requires patience.
The above analysis is for reference only and does not constitute any investment advice!
If you are interested in the "Chen Theory" and want to obtain learning materials for free, watch public live broadcasts, participate in offline "Chen Theory" training camps, improve your trading skills, and build your own trading system to achieve stable profitability goals, and use "Chen Theory" to timely exit at the top and bottom, you can scan the code to follow the public account and add the WeChat account of this number for more information!

免责声明:本文章仅代表作者个人观点,不代表本平台的立场和观点。本文章仅供信息分享,不构成对任何人的任何投资建议。用户与作者之间的任何争议,与本平台无关。如网页中刊载的文章或图片涉及侵权,请提供相关的权利证明和身份证明发送邮件到support@aicoin.com,本平台相关工作人员将会进行核查。


