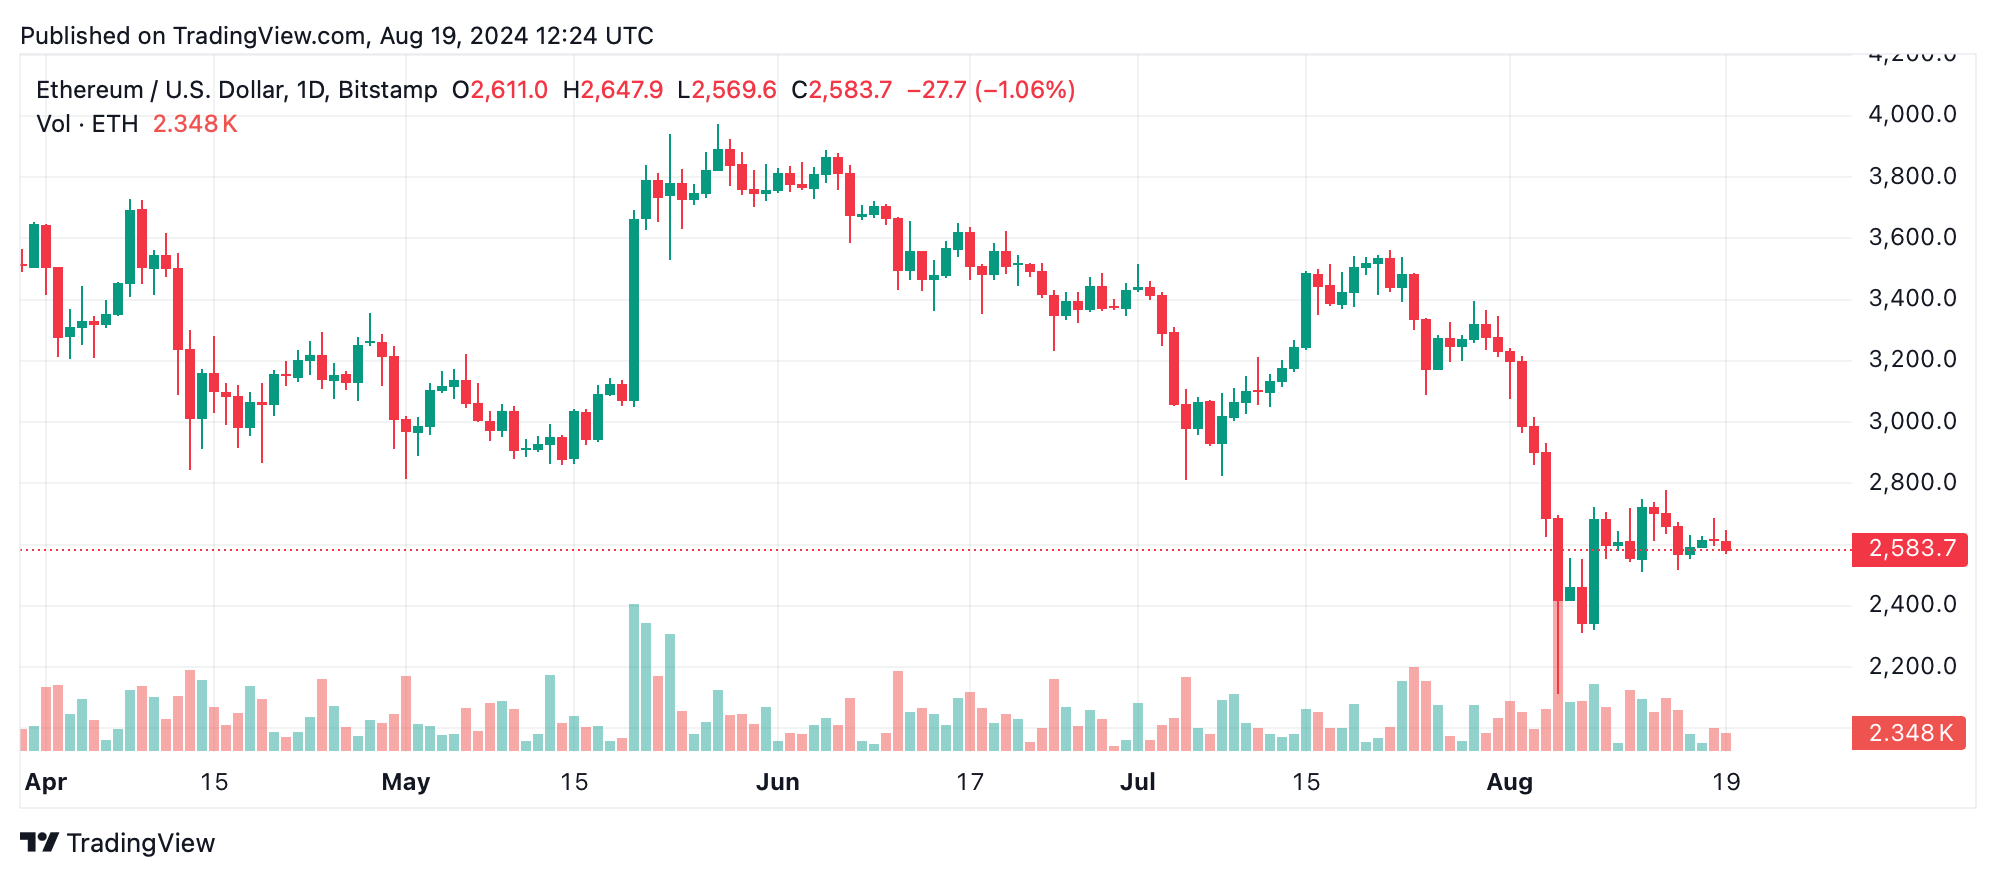
Ethereum’s daily chart paints a clear picture of the prevailing bearish trend. After a sharp decline from around $3,565 to a low near $2,017, the market shows signs of indecision, characterized by small movements. Volume analysis further corroborates this sentiment, with a peak of volume near the recent low, signaling a potential capitulation point. Support is found around $2,017, with resistance expected in the $2,800 to $3,000 range, where previous support has turned into resistance.

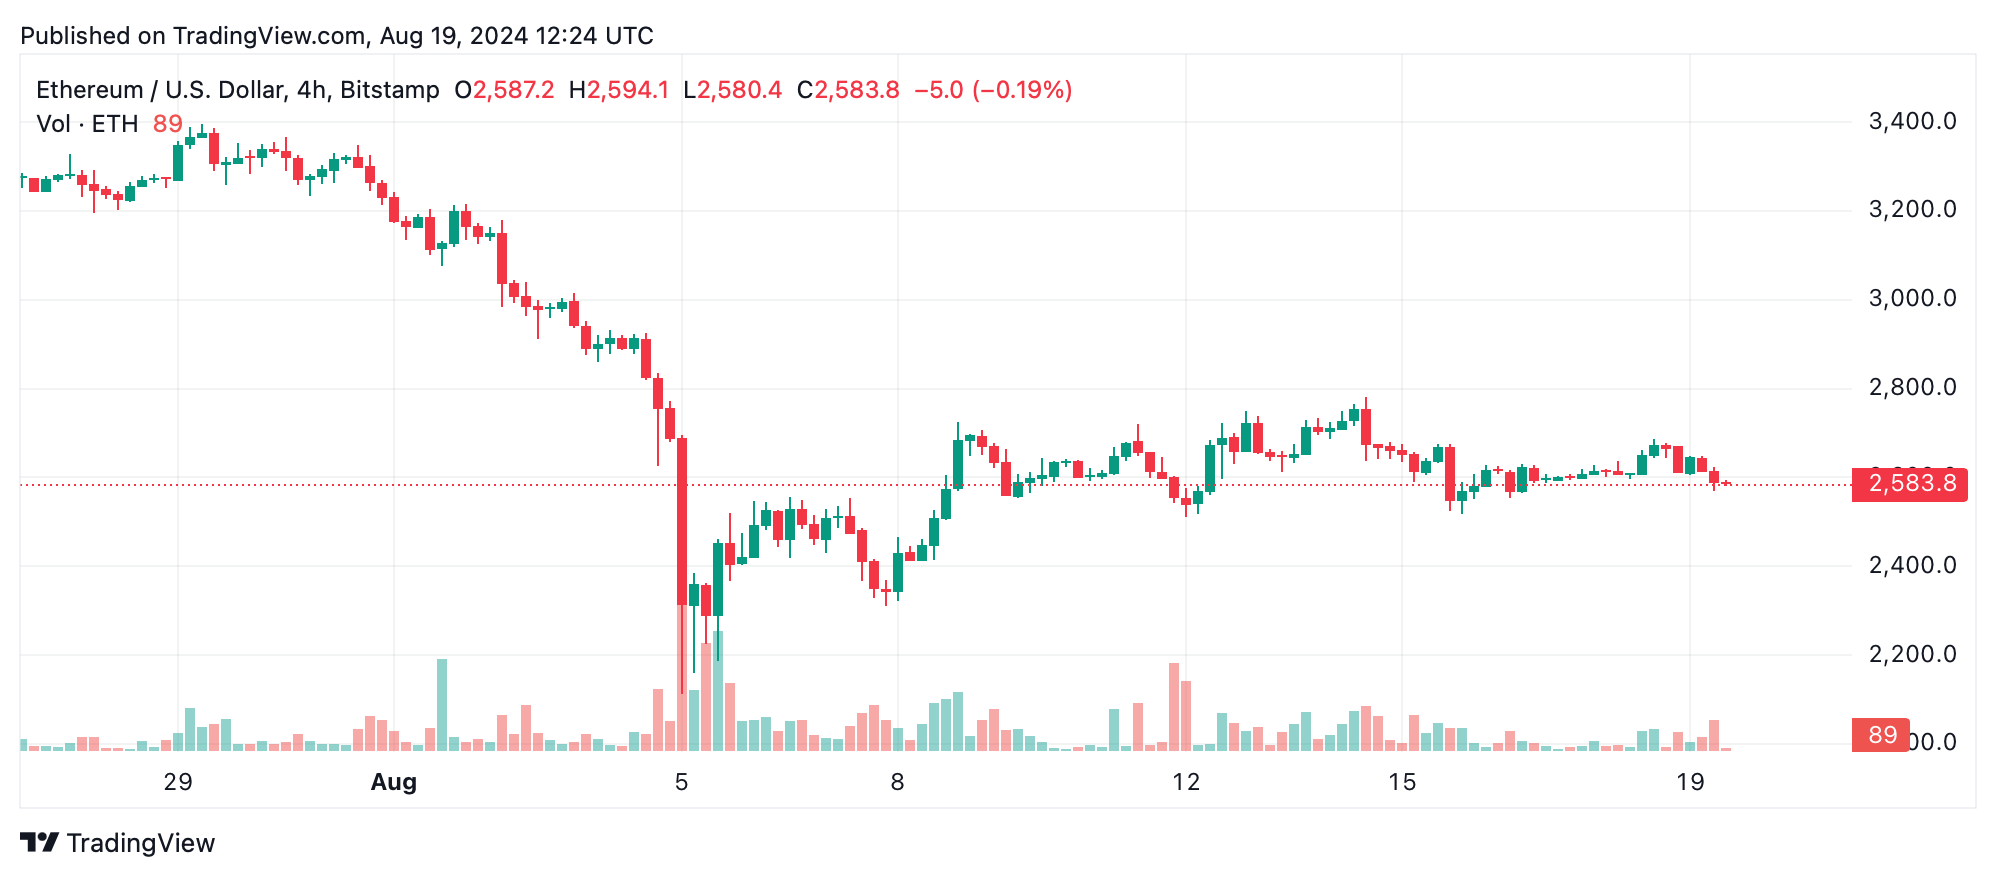
ETH/USD 4-hour chart on Aug. 19, 2024.
On the 4-hour chart, ethereum continues its downward trajectory with lower highs and lower lows, highlighted by a recent sharp drop to $2,515, followed by a modest recovery. The volume spikes on the downturns indicate strong selling pressure, particularly during the drop. Support is now positioned around $2,515, with resistance near $2,700, where the price retraced before declining again.

ETH/USD daily chart on Aug. 19, 2024.
The 1-hour chart reflects a micro downtrend within the broader bearish context. Following a dip to $2,565, ethereum attempted a recovery but has struggled to build momentum. Volume remains low except for spikes on large downturns, suggesting that selling pressure might persist. Key support lies around $2,565, with resistance at $2,688.
Oscillators across multiple time frames predominantly signal neutrality, with the relative strength index (RSI) at 38.9, the Stochastic at 64.8, and the commodity channel index (CCI) at -38.1. However, momentum indicators such as the moving average convergence divergence (MACD) level at -145.8 suggest a buy signal, indicating the potential for a short-term bounce. Nonetheless, the overall sentiment remains cautious due to the strong bearish signals from moving averages across the 10, 20, 50, 100, and 200-day periods, all indicating negative sentiment.
Bull Verdict:
Despite the prevailing bearish sentiment, a potential short-term reversal could be on the horizon, as suggested by buy signals from momentum indicators like the MACD. If ethereum can hold above the $2,600 support level and gain momentum, there might be room for a bullish bounce toward the $2,700 to $2,800 resistance levels. However, this outlook requires careful monitoring of volume and price action to confirm any bullish momentum.
Bear Verdict:
The overall technical landscape for ethereum remains bearish, with strong resistance and persistent selling pressure across all time frames. The consistent sell signals from moving averages and the struggle to gain momentum suggest that ethereum may continue to face downward pressure. Unless there is a significant shift in market dynamics, the path of least resistance appears to be lower, with key support levels at risk of being tested.
Bitcoin.com News is seeking a News Writer to produce daily content on cryptocurrency, blockchain, and the digital currency ecosystem. If you are interested in becoming a key member of our innovative global team, apply here.
免责声明:本文章仅代表作者个人观点,不代表本平台的立场和观点。本文章仅供信息分享,不构成对任何人的任何投资建议。用户与作者之间的任何争议,与本平台无关。如网页中刊载的文章或图片涉及侵权,请提供相关的权利证明和身份证明发送邮件到support@aicoin.com,本平台相关工作人员将会进行核查。


