On the afternoon of July 22nd, AICoin researchers conducted a live graphic and text sharing session titled "Quick Introduction to Common BTC Indexes (with Membership Giveaway)" in the AICoin PC-end Group Chat Live. Below is a summary of the live content.
In this session, we discussed several simple and practical indexes to help everyone quickly understand potential market information.
I. Bitcoin Reverse (BTC Exchange Reserve)
1. Basic Concept: Analysis of Exchange BTC Reserve
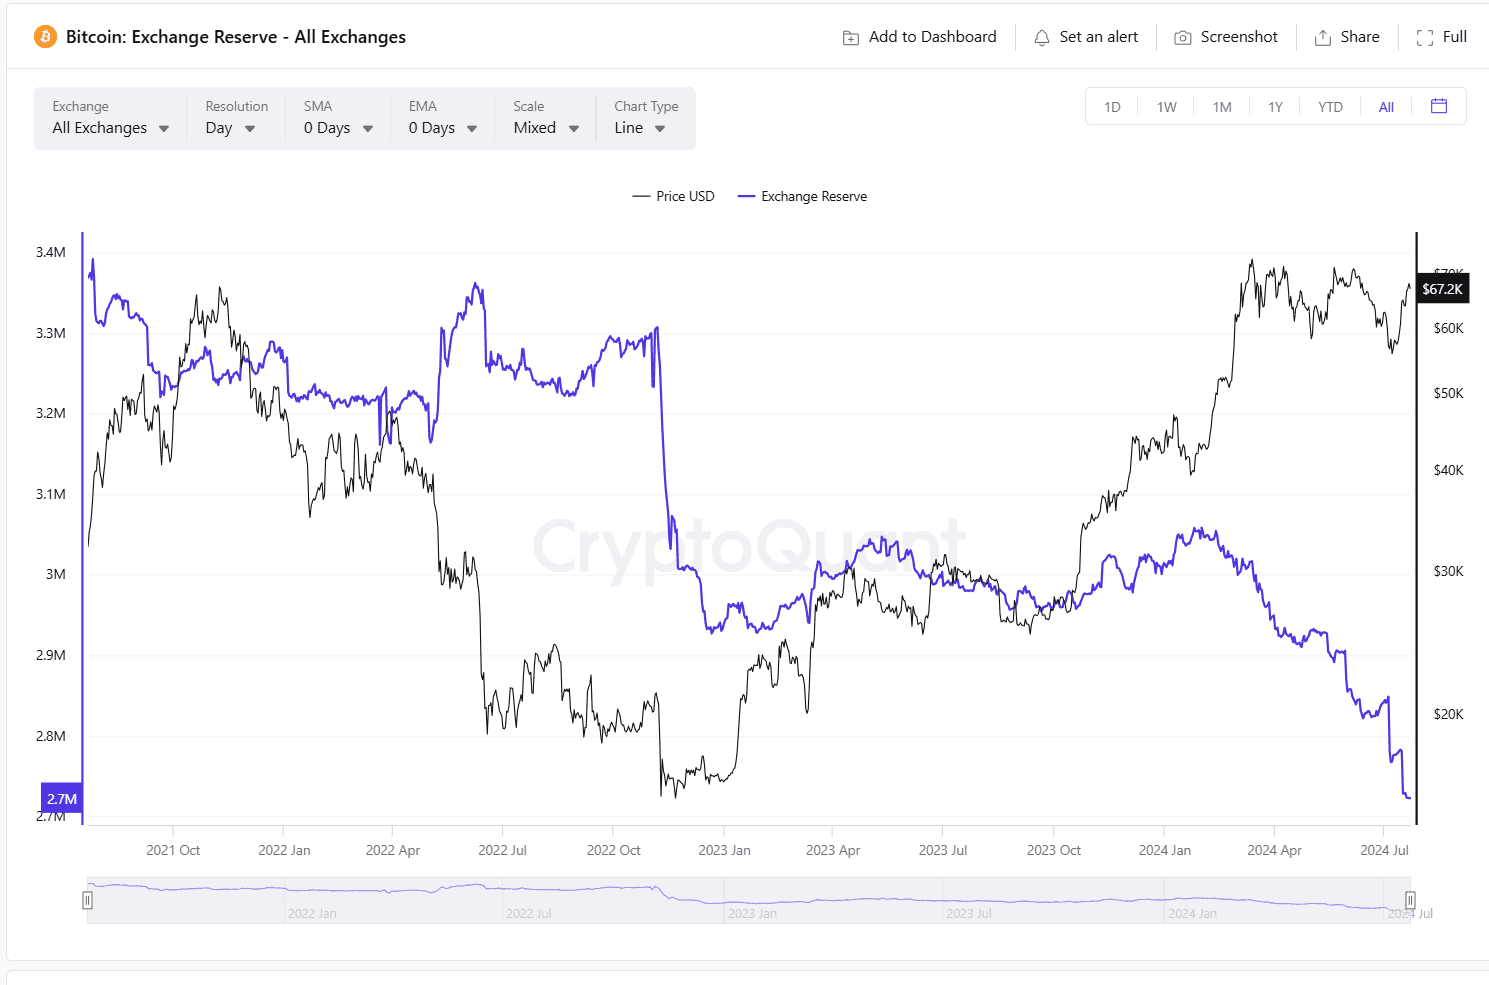
Bitcoin Reverse (BTC Exchange Reserve) represents the total amount of BTC held by exchanges (CEX), including user assets and exchange assets.
The following chart aggregates the BTC reserve of most exchanges (can be viewed on cryptoquant or glassnode):
2. Market Implications of Reserve Changes
(1) During bear markets or FUD periods, changes in exchange reserves reflect overall market confidence. For example, during the FTX thunderstorm period, the withdrawal of assets from the exchange to personal wallets caused a significant decrease in exchange reserves.
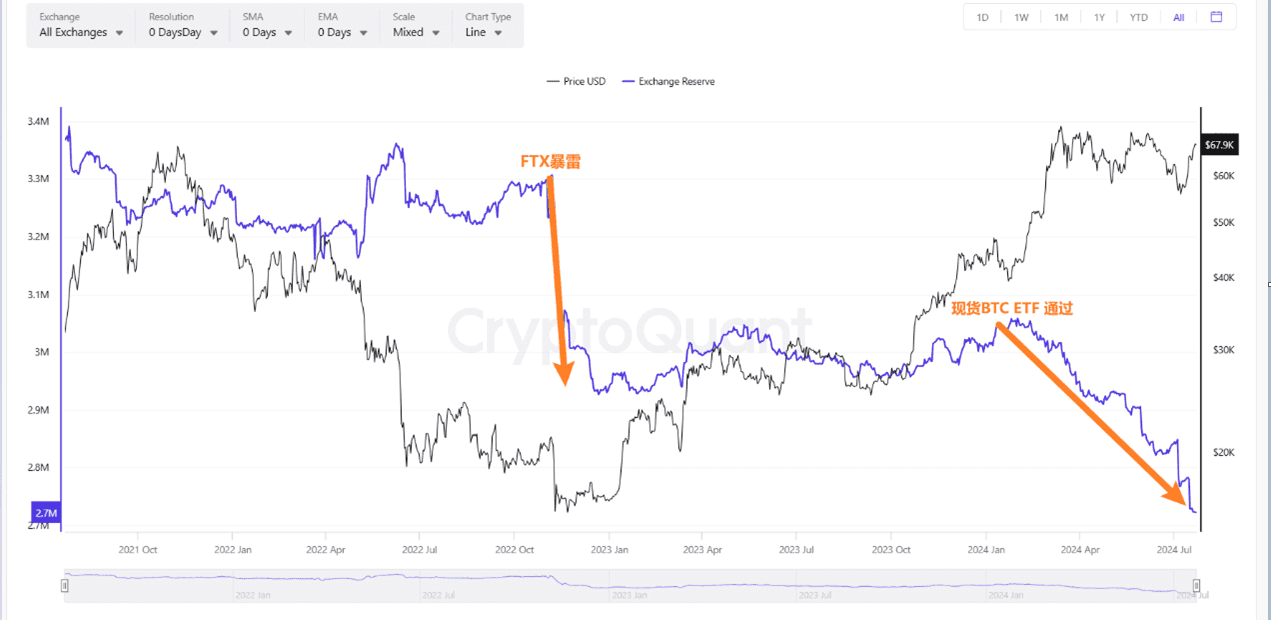
(2) In bull markets, an increase in BTC exchange reserves represents potential selling pressure in the market, while a decrease indicates increased buying by investors (including retail and institutional). For example, after the approval of the spot BTC ETF on January 11th, the exchange reserve showed a decline mainly due to continuous institutional buying (BlackRock, Fidelity, etc.).
However, there is no direct linear relationship between exchange reserves and BTC prices. Exchange reserves generally reflect investors' preference for trading through CEX channels. Most BTC trades are conducted through exchanges because CEX offers better slippage and depth compared to on-chain transactions.
Therefore, if exchange reserves decrease, the reasons need to be identified to relate them to trading. A decrease in exchange reserves due to exchange-related FUD is not necessarily positive for the market, while a decrease due to increased holdings by institutions and retail investors is a long-term positive.
3. Current BTC Reserve Trends and JPEX Case Analysis
Currently, exchange reserves are decreasing, mainly flowing into US stock spot ETFs. This can be seen from the corresponding data of institutional holding addresses.
JPEX, which collapsed last September:

This is the collapsed JPEX from last year. It can be seen that the exchange's BTC reserves decreased significantly around September when many people on Twitter reported withdrawal issues.
4. Potential Impact of ETF Approval on the Market
The impact of ETF approval will depend on market data, particularly the net inflow data of ETH ETF. A positive net inflow indicates acceptance by US stock investors and willingness to increase holdings. If outflows are observed, attention will shift to Grayscale, which currently has unusually high fees and still holds a considerable amount of ETH.
II. Bitfinex BTC Long Position (BTCUSD)
1. Market Position and Data Insights of Bitfinex
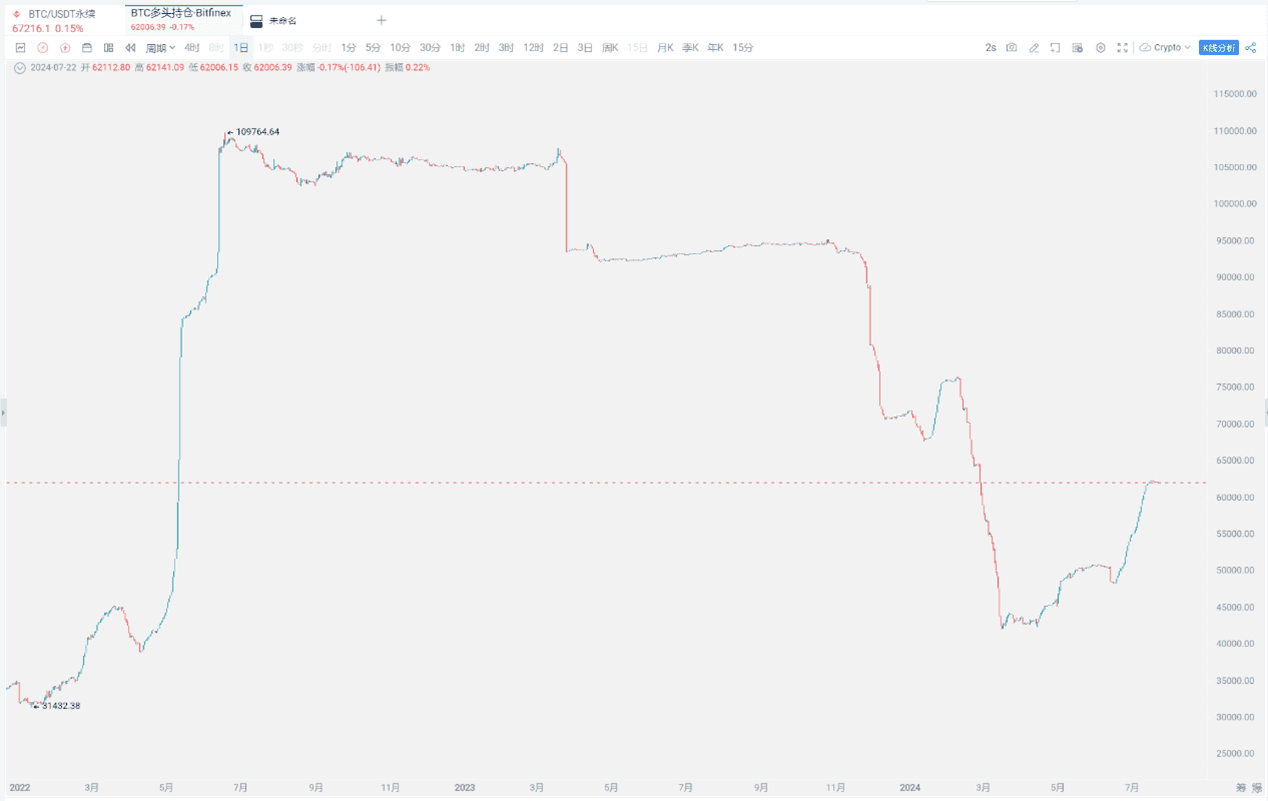
Bitfinex attracts many whales, and the long position is quite significant, mainly for spot leverage, currently around 60,000 BTC.
You can directly search for Bitfinex in the index here.
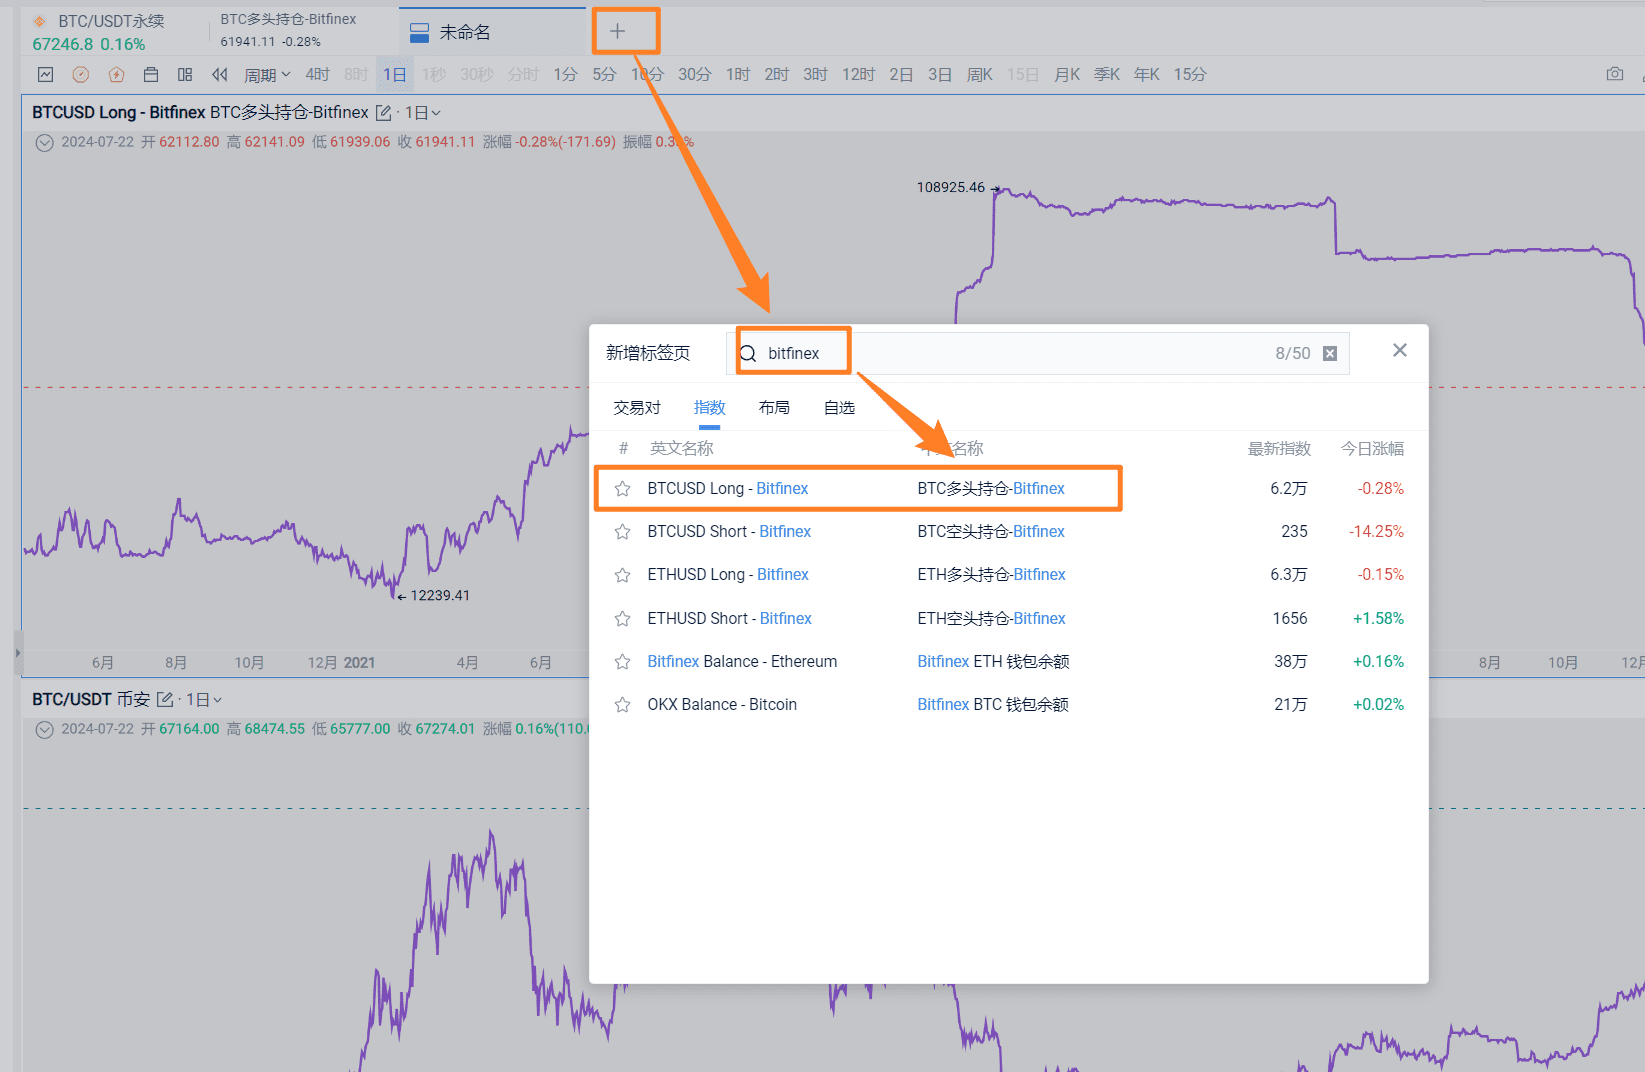
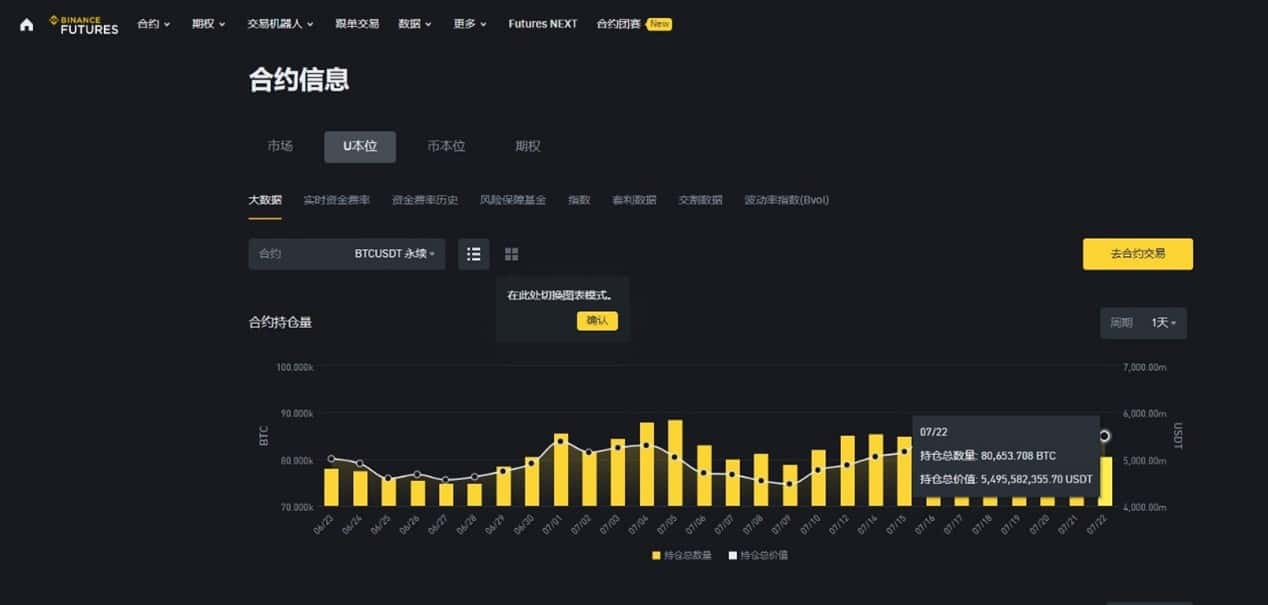
Comparing with the data of the largest exchange, Binance, the current total long and short position of BTCUSDT contracts on Binance is 80,653.7 BTC (worth about $5.5 billion), while Bitfinex has around 60,000 BTC in long positions, which is exceptionally high.
2. Long Position Trends and Market Predictions
Long positions on Bitfinex tend to reduce during upward price movements and increase during downward movements in the long term. However, as a whale indicator, the timing of Bitfinex long position adjustments does not completely coincide with the highest and lowest points of BTC prices.
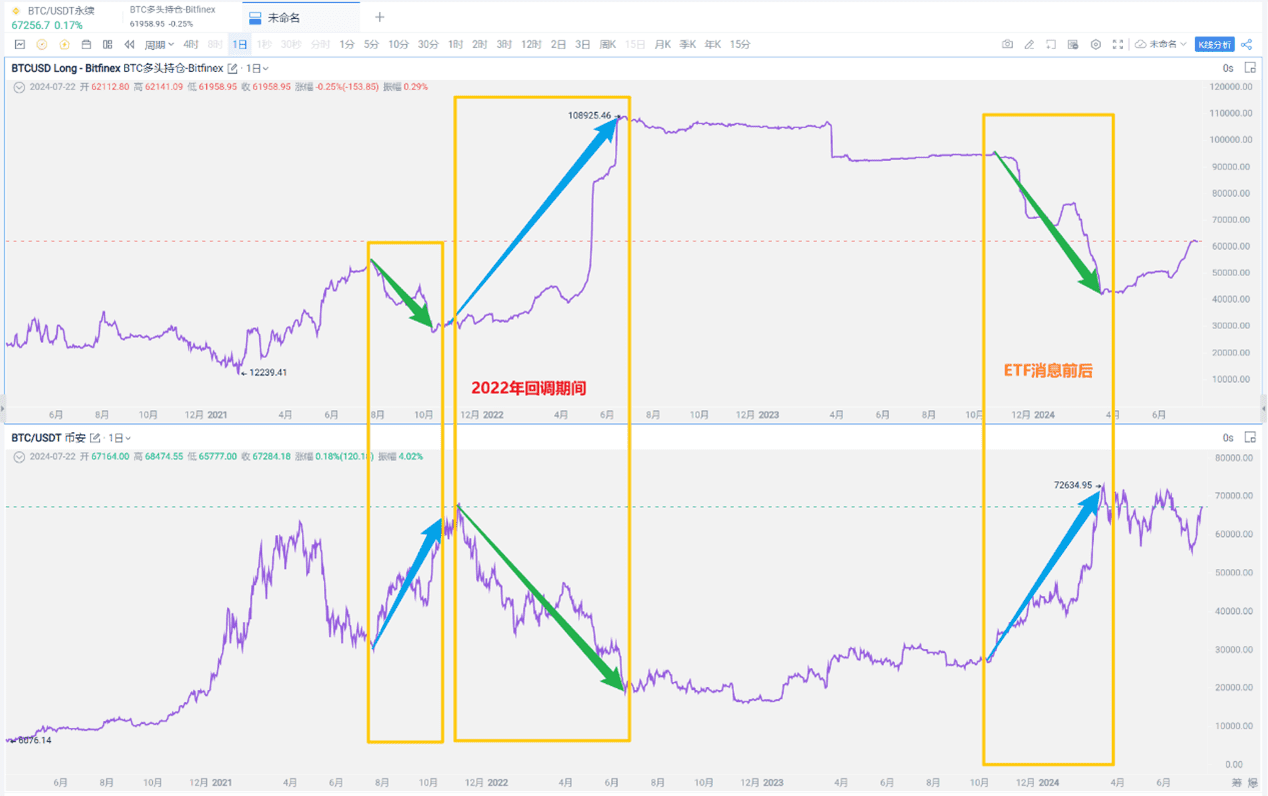
Looking at the recent period, after the news of the spot BTC ETF in October 2023, Bitfinex's BTC long positions have been consistently increasing, indicating bullish sentiment among whales.
As for when the upward trend changes, it was when BTC surged to $70,000 in March, and the whales began to retreat. Looking back at 2021-2022, this trend is even more apparent. Whales tend to increase positions during downward movements and reduce them during upward movements.
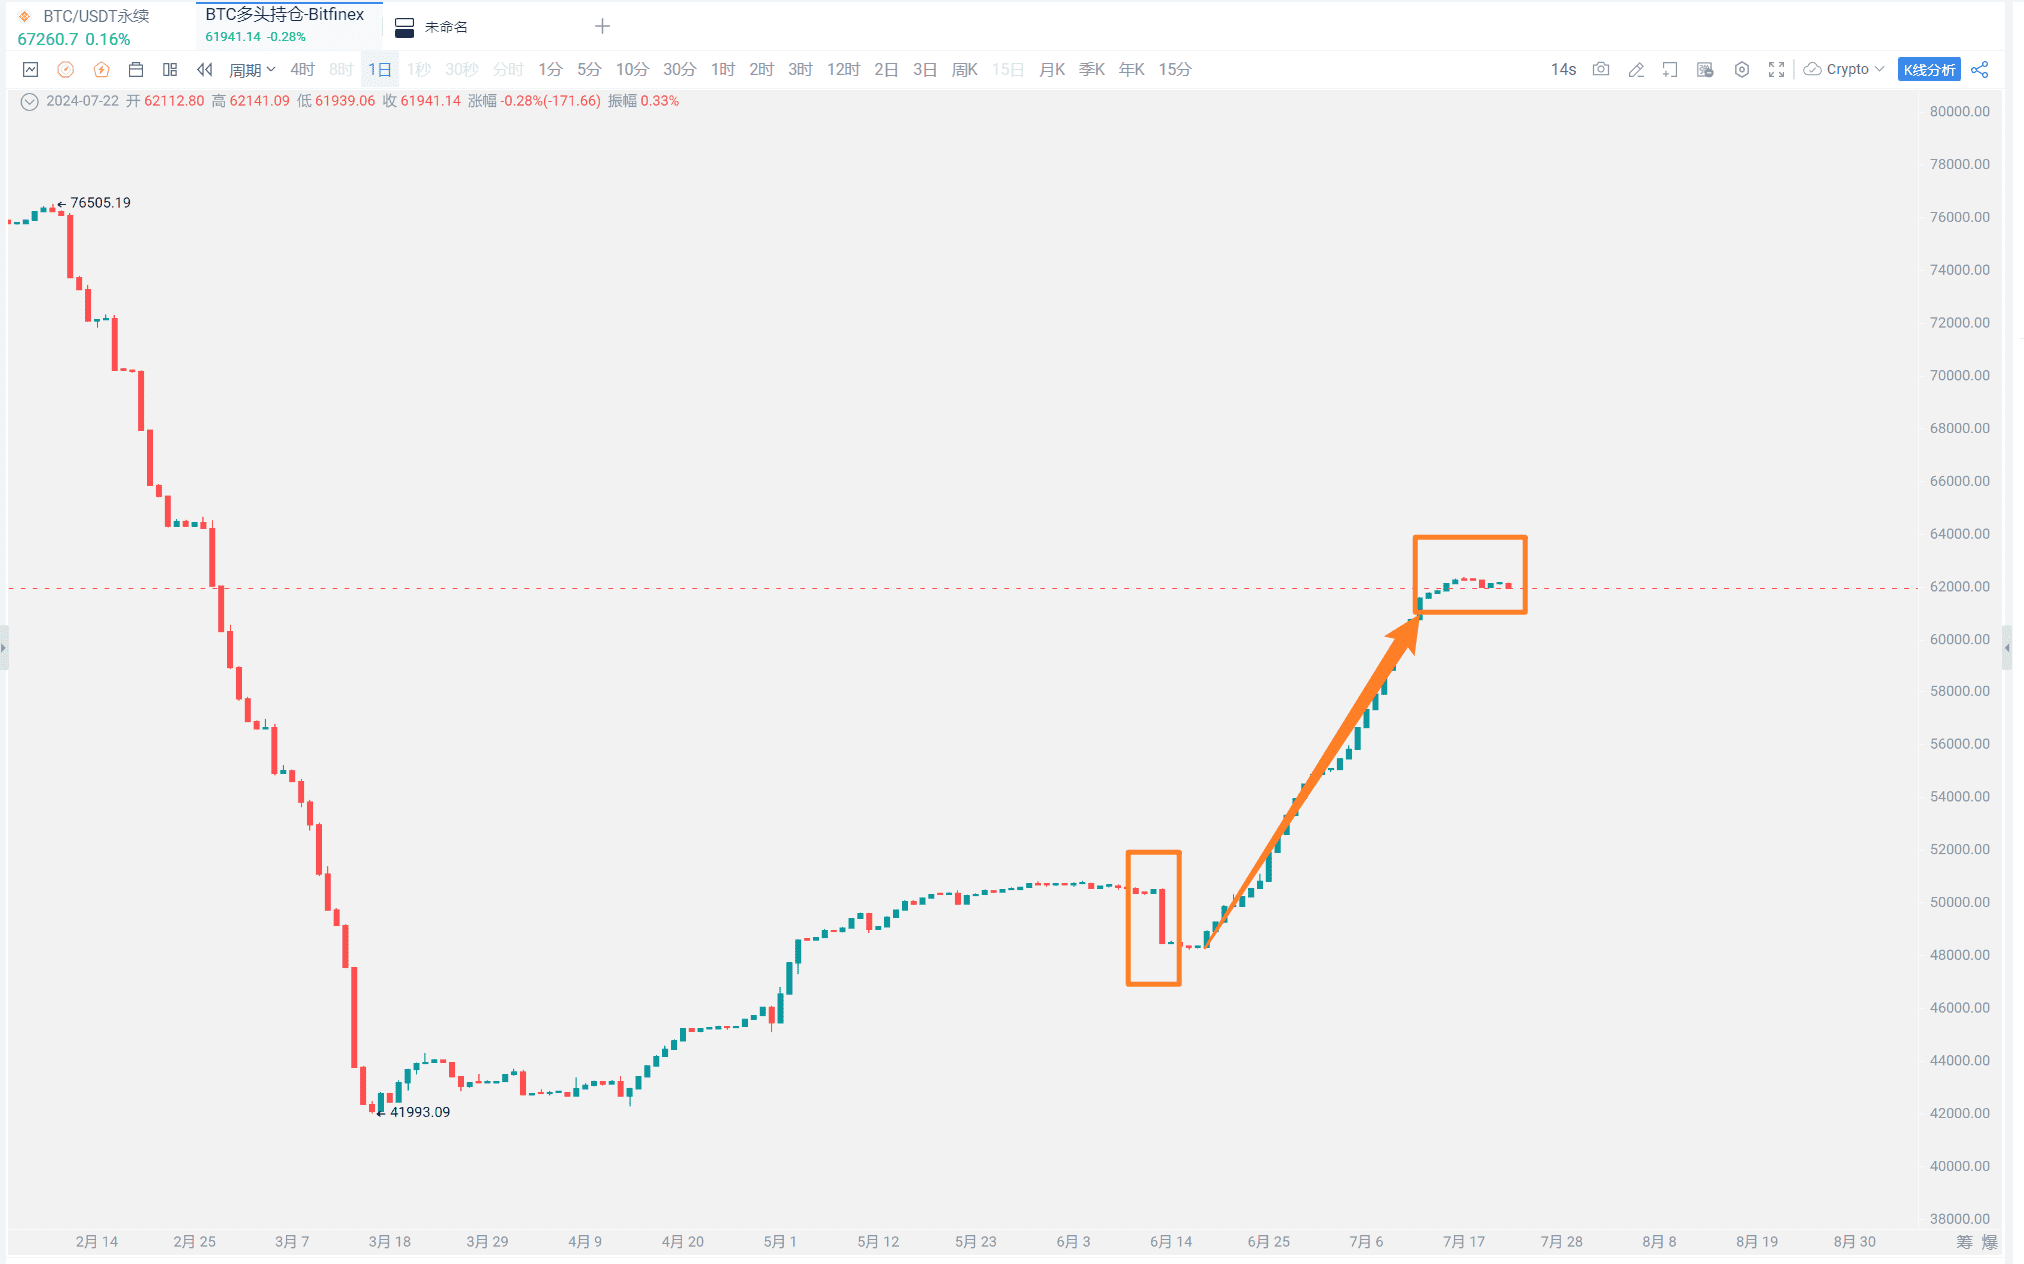
This is a BTC indicator; the effectiveness for ETH is slightly lower. About a month ago, this indicator showed a decline gap, and BTC prices subsequently declined for a few days.
2. Whale Behavior and Its Market Impact
Whales retreating indicates a significant downward trend in long positions on a weekly basis. Currently, Bitfinex's BTC long position data is in a stagnant phase, as it was increasing just one or two weeks ago. It can be observed that the timing of Bitfinex long position adjustments does not completely coincide with the highest and lowest points of BTC prices, but it still holds considerable reference value. Whales do not specifically seek the highest or lowest points for trading, as the risk is high. This indicates that whales are currently waiting due to significant uncertainties related to both the ETH ETF and Trump.
III. UTXO Age Distribution and Price Realization (On-chain Distribution of Chips)
1. Introduction to UTXO System and Its Market Indicator Role
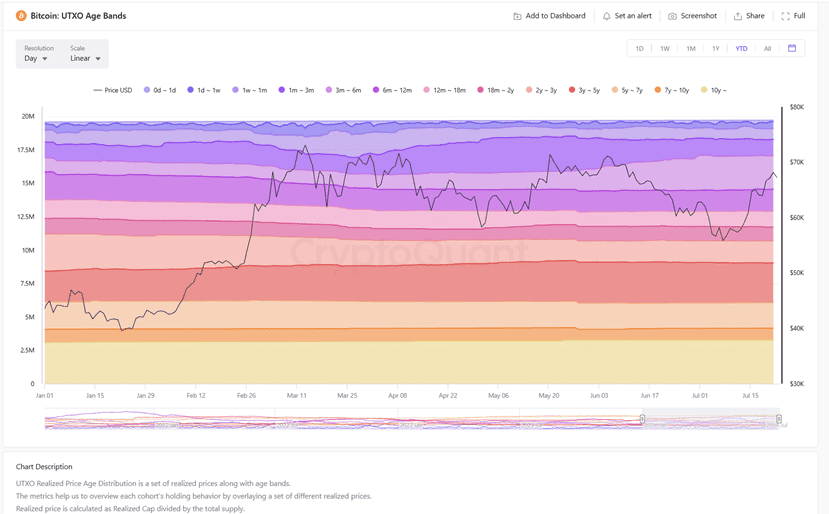
UTXO refers to Unspent Transaction Output. Bitcoin uses UTXO to record transaction events and determine the time of the last usage in BTC transactions.
UTXO can generally reflect the trading behavior of short-term and long-term BTC holders and their corresponding price ranges.
2. Behavior of Short-term and Long-term Holders and Price Relationships
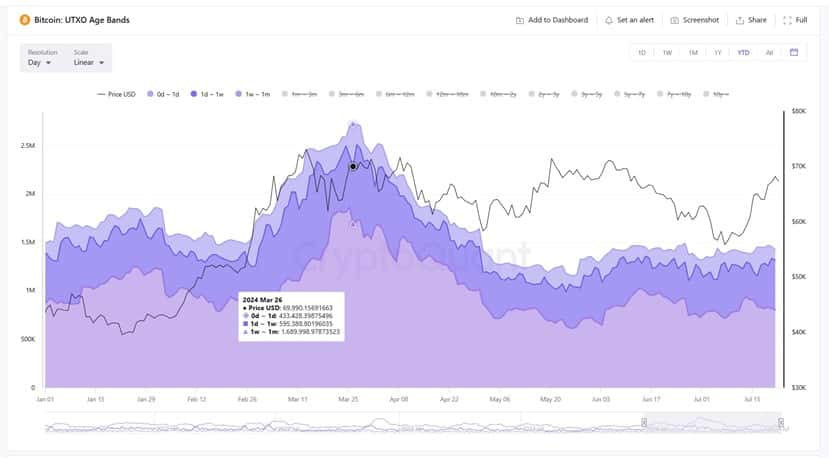
From the UTXO perspective, the decline in the proportion of short-term holders after March is quite apparent. The chart above shows that the proportion of UTXO below January is extremely low, representing a decrease in transactions related to short-term holders (below January).
Combining the corresponding realized prices of UTXO, it can be understood as the real-time prices of BTC traded at different time periods:
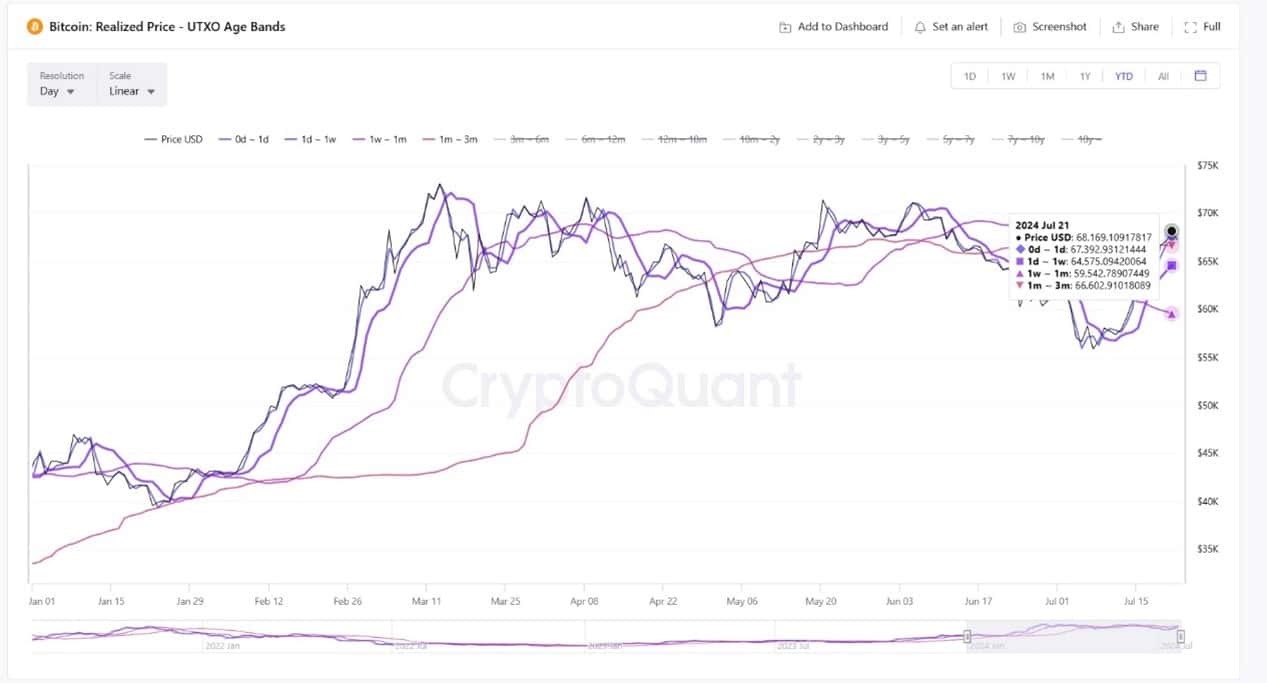
Short-term holders' BTC price distribution based on UTXO time distribution:
0 days-1 day, realized price is 67392;
1 day-1 week, realized price is 64575;
1 week-1 month, realized price is 59777;
1 month-3 months, realized price is 66602;
Currently, the BTC price is between $67000-$68000, indicating that the majority of short-term holders' chips are in the profit range. The UTXO from 1 week to 1 month represents the chips bought during the German government's selling period, with the largest profit margin.
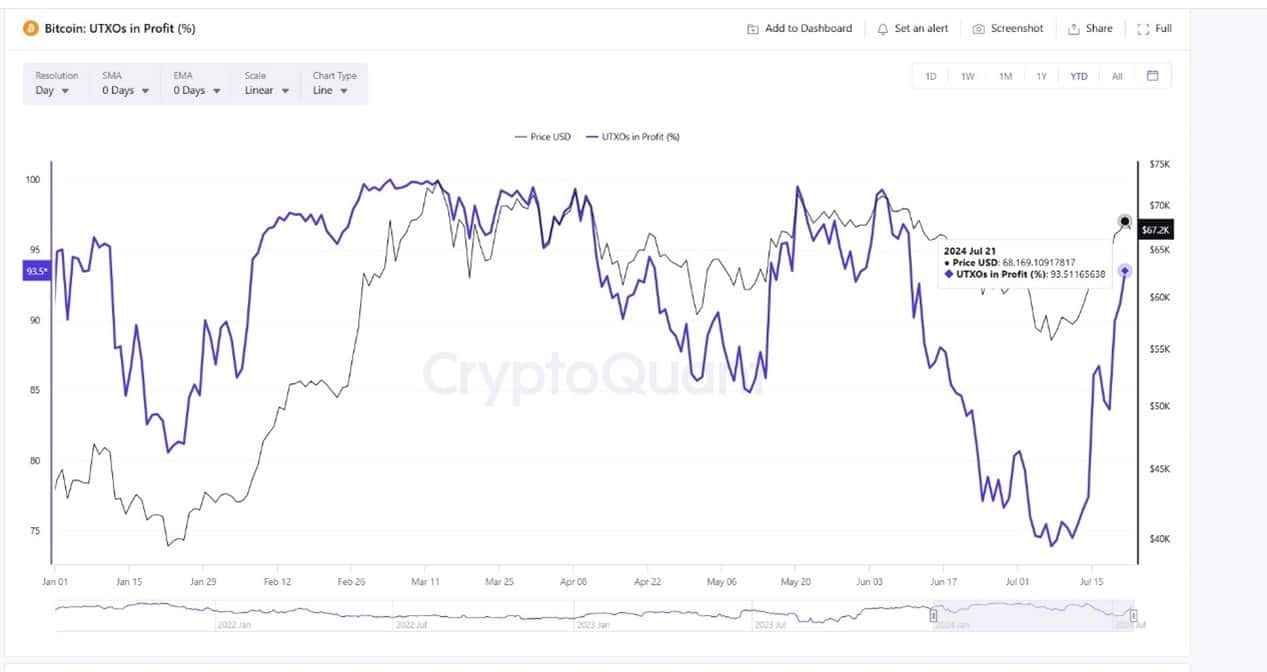
At the current price, the prices corresponding to different UTXOs show that 93% of the chips are in the profit range. This indicates that the majority of people have not been disappointed by Bitcoin. However, those who bought near the high point of 70,000 in March are clearly not in the profit range. Based on UTXO cost analysis, there is a significant difference in cost for different holding periods. Chips held for over 3 years may have a cost range that is much lower than the current price.
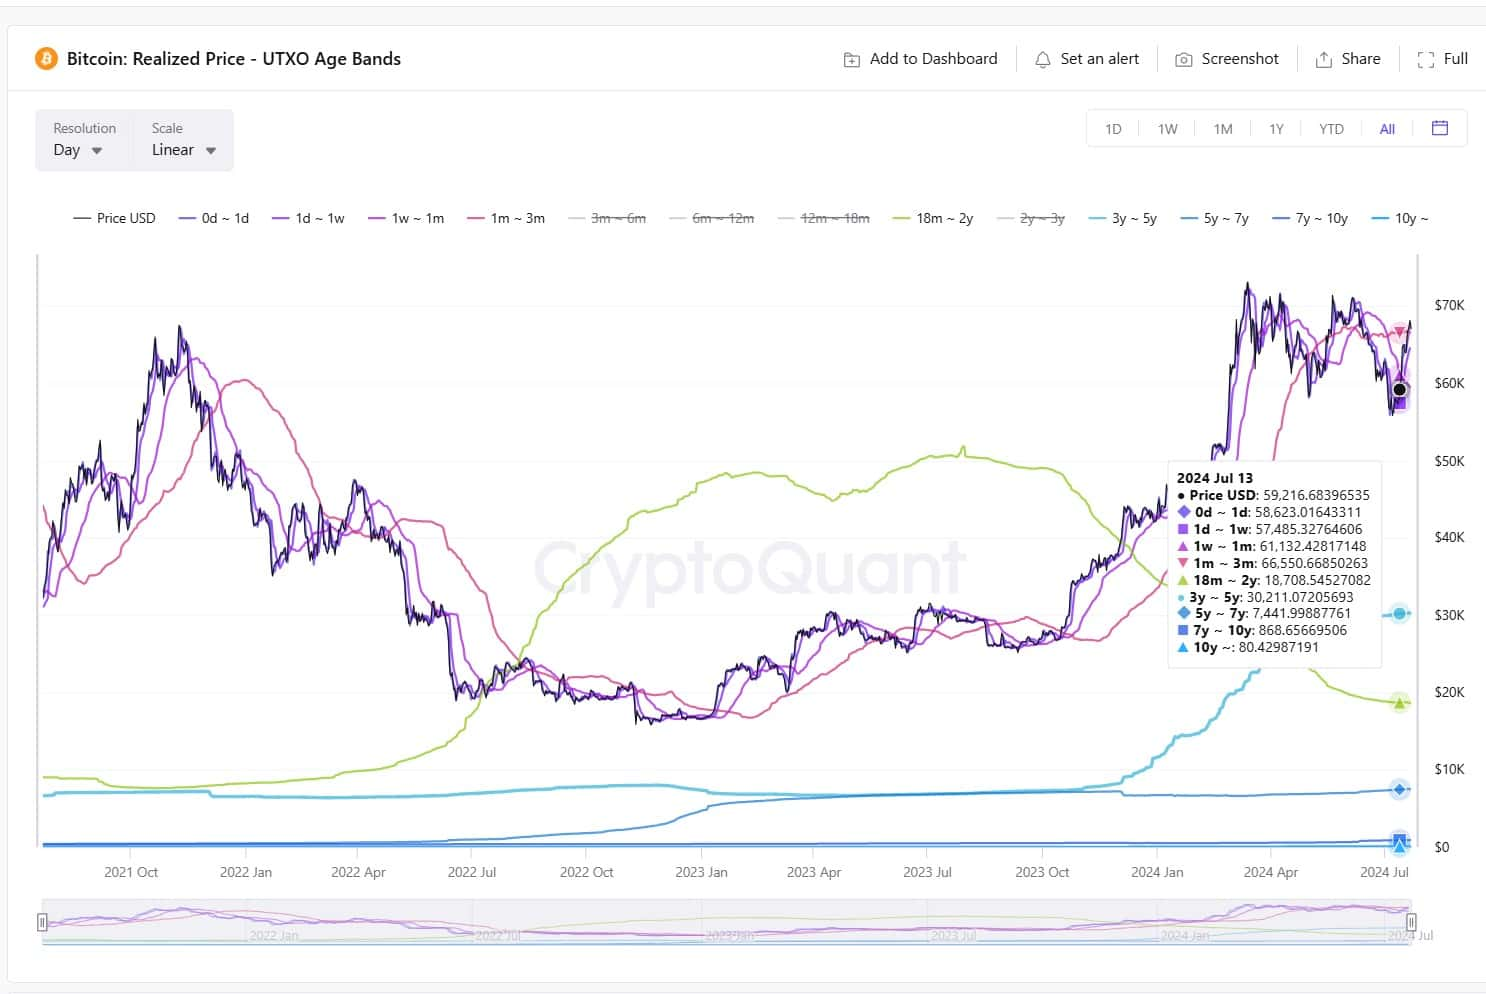
For those held for over 3 years, the average cost is around 30,000. Miners have different costs at different times, which depend on the halving cycle, mining machine calculations, electricity costs, and operational expenses. The cost price for miners can be estimated to be around 60,000.
Recommended Reading
For more live content, please follow AICoin's "News/Information - Live Review" section, and feel free to download AICoin PC-end for more information.
免责声明:本文章仅代表作者个人观点,不代表本平台的立场和观点。本文章仅供信息分享,不构成对任何人的任何投资建议。用户与作者之间的任何争议,与本平台无关。如网页中刊载的文章或图片涉及侵权,请提供相关的权利证明和身份证明发送邮件到support@aicoin.com,本平台相关工作人员将会进行核查。


