Hello everyone! In the live broadcast at 16:00 on March 24, our AiCoin editor is back with some valuable insights! This time, we will teach you how to break the curse of "buying leads to a drop, selling leads to a rise" using vertical candlesticks. This is a secret that major funds fear you will understand!
I believe many of you have encountered situations like this: you jump in when you see a big bullish candle, only to be ruthlessly countered; or you draw a bunch of support and resistance lines, but the market completely ignores them. Don't worry, today the editor will use the simplest language to teach you how to see through the intentions of major players using vertical candlesticks!
First, let's talk about what vertical candlesticks are. Simply put, they are two special types of candlesticks:
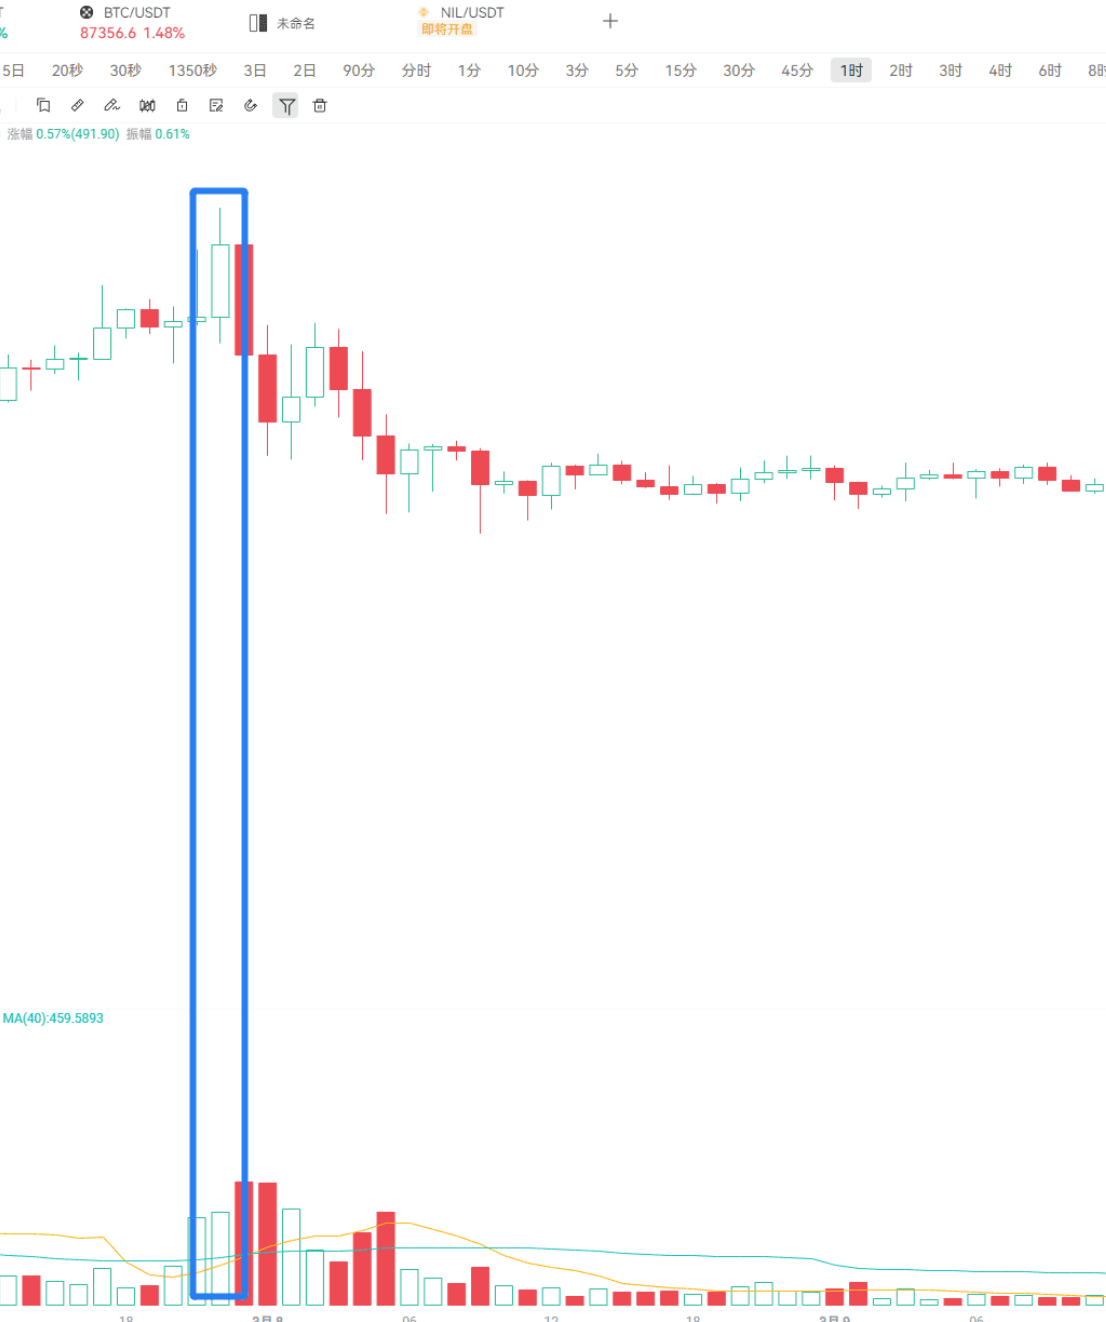
The first type is the vertical demand candlestick (bullish), characterized by a large bullish candle accompanied by high trading volume, indicating that buying pressure is very strong and major players are aggressively accumulating. Just like the large bullish candle with increased volume for BTC last Wednesday, which directly wiped out countless short positions!

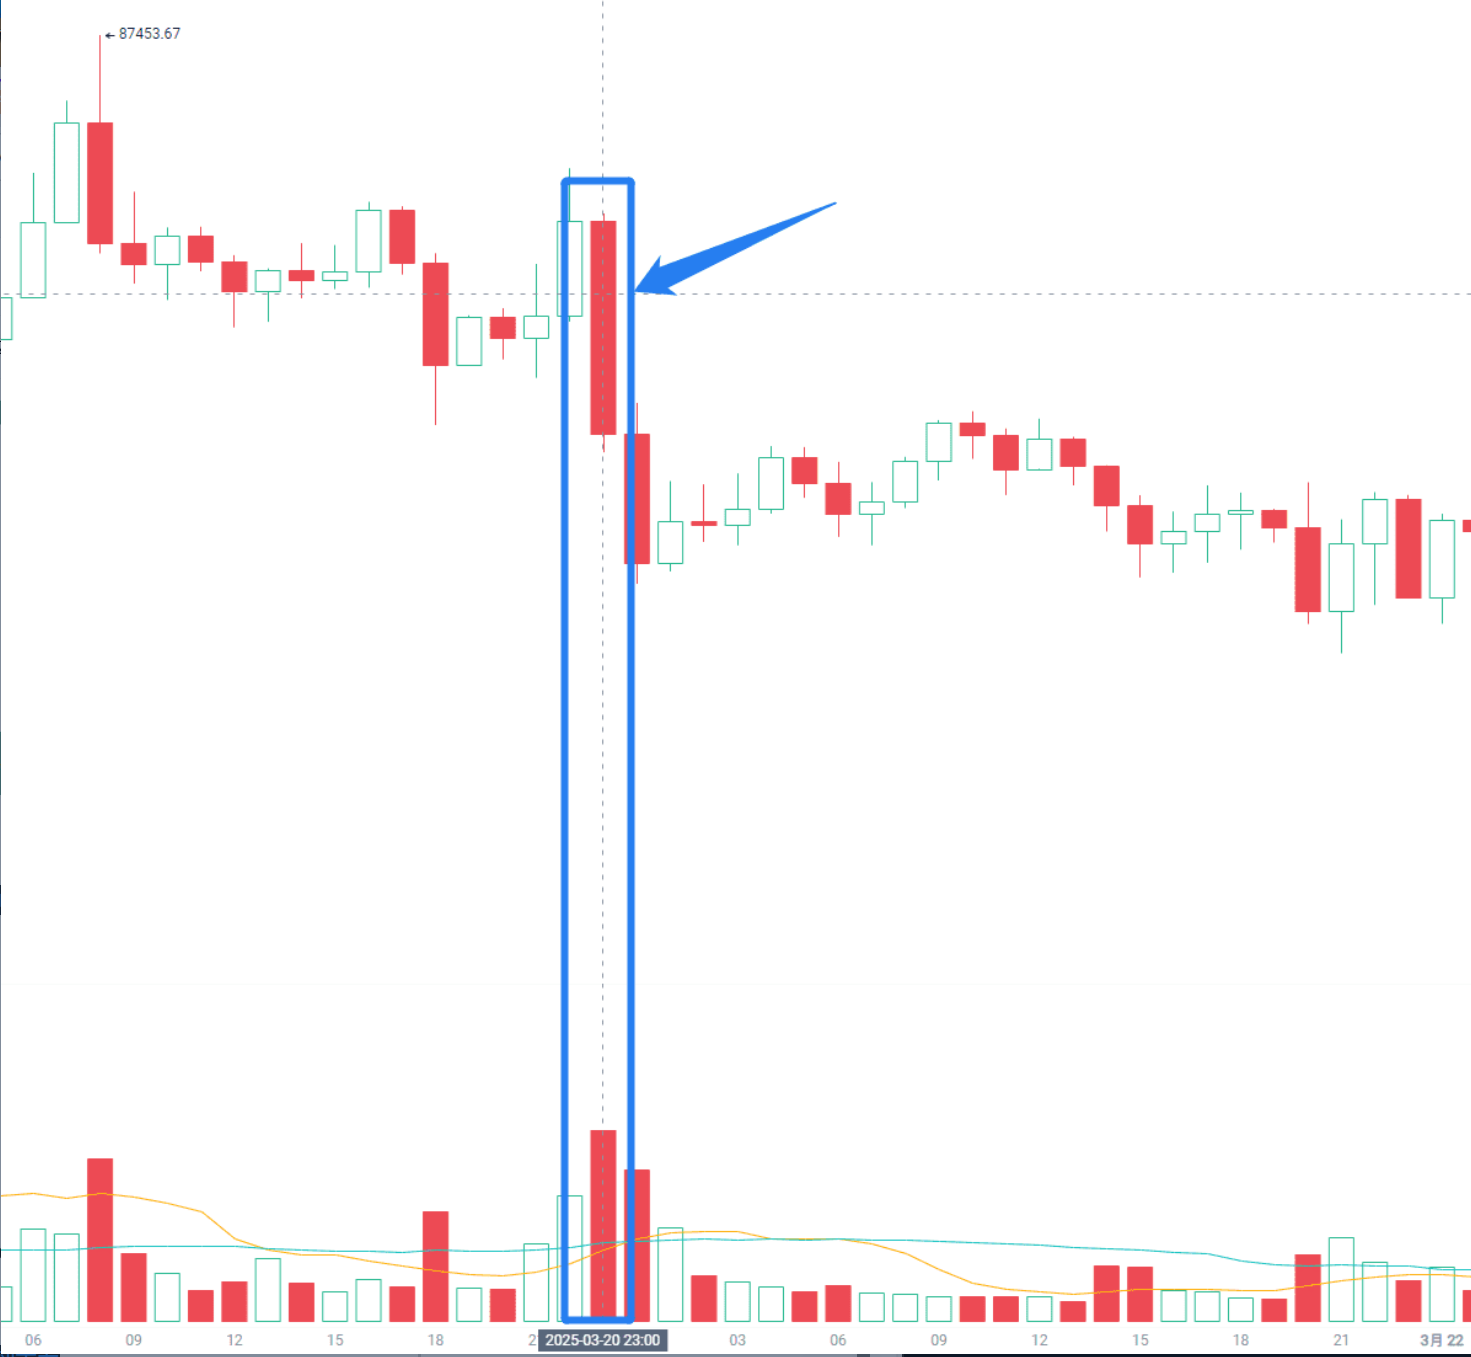
The second type is the vertical supply candlestick (bearish), characterized by a large bearish candle accompanied by high trading volume, indicating that selling pressure is dominant. Do you remember the large bearish candle with increased volume on January 8? How many people got trapped at the peak…
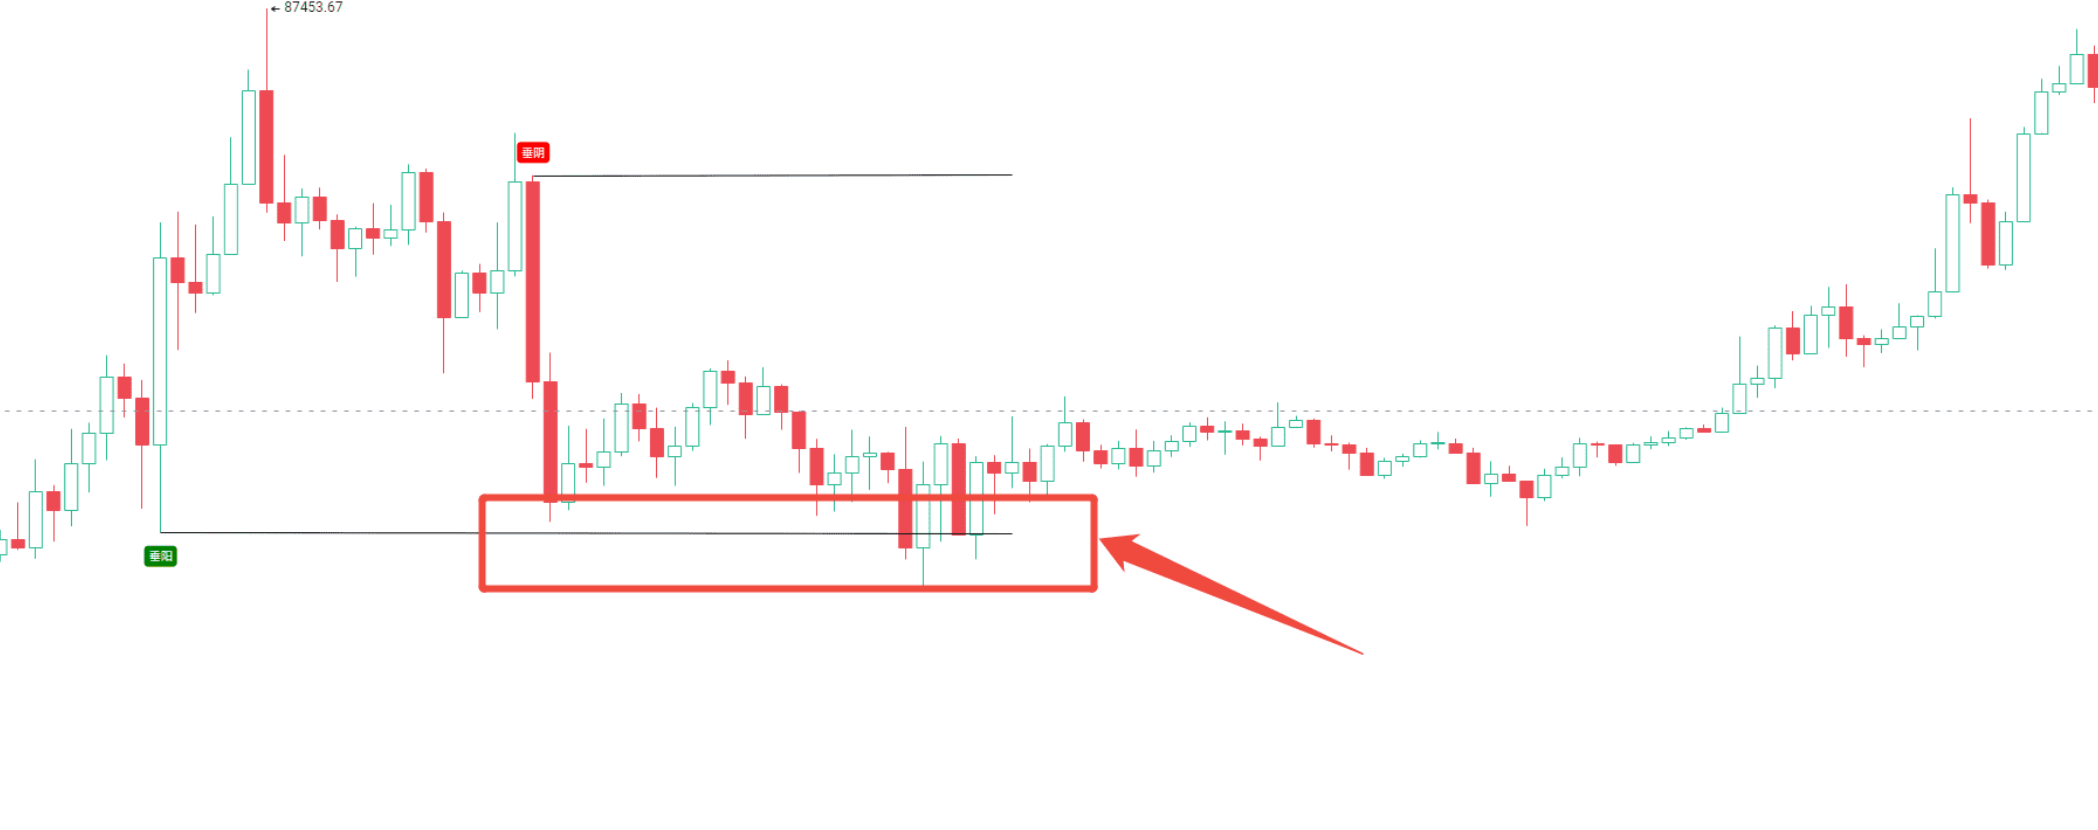
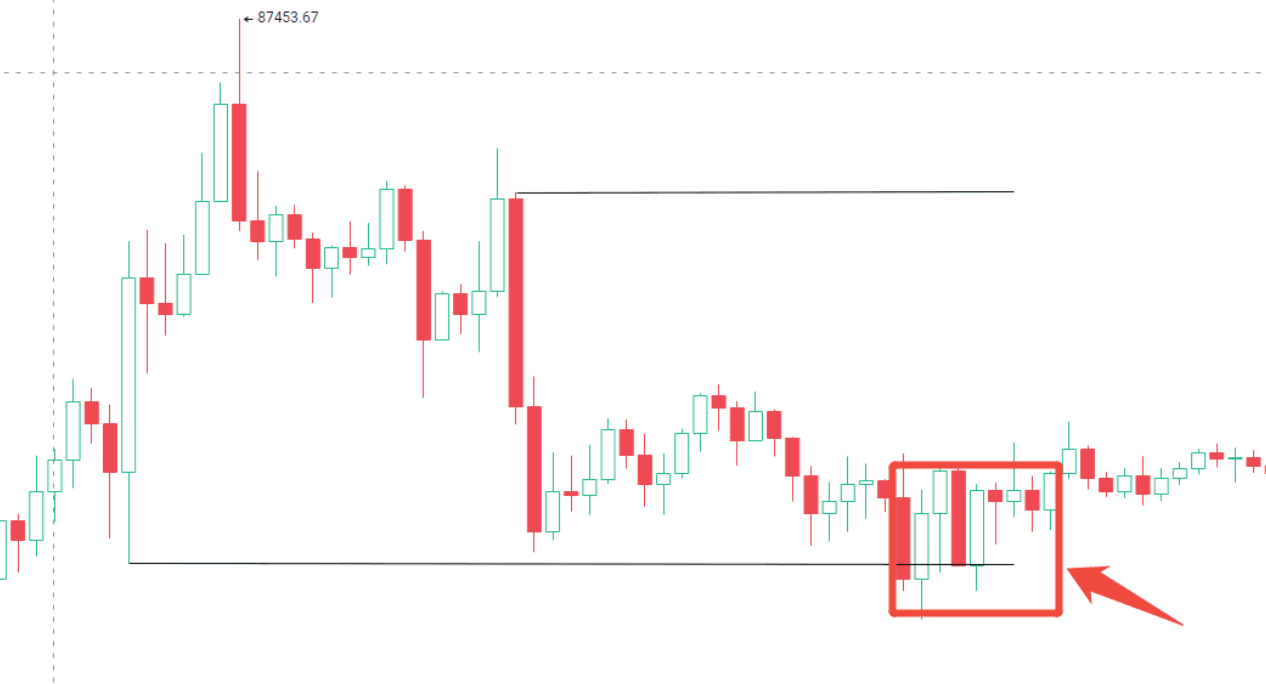
Here comes the key point! How do we use these candlesticks to determine support and resistance? It's super simple: to find support, look at the lowest price of the vertical demand candlestick
To find resistance, look at the highest price of the vertical supply candlestick.
Moreover, these levels usually need to be tested again. For example, after the vertical demand candlestick forms support, the price often comes back to test this level. Here, I want to teach you a super practical concept—"downward rebound," which is professionally termed the "spring effect." This means that the price seems to have broken below support but quickly pulls back, which is a typical false breakdown, often a trap set by major players!
The reverse is also true; the resistance level formed by the vertical supply candlestick will also be tested repeatedly. However, it is important to note: if a large bearish candle follows a vertical demand candlestick, or a large bullish candle follows a vertical supply candlestick, then this signal becomes invalid! Just like the bullish candle last Friday, which looked strong, but the next day was engulfed by a bearish candle; this is a typical invalid signal.

To make it easier for everyone to practice, I have specially developed a [Volume-Price Support and Resistance Mirror] indicator that can automatically mark these key candlesticks. The subscription link is here: https://www.aicoin.com/link/script-share/details?shareHash=AdE6zPdnX4ADzPV8. With this indicator, you will never miss the signals of major players entering the market!
Remember my words: observing the relationship between volume and price is more useful than any indicator! Next time you see a vertical demand candlestick, don’t hesitate, follow the major players to profit; when you encounter a vertical supply candlestick, run quickly, don’t wait until you’re trapped to regret. If you want to learn volume-price analysis more systematically, remember to tune in to our AiCoin live broadcast every Monday and Thursday at 16:00!
Hurry up and download the AiCoin client to start your volume-price analysis journey! Those who missed today’s live broadcast can watch the replay, and we’ll see you next time!
免责声明:本文章仅代表作者个人观点,不代表本平台的立场和观点。本文章仅供信息分享,不构成对任何人的任何投资建议。用户与作者之间的任何争议,与本平台无关。如网页中刊载的文章或图片涉及侵权,请提供相关的权利证明和身份证明发送邮件到support@aicoin.com,本平台相关工作人员将会进行核查。


